

The lysine-specific methyltransferase KMT2C/MLL3 regulates DNA repair components in cancer
- PMID: 30665945
- PMCID: PMC6399616
- DOI: 10.15252/embr.201846821
The lysine-specific methyltransferase KMT2C/MLL3 regulates DNA repair components in cancer
Abstract
Genome-wide studies in tumor cells have indicated that chromatin-modifying proteins are commonly mutated in human cancers. The lysine-specific methyltransferase 2C (KMT2C/MLL3) is a putative tumor suppressor in several epithelia and in myeloid cells. Here, we show that downregulation of KMT2C in bladder cancer cells leads to extensive changes in the epigenetic status and the expression of DNA damage response and DNA repair genes. More specifically, cells with low KMT2C activity are deficient in homologous recombination-mediated double-strand break DNA repair. Consequently, these cells suffer from substantially higher endogenous DNA damage and genomic instability. Finally, these cells seem to rely heavily on PARP1/2 for DNA repair, and treatment with the PARP1/2 inhibitor olaparib leads to synthetic lethality, suggesting that cancer cells with low KMT2C expression are attractive targets for therapies with PARP1/2 inhibitors.
Keywords: DNA repair; KMT2C; PARPi sensitivity; epigenetic regulation.
© 2019 The Authors. Published under the terms of the CC BY 4.0 license.
Conflict of interest statement
The authors declare that they have no conflict of interest.
Figures
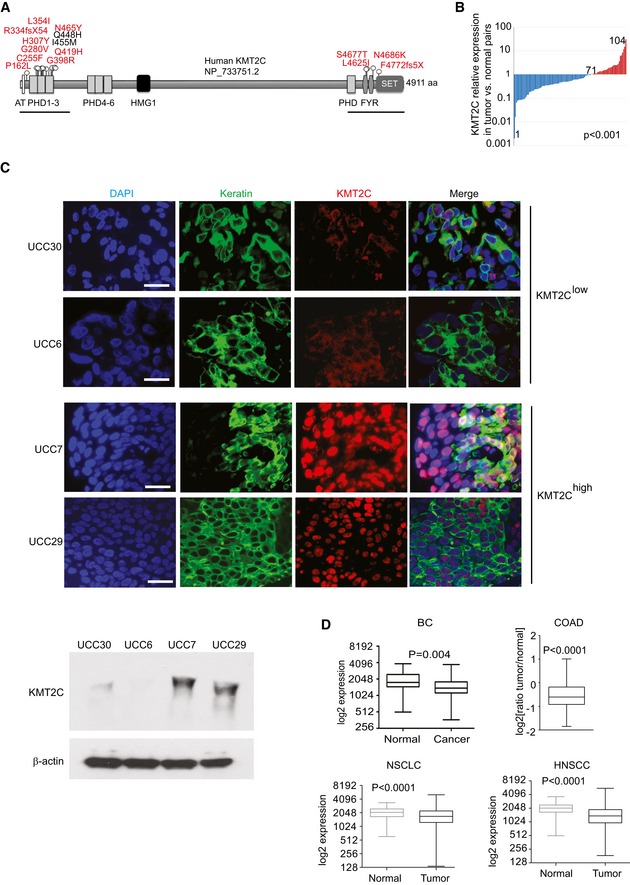
KMT2C mutations identified in our study cohort of human bladder cancers. Mutations in red are predicted to be damaging while those in black benign, according to the PolyPHEN‐2 algorithm (D and B, respectively, in Table EV1) 95.
Comparison of KMT2C expression in cancer/healthy matched tissue pairs (n = 104) of the study cohort. Expression is presented as log(ratio tumor/healthy) in the y‐axis. Data obtained from qRT–PCR analysis. P value calculated by Wilcoxon signed‐rank test.
Immunofluorescence (top) and Western blot analysis (bottom) against KMT2C on representative human bladder cancers with variable KMT2C transcript levels: 11th, 4th, 93rd, and 79th percentiles for UCC30, 6, 7, and 29, respectively (Appendix Table S2), from the differential expression analysis of the study cohort. Antibodies against KRT5 or KRT20 were used to stain urothelial cells and DAPI as nuclear counterstain. β‐Actin is used as loading control in Western blots. Scale bars indicate 50 μm.
Comparison of KMT2C expression in human healthy and cancer tissues from bladder cancer (BC, n = 136), colorectal adenocarcinoma (COAD, n = 128), non‐small‐cell lung cancer (NSCLC, n = 341), and head and neck squamous cell carcinoma (HNSCC, n = 174) patients. For NSCLC analysis, separate cohorts from adenocarcinoma and squamous cell carcinoma were combined. Separate analysis of the two NSCLC subtypes (adenocarcinoma and squamous cell carcinoma) yielded the same results. For COAD, the y‐axis is the log2(ratio tumor/normal) of KMT2C expression as assessed with Affymetrix microarray. All expression data were obtained from TCGA through cbioportal.org. P values calculated by Mann–Whitney U‐test. The middle lines inside the boxes indicate the median (50th percentile). The lower and the upper box boundaries represent the 25th percentile and the 75th percentile, respectively. The lower and upper whiskers extend to the lowest and highest values, respectively, within the 1.5× interquartile range (box height) from the box boundaries.
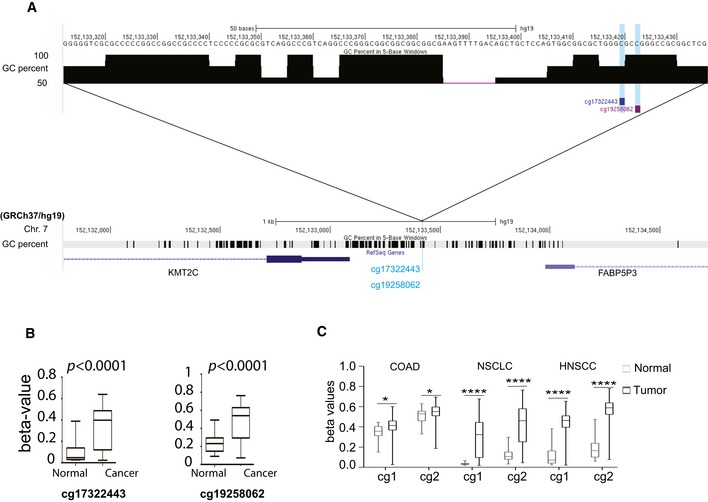
Schematic of the upstream promoter region of the KMT2C locus indicating the position and sequence of methylation detection probes within the CpG island (located at chr7:152435133–152437025, assembly GRCh38/hg38) that encompasses the KMT2C promoter region.
Comparison of the methylation levels of the above probes in tumor samples and normal bladder tissue. Methylation data were obtained from TCGA through the MethHC database for n = 21 healthy/tumor pairs. Wilcoxon matched‐pairs signed‐rank test was used.
Tumor vs. normal paired comparison of the methylation levels in the KMT2C promoter in various cancer types; cg1: cg17322443; cg2: cg19258062. Methylation data were obtained from the MethHC database (Huang et al 29). BC: n = 21, COAD: n = 21, NSCLC: n = 70, HNSCC: n = 50. For NSCLC analysis, separate cohorts from adenocarcinoma and squamous cell carcinoma were combined. Separate analysis of the two NSCLC subtypes yielded the same results. Wilcoxon matched‐pairs signed‐rank test was used. * designates P‐value < 0.05 and ****P‐value < 0.0001.
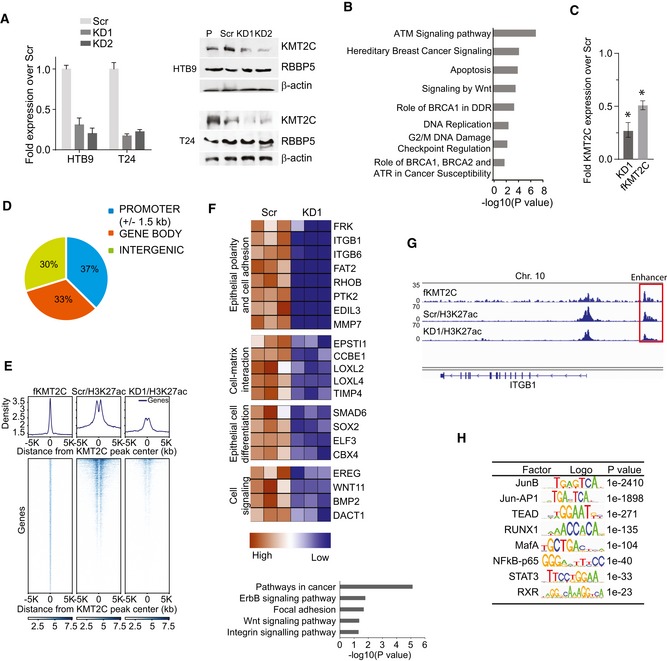
KMT2C transcript (left) and protein (right) levels in human bladder cancer cell lines stably transduced with lentiviral vectors expressing shRNAs against KMT2C (KD1 and KD2) in comparison with Scr control cells expressing scrambled shRNAs (Scr). RBBP5, another COMPASS complex protein used as internal control and b‐actin as loading control. Transcript levels were assessed by qRT–PCR in triplicates, and values shown represent mean ± SEM.
Bar graph showing selected biological processes and signaling pathways obtained from Gene Ontology (GO) enrichment analysis for the 3,324 differentially expressed genes between Scr control and KMT2C/KD1 HTB9 cells. Expression values were obtained from RNA‐seq data.
Quantitative RT–PCR for KMT2C in HTB9/KD1 cells, and HTB9/KD1 cells stably transfected with a plasmid expressing a Flag‐tagged full‐length KMT2C protein (fKMT2C). Expression levels are shown in the y‐axis as respective ratios over KMT2C expression in Scr control cells (Scr expression corresponds to 1). Experiments were performed in triplicates and analyzed with Mann–Whitney U‐test. Values shown represent mean ± SEM. * designates P‐value < 0.05.
Genome distribution of KMT2C peaks in HTB9/KD1 cells complemented with fKMT2C. Data obtained from ChIP‐seq experiments.
Density plot indicating KMT2C binding and H3K27ac levels on active enhancers in Scr control and KD1 HTB9 cells.
Bar graph showing selected biological processes and signaling pathways obtained from Gene Ontology (GO) enrichment analysis for 253 genes in proximity to active enhancers affected by KMT2C knockdown and heatmap of their expression (> 1.5‐fold H3K27ac and mRNA downregulation). Data obtained from ChIP‐seq and RNA‐seq experiments.
Bedgraph indicating KMT2C binding and H3K27ac at a putative enhancer of the ITGB1 locus before and after KMT2C knockdown in HTB9 cells.
Transcription factor binding motif analysis on active enhancers affected by KMT2C knockdown. Data obtained from ChIP‐seq experiments.
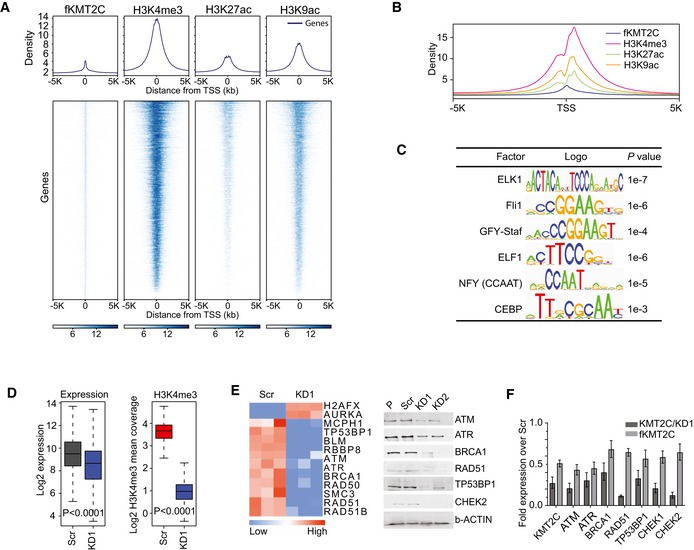
Density plot indicating KMT2C binding and H3K4me3, H3K27ac, and H3K9ac levels on transcription start sites (TSS) in HTB9 cells.
Histogram indicating distribution of histone modifications around transcription start sites (TSS ± 5,000 bp). Data obtained from ChIP‐seq with antibodies against the indicated histone modifications.
Transcription factor binding motif analysis on TSS of genes transcriptionally affected by KMT2C knockdown. Data obtained from ChIP‐seq experiments.
Boxplot indicating expression (left) and H3K4me3 levels (right) of genes with KMT2C presence on their promoters in Scr control and KMT2C/KD1 cells. Median comparison of Expr/K4 m3 values was performed with two‐tailed paired Wilcoxon rank sum test with continuity correction. The middle lines inside the boxes indicate the median (50th percentile). The lower and the upper box boundaries represent the 25th percentile and the 75th percentile, respectively. The lower and upper whiskers extend to the lowest and highest values, respectively, within the 1.5× interquartile range (box height) from the box boundaries.
Heatmap comparison of the expression levels of genes implicated in DDR between control (Scr) and KMT2C‐knockdown (KD1) HTB9 cells (left). Expression data were obtained from RNA‐seq experiments. Western blot analysis of selected proteins in control (Scr) and KMT2C‐knockdown (KD1 and KD2) HTB9 cells (right).
Expression level restoration of selected genes in KMT2C/KD1 HTB9 cells complemented with exogenously expressed Flag‐tagged KMT2C (fKMT2C). Data obtained by qRT–PCR. Experiments were performed in triplicates, and values shown represent mean ± SEM.
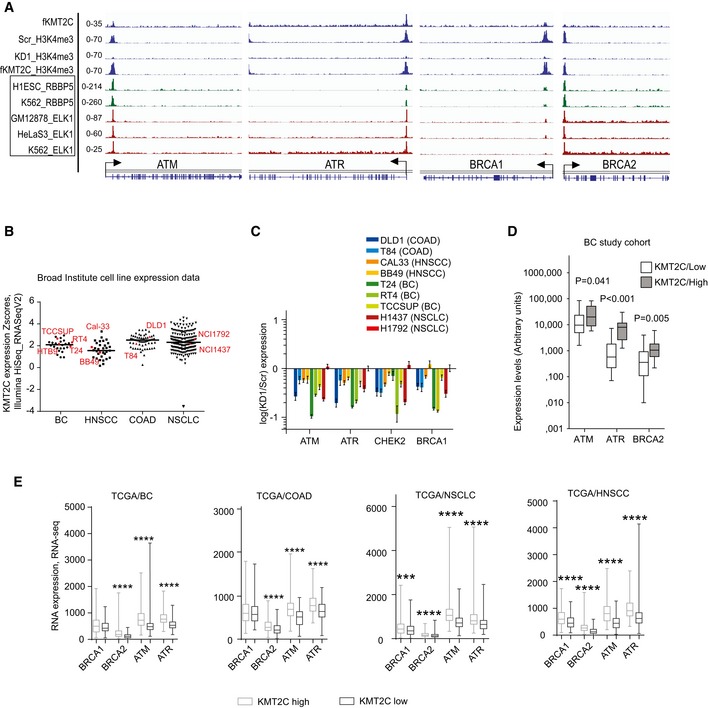
Bedgraphs indicating KMT2C and H3K4me3 binding at the TSS of indicated loci in HTB9 cells; also, from published studies available at the ENCODE, the binding of the COMPASS complex member RBBP5 and the transcription factor ELK1 is indicated in the same loci.
KMT2C expression (y‐axis) in various human cell lines (x‐axis). Cell lines under study are indicated as red geometrical schemes. Data were obtained directly from the Broad Institute CCLE server.
Expression levels of indicated genes in indicated cell lines upon KMT2C knockdown. Expression is shown as log(KD1/Scr) in the y‐axis. Remaining KMT2C transcript levels for all knockdown experiments can be found in Table EV2. Note that H1792 which shows poor KD1 (˜25%) also shows no change in ATM, ATR, BRCA1, and BRCA2 expression (light red bar appearing last in each set). Experiments were performed in triplicates. In plots, bars represent mean ± SEM.
Correlation in expression levels between KMT2C and indicated genes in our study cohort of superficial and muscle‐invasive BC. Data obtained from qRT–PCR. Experiments were performed in duplicates. P values were calculated by Mann–Whitney U‐test.
Correlation in expression levels between KMT2C and indicated genes in BC, COAD, NSCLC, and HNSCC tumors. RNA‐seq data were obtained from the TCGA through cbioportal.org. Mann–Whitney U‐test was used. *** designates P‐value < 0.001 and ****P‐value < 0.0001.
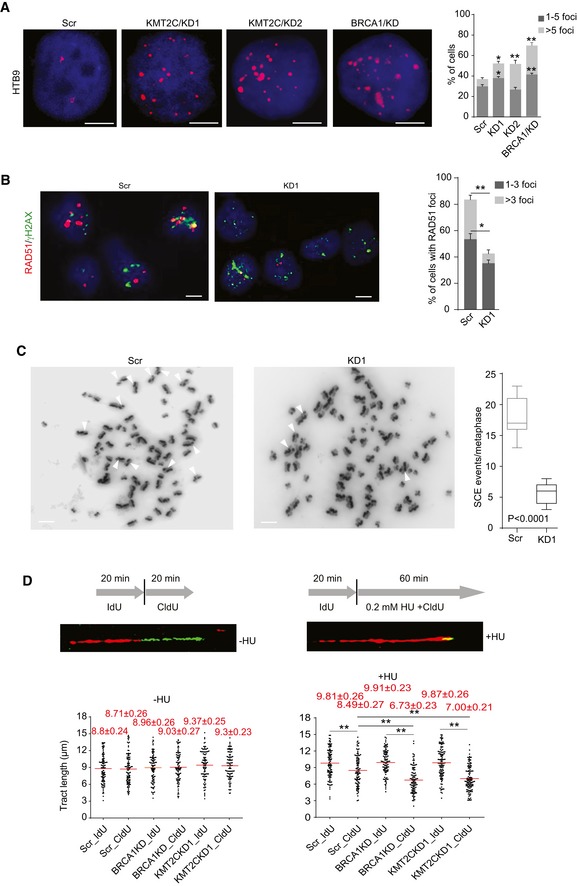
Immunofluorescence of γH2AX foci (left) and quantitation (right) in control (Scr) and KMT2C‐knockdown (KMT2C/KD1 and KD2) HTB9 cells. BRCA1 knockdown (BRCA1/KD) is used as control. The y‐axis indicates added percentage of cells with 1–5 and > 5 foci for each cell type. Scale bars indicate 5 μm. All comparisons have been performed against Scr control cells. Values in the bargraph represent mean ± SEM from three experiments. Student's t‐test was used. * designates P‐value < 0.05, and ** designates P‐value < 0.01.
Frequency of RAD51 foci in cisplatin‐treated HTB9 control (Scr) and KMT2C‐knockdown (KD1) cells. The y‐axis indicates added percentage of cells with 1–3 and 3 foci. Scale bars indicate 10 μm. Values in the bargraph represent mean ± SEM from three experiments. Student's t‐test was used. * designates P‐value < 0.05, and ** designates P‐value < 0.01.
Sister chromatid exchange (SCE) assay with cisplatin‐treated HTB9 control (Scr) and KMT2C‐knockdown (KD1) cells. Red arrowheads indicate sister chromatid exchange events. Results were obtained from 15 metaphases per group. Mann–Whitney U‐test was used.
DNA fiber assay on control (Scr) and KMT2C‐knockdown (KD1) HTB9 cells. BRCA1‐knockdown cells are used as controls. Experiments performed with or without hydroxyurea (HU) treatment under the conditions indicated in the schematic. Examples of DNA fibers from HTB9/KD1 cells are shown. The length of minimum 100 fibers from each condition was measured. Values in the plot are means ± SEM. Mann–Whitney U‐test was used. ** designates P‐value < 0.01.
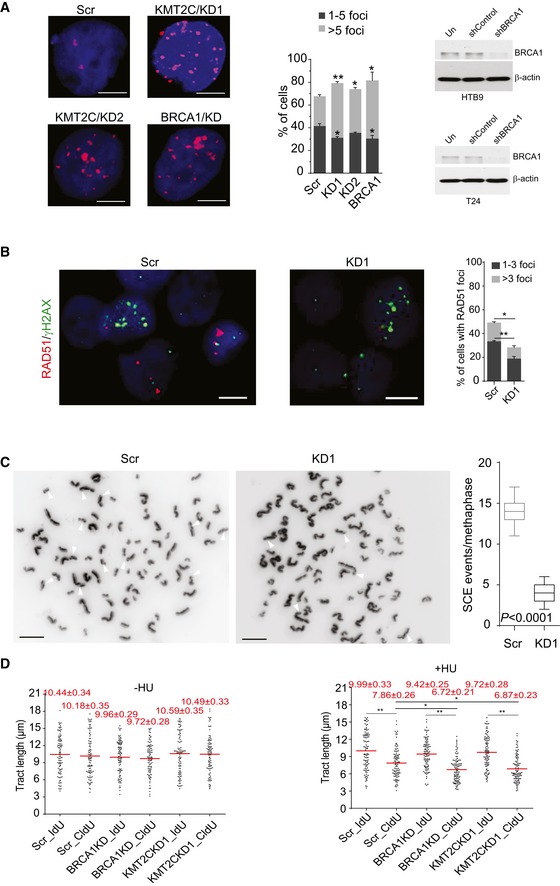
Immunofluorescence of γH2AX foci and quantitation in control (Scr) and KMT2C‐knockdown (KMT2C/KD1 and KD2) T24 cells. BRCA1 knockdown (BRCA1/KD) is used as control. Scale bars indicate 10 μm. Values in the plot correspond to mean ± SEM. Data from three experiments were analyzed with Student's t‐test. * designates P‐value < 0.05, and ** designates P‐value < 0.01. Remaining protein levels of BRCA1 are also shown for both HTB9 (referring to Fig 5A) and T24 are also shown.
Frequency of RAD51 foci in cisplatin‐treated T24 control (Scr) and KMT2C‐knockdown (KD1) cells. Scale bars indicate 10 μm. Values in the plot correspond to mean ± SEM. Data from three experiments were analyzed with Student's t‐test. * designates P‐value < 0.05, and ** designates P‐value < 0.01.
Sister chromatid exchange assay with cisplatin‐treated T24 control (Scr) and KMT2C‐knockdown (KD1) cells. Results were obtained from 15 metaphases per group. White arrowheads indicate sister chromatid exchange events.
DNA fiber assay on control (Scr) and KMT2C‐knockdown (KD1) T24 cells. BRCA1‐knockdown cells are used as controls. Experiments performed with or without hydroxyurea (HU) treatment under the conditions indicated in Fig 5D. The length of minimum 100 fibers from each condition was measured. Red horizontal lines indicate the median tract length in each group.
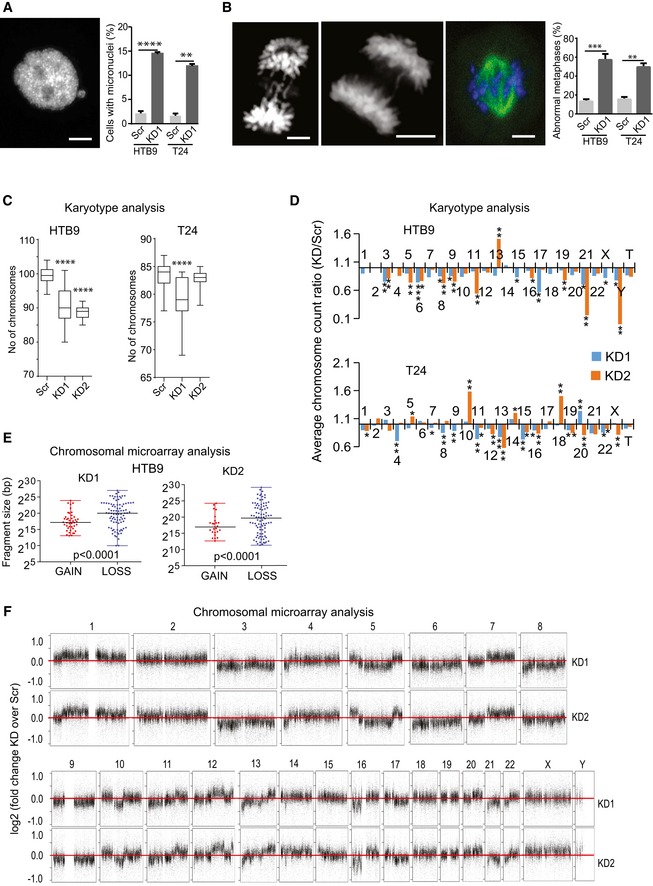
Representative image (from HTB9/KD1 cells) and frequency of both HTB9 and T24 control (Scr) and KMT2C/KD1 cells with micronuclei. Scale bar indicates 5 μm. Values represent mean ± SEM from three experiments. Student's t‐test was used. ** designates P‐value < 0.01 and ****P‐value < 0.0001.
Representative images (from HTB9 cells) and frequency of abnormal metaphases presenting lagging chromosomes, chromosome bridges, and chromosome congression in HTB9 and T24 control (Scr) and KMT2C/KD1 cells. Scale bar indicates 5 μm. Values represent mean ± SEM from three experiments. Student's t‐test was used. **designates P‐value < 0.01 and *** P‐value < 0.001.
Karyotypic analysis and chromosomal count in control (Scr) and KMT2C/KD1 and KD2 cells. All comparisons performed against Scr control cells. Metaphases studied: HTB9 Scr, n = 20; HTB9 KD1, n = 11; HTB9 KD2, n = 12; T24 Scr, n = 20; T24 KD1, n = 15; T24 KD2, n = 12. Mann–Whitney U‐test was used. **** designates P‐value < 0.0001.
Average chromosome count ration KD/Scr obtained from Giemsa‐stained metaphase spreads of HTB9 and T24 KD1 and KD2 cells. Number of metaphases studied: HTB9 Scr, n = 20; HTB9 KD1, n = 11; HTB9 KD2, n = 12; T24 Scr, n = 20; T24 KD1, n = 15; T24 KD2, n = 12. Mann–Whitney U‐test was used. * designates P‐value < 0.05, **P‐value < 0.01, and ***P‐value < 0.001.
Fragment size of gains and losses obtained from CMA on HTB9/KD1 and KD2 cells. Mann–Whitney U‐test was used. One sample from each cell type was used in CMA.
Copy number gains and losses of HTB9 KD1 and KD2 cells in comparison with HTB9/Scr controls. Data obtained from CMA. Values as presented as log(KD1/Scr) in the y‐axis. The horizontal red line indicates log value 0, which corresponds to no change. Note that for the majority of chromosomes there are losses in the KD1 cells.
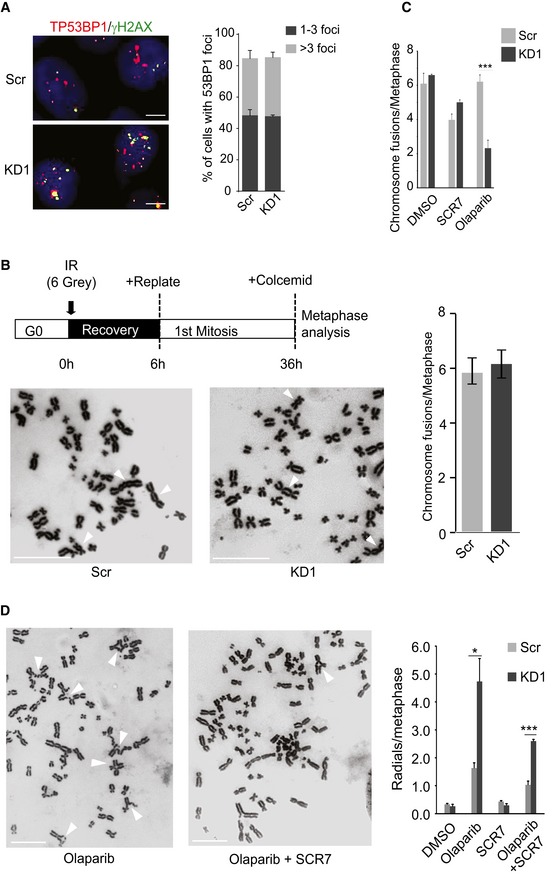
Frequency of TP53BP1 foci in cisplatin‐treated HTB9 control (Scr) and KMT2C‐knockdown (KD1) cells. Size bars in microscopy panels correspond to 5 μm. In the plot, bars represent mean ± SEM from n = 3 experiments.
Frequency of chromosome fusions obtained from IR‐treated (schematic) HTB9 control (Scr) and KMT2C‐knockdown (KD1) cells. Representative karyotypes are shown. Size bars in karyotype panels correspond to 10 μm. White arrows indicate chromosome fusion events. In the plot, bars represent mean ± SEM from n = 3 experiments.
Frequency of chromosome fusions in IR‐treated HTB9 control (Scr) and KMT2C‐knockdown (KD1) cells upon treatment with SCR7 (30 μM) and olaparib (15 μM). Bars represent mean ± SEM from n = 3 experiments. *** designates P‐value < 0.001.
Frequency of radial chromosomes in IR‐treated HTB9 control (Scr) and KMT2C‐knockdown (KD1) cells upon treatment with SCR7 (30 μM), olaparib (15 μM), or both. Representative karyotypes are shown. Size bars in karyotype panels correspond to 10 μm. White arrows indicate radial structures. In the plot, bars represent mean ± SEM from n = 3 experiments. * designates P‐value < 0.05 and ***P‐value < 0.001.
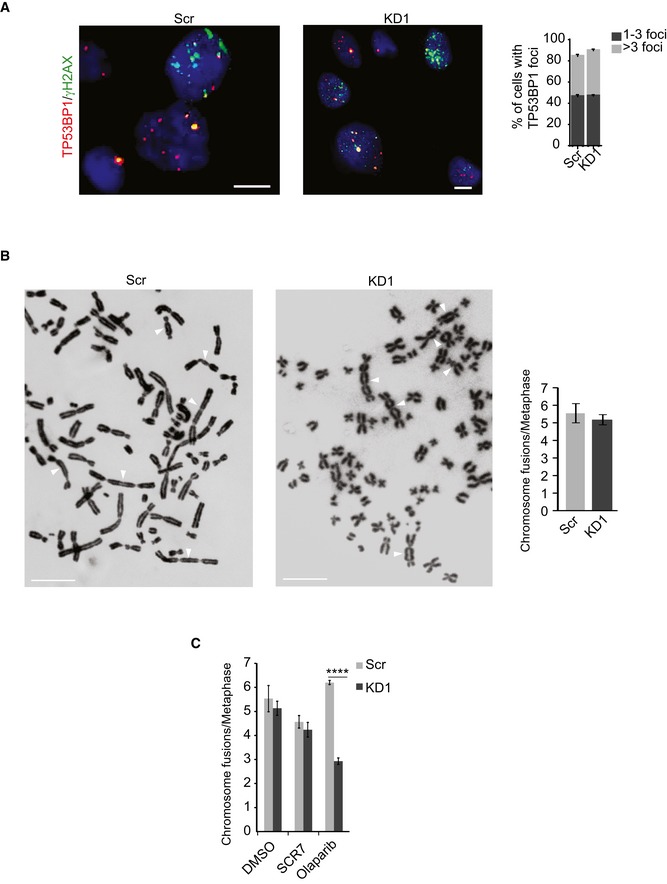
Frequency of TP53BP1 foci in cisplatin‐treated T24 control (Scr) and KMT2C‐knockdown (KD1) cells. Size bars in microscopy panels correspond to 10 μm. In the plot, bars represent mean ± SEM from n = 3 experiments.
Frequency of chromosome fusions obtained from IR‐treated (schematic) T24 control (Scr) and KMT2C‐knockdown (KD1) cells. Representative karyotypes are shown. Size bars in karyotype panels correspond to 5 μm. White arrows indicate chromosome fusions. In the plot, bars represent mean ± SEM from n = 3 experiments.
Frequency of chromosome fusions in IR‐treated T24 control (Scr) and KMT2C‐knockdown (KD1) cells upon treatment with SCR7 and olaparib. Bars represent mean ± SEM from n = 3 experiments. Throughout the figure, Mann–Whitney U‐test was used.
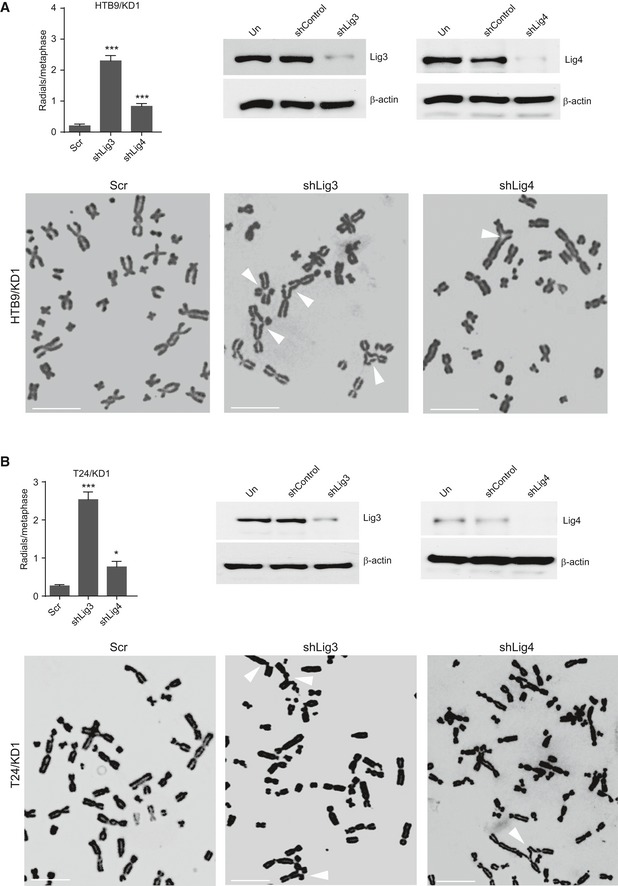
- A, B
Frequency of radial structures in IR‐treated HTB9/KD1 (A) and T24/KD1 (B) cells upon ligase III and ligase IV knockdown (top left), and Western blot analysis indicating respective leftover protein levels (top right). Representative karyotypes are shown. Values in the plot indicate mean ± SEM. Analysis of three experiments was performed using Student's t‐test. * designates P‐value < 0.05 and ***P‐value < 0.001.
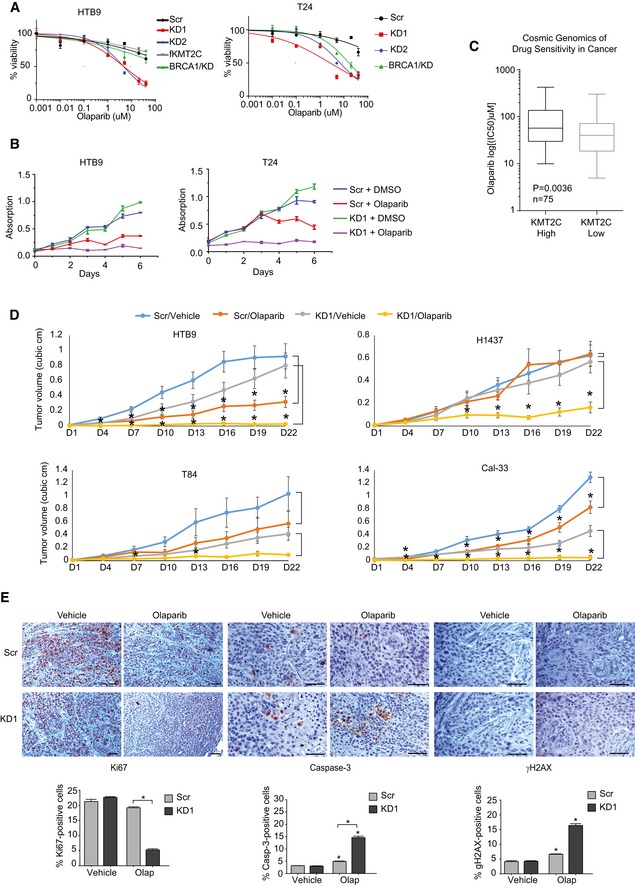
MTT assays on untreated control (Scr) and KMT2C/KD cells. BRCA1/KD cells are used as controls. Values represent mean ± SEM from three experiments.
MTT assays with IR‐treated control (Scr) and KMT2C/KD1 cells treated with 15 μM olaparib. Values represent mean ± SEM from three experiments.
Boxplot indicating olaparib IC50 of BLCA, HNSCC, COAD, and NSCLC cell lines from publicly available data (
https://www.cancerrxgene.org/ ). KMT2Chigh and KMT2Clow indicate that KMT2C expression of the cell line is at the top and bottom 50% of the cohort, respectively (data obtained from cbioportal.org; Cancer Cell Line Encyclopedia). Mann–Whitney U‐test was used.Tumor volume obtained from xenografts of control and KMT2C/KD1 cells treated with vehicle or olaparib. The number of mice analyzed for each cohort and raw measurements are provided in Appendix Table S3. The following tumor weight averages (in grams) were obtained ±SEM for vehicle and olaparib, respectively: HTB9/Scr, 0.791 ± 0.155 and 0.468 ± 0.097; HTB9/KD1, 0.862 ± 0.156 and 0.072 ± 0.023; T84/Scr, 1.032 ± 0.217 and 0.413 ± 0.097; T84/KD1, 0.562 ± 0.159 and 0.105 ± 0.032; H1437/Scr, 0.661 ± 0.133 and 0.780 ± 0.133; H1437/KD1, 0.723 ± 0.099 and 0.363 ± 0.108; Cal‐33/Scr, 0.439 ± 0.051 and 0.301 ± 0.029; Cal‐33/KD1, 0.584 ± 0.224 and 0.05 ± 0.016. Statistically significant pairwise comparison with respective vehicle for each day is indicated with star. Mann–Whitney U‐test was used. * designates P‐value < 0.05. All statistical values including those between Scr and KD1 cells are provided in Appendix Table S4.
Immunohistochemistry with the indicated antibodies on tumor sections from control (Scr) and KMT2C/KD1 HTB9 cells grown subcutaneously in NOD/SCID mice which were treated with vehicle or olaparib. Statistically significant pairwise comparison with respective vehicle is indicated with stars on top of each column. All other statistically significant comparisons are indicated with squared brackets connecting pairs under comparison. In microscopy images, scale bars indicate 50 μm. In bargraphs, values correspond to mean ± SEM from n = 3 experiments. Student's t‐test was used for the analysis. * designates P‐value < 0.05.
References
-
- Nikoloski G, Langemeijer SM, Kuiper RP, Knops R, Massop M, Tonnissen ER, van der Heijden A, Scheele TN, Vandenberghe P, de Witte T et al (2010) Somatic mutations of the histone methyltransferase gene EZH2 in myelodysplastic syndromes. Nat Genet 42: 665–667 - PubMed
Publication types
MeSH terms
Substances
LinkOut - more resources
Full Text Sources
Research Materials
Miscellaneous
