

Trends of Human Plague, Madagascar, 1998-2016
- PMID: 30666930
- PMCID: PMC6346457
- DOI: 10.3201/eid2502.171974
Trends of Human Plague, Madagascar, 1998-2016
Abstract
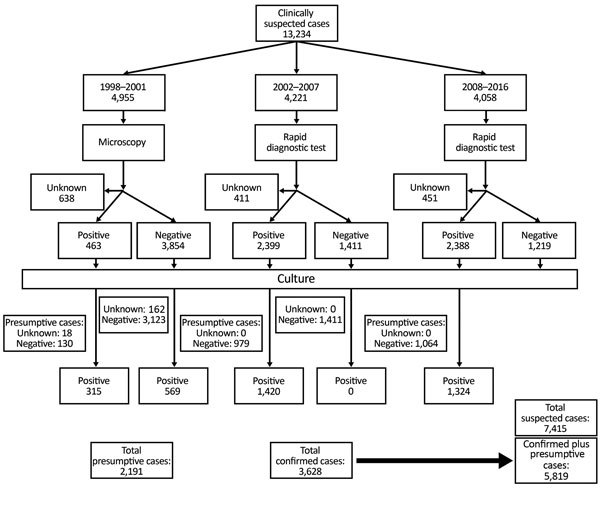
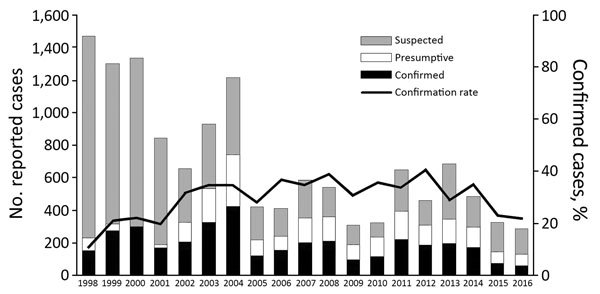
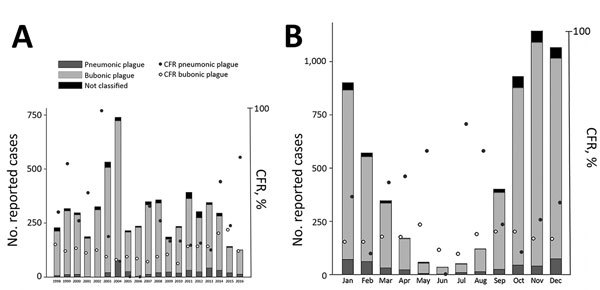
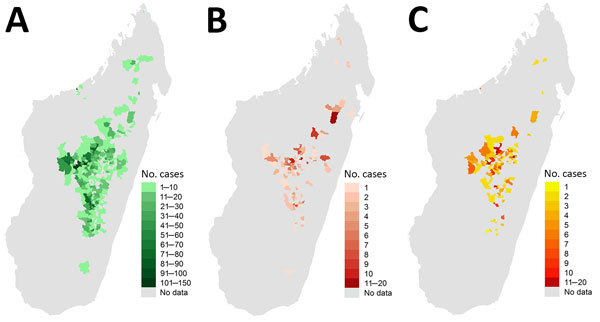
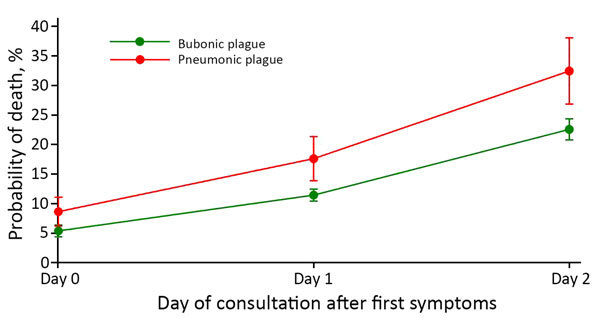
Madagascar is more seriously affected by plague, a zoonosis caused by Yersinia pestis, than any other country. The Plague National Control Program was established in 1993 and includes human surveillance. During 1998-2016, a total of 13,234 suspected cases were recorded, mainly from the central highlands; 27% were confirmed cases, and 17% were presumptive cases. Patients with bubonic plague (median age 13 years) represented 93% of confirmed and presumptive cases, and patients with pneumonic plague (median age 29 years) represented 7%. Deaths were associated with delay of consultation, pneumonic form, contact with other cases, occurrence after 2009, and not reporting dead rats. A seasonal pattern was observed with recrudescence during September-March. Annual cases peaked in 2004 and decreased to the lowest incidence in 2016. This overall reduction occurred primarily for suspected cases and might be caused by improved adherence to case criteria during widespread implementation of the F1 rapid diagnostic test in 2002.
Keywords: Madagascar; Yersinia pestis; bacteria; bubonic plague; case-fatality rate; fleas; human plague; plague; pneumonic plague; rats; trends; zoonoses.
Figures
References
-
- Bertherat E. Plague around the world, 2010–2015. Wkly Epidemiol Rec. 2016;91:89–93.
-
- Brygoo ER. [Epidemiology of the plague at Madagascar] [in French]. Med Trop (Mars). 1966;26:26–, 79.. - PubMed
-
- Migliani R, Chanteau S, Rahalison L, Ratsitorahina M, Boutin JP, Ratsifasoamanana L, et al. Epidemiological trends for human plague in Madagascar during the second half of the 20th century: a survey of 20,900 notified cases. Trop Med Int Health. 2006;11:1228–37. 10.1111/j.1365-3156.2006.01677.x - DOI - PubMed
Publication types
MeSH terms
Substances
LinkOut - more resources
Full Text Sources
Medical
