. 2019 Jan 22:8:e39982.
doi: 10.7554/eLife.39982.

The Crohn's disease polymorphism, ATG16L1 T300A, alters the gut microbiota and enhances the local Th1/Th17 response

Affiliations

The Crohn's disease polymorphism, ATG16L1 T300A, alters the gut microbiota and enhances the local Th1/Th17 response

Sydney Lavoie et al. Elife. .

Abstract

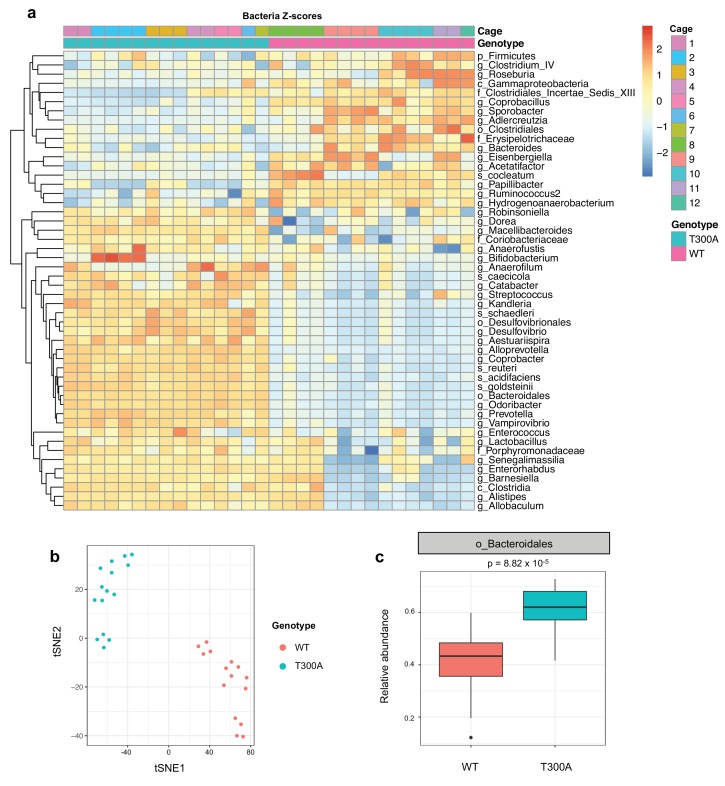
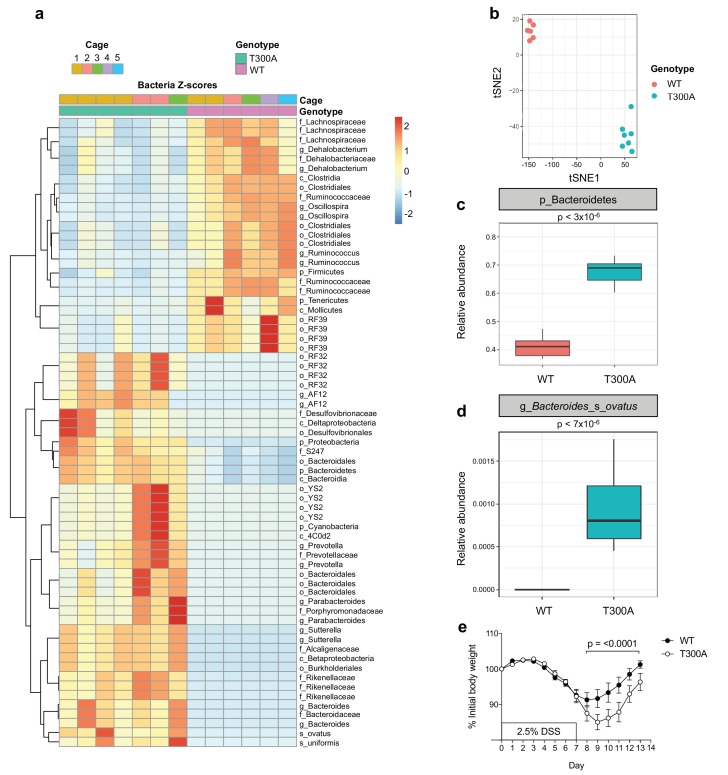
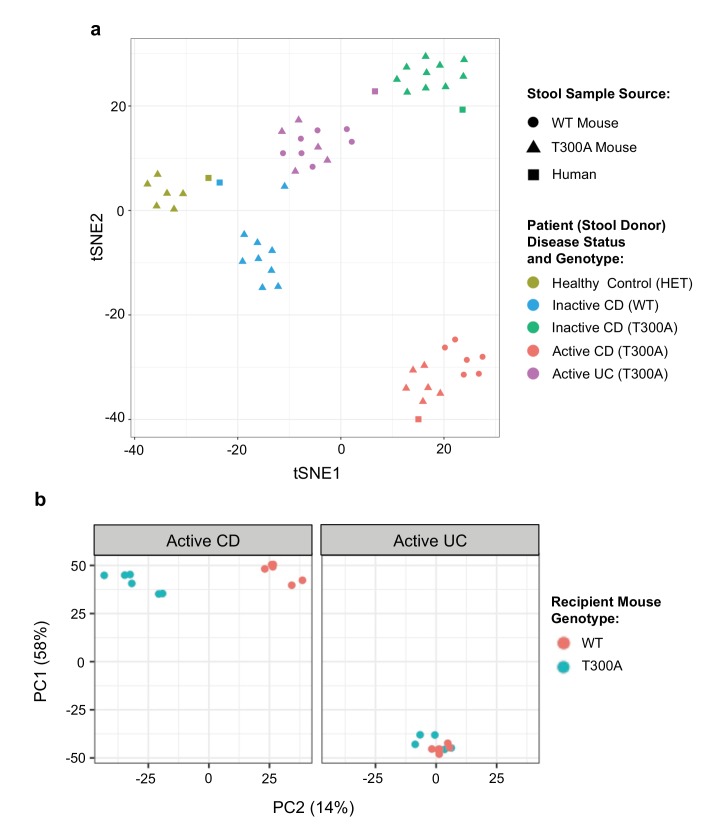
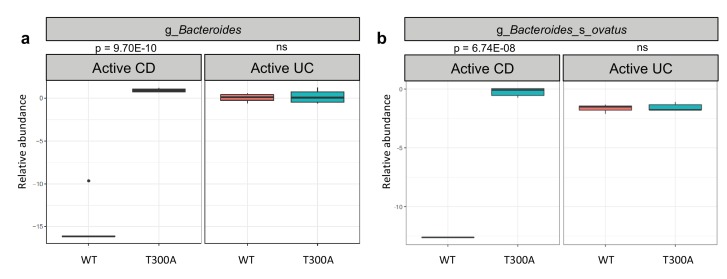
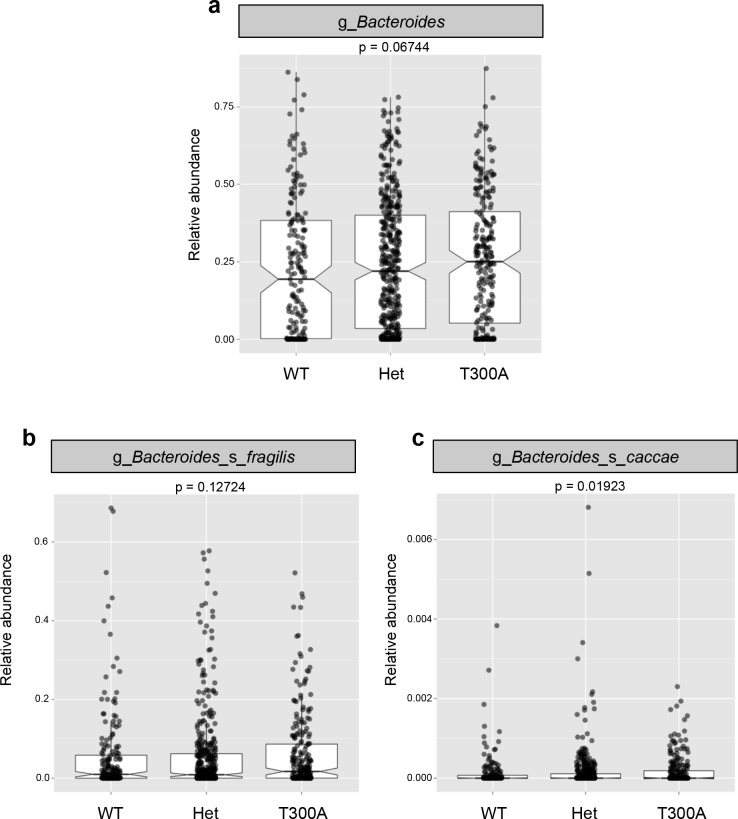
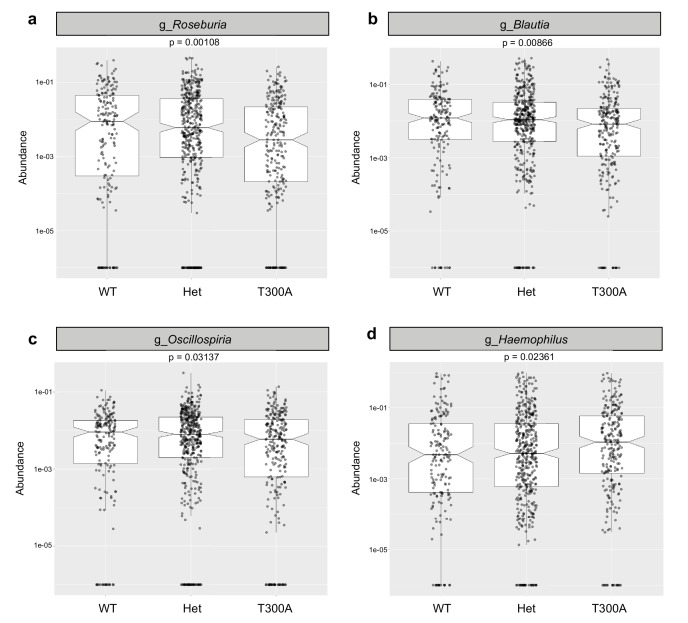
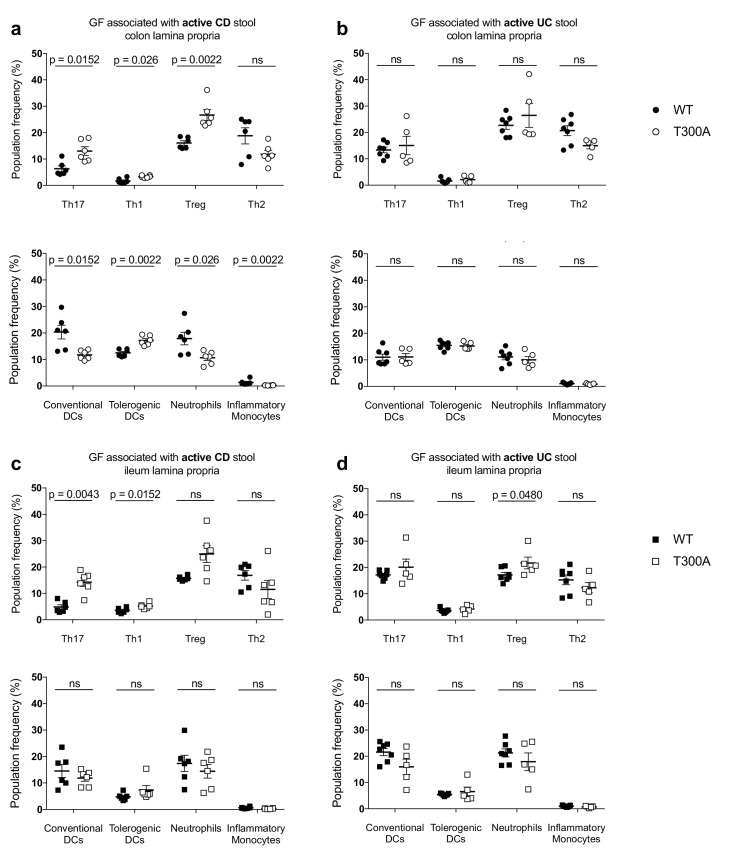
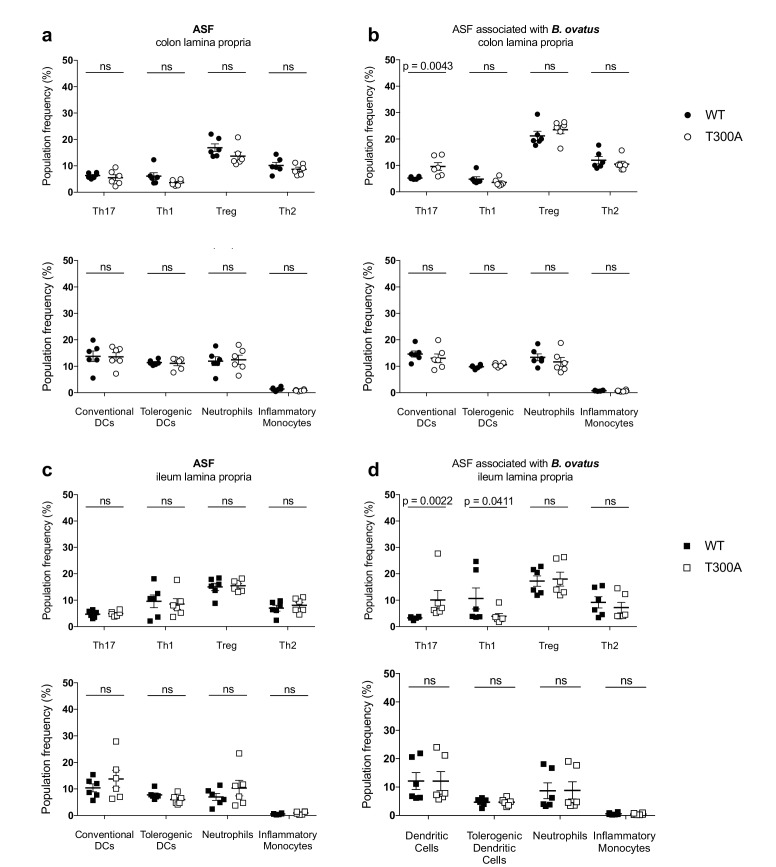
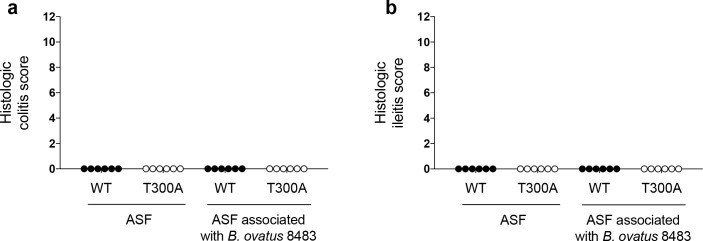
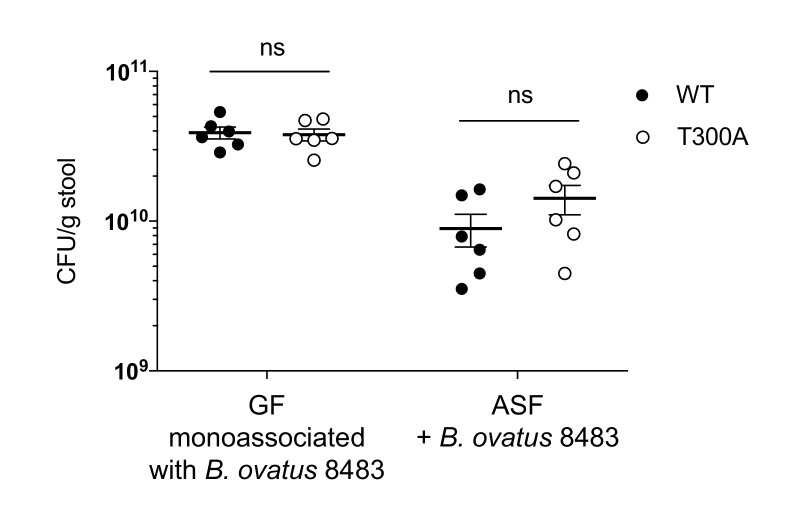
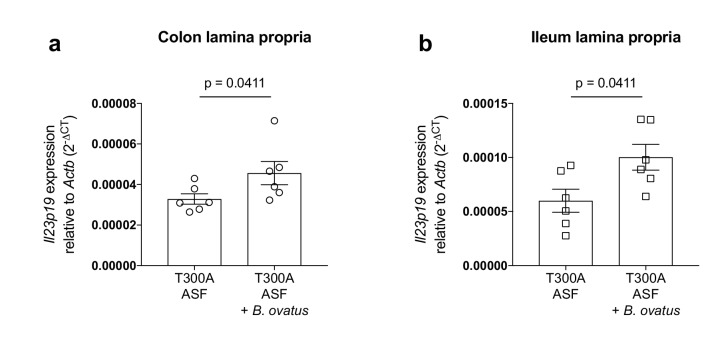
Inflammatory bowel disease (IBD) is driven by dysfunction between host genetics, the microbiota, and immune system. Knowledge gaps remain regarding how IBD genetic risk loci drive gut microbiota changes. The Crohn's disease risk allele ATG16L1 T300A results in abnormal Paneth cells due to decreased selective autophagy, increased cytokine release, and decreased intracellular bacterial clearance. To unravel the effects of ATG16L1 T300A on the microbiota and immune system, we employed a gnotobiotic model using human fecal transfers into ATG16L1 T300A knock-in mice. We observed increases in Bacteroides ovatus and Th1 and Th17 cells in ATG16L1 T300A mice. Association of altered Schaedler flora mice with B. ovatus specifically increased Th17 cells selectively in ATG16L1 T300A knock-in mice. Changes occur before disease onset, suggesting that ATG16L1 T300A contributes to dysbiosis and immune infiltration prior to disease symptoms. Our work provides insight for future studies on IBD subtypes, IBD patient treatment and diagnostics.

Keywords: ATG16L1T300A; Bacteroides; Bacteroides ovatus; Crohn's Disease; T cell; gut; immunology; infectious disease; inflammation; microbiology; mouse.


Conflict of interest statement

SL, KC, KL, HJ, HP, EC, MM, JL, CG, JD, JG, HV, AA, AK, RX No competing interests declared, WG Senior editor, eLife

Figures

Figure 1.
Figure 1.. Altered microbiota in conventionally-housed WT vs T300A mice.
12 week old WT and T300A mice were conventionally-housed in a specific pathogen free (SPF) facility. Stool samples were collected and analyzed by 16S rRNA gene amplicon sequencing. (a) Population analysis of 16S rRNA gene amplicon sequencing from stool samples from SPF WT vs. T300A mice. (p = phylum, c = class, o = order, f = family, g = genus, s = species) Bacteria Z-scores generated by limma. (b) t-Distributed Stochastic Neighbor Embedding (tSNE) plot analysis of WT vs. T300A SPF mouse stool samples. (c) Box plot analysis of the order Bacteroidales in WT vs. T300A SPF mouse stool samples.
Figure 2.
Figure 2.. Altered microbiota in conventionally-housed WT vs T300A mice with gut inflammation.
12 week old WT and T300A conventionally-housed SPF mice were treated with 2.5% DSS for 7d followed by 7d of regular drinking water. (a) Population analysis of 16S rRNA gene amplicon sequencing from stool samples from WT vs. T300A mice. (p = phylum, c = class, o = order, f = family, g = genus, s = species) Bacteria Z-scores generated by limma. (b) t-Distributed Stochastic Neighbor Embedding (tSNE) plot analysis of WT vs. T300A stool samples post DSS treatment. (c) Box plot analysis of the phylum Bacteroidetes in WT vs. T300A mice post DSS treatment. (d) Box plot analysis of B. ovatus in WT vs. T300A mice post DSS treatment. (e) Percent initial body weight of WT (n = 12) and T300A (n = 15) mice treated with 2.5% DSS for 7d followed by 7d of regular drinking water. Day 8–13 time points, p = < 0.0001. Two-way ANOVA with Tukey‘s post-hoc test.
Figure 2—figure supplement 1.
Figure 2—figure supplement 1.. T300A affects the microbiome gene function profile.
Significant alterations in gene function inferred from 16S rRNA gene amplicon sequencing data using PICRUSt from stool samples obtained from 12 wk old WT versus T300A conventionally-housed SPF mice treated with 2.5% DSS followed by 7d regular drinking water.
Figure 3.
Figure 3.. Distinct gut microbiota composition in mice associated with human stool.
GF mice were associated with human stool samples and analyzed after four wks. (a) tSNE dimensionality reduction analysis based on genus-level abundances of stool samples from human patient stool donor (square) or GF WT (circles) and T300A (triangles) mice four wks post association with 50 mg human stool from patients: healthy control, genotype Het (yellow), inactive CD, genotype WT (blue), inactive CD, genotype T300A (green), active CD, genotype T300A (red), or active UC, genotype T300A (purple). Each symbol represents data from an individual mouse. (b) PCA plot of stool samples from WT vs. T300A mice four wks post association with either active CD (left) or active UC (right) human stool. Each symbol represents data from an individual mouse.
Figure 4.
Figure 4.. T300A alters gut microbiota composition in GF mice associated with human stool.
Metagenomic population analysis (MetaPhlAn) on stool samples (four wk time point) from WT vs. T300A GF mice associated with human IBD stool samples (a) Box plot of the genus Bacteroides from stool samples from mice associated with active CD or active UC stool samples. (b) Box plot of B. ovatus from stool samples from mice associated with active CD or active UC stool samples. P-values were generated using Benjamini-Hochberg false discovery rate. (a, b) Y-axis is log10 relative abundance.
Figure 5.
Figure 5.. The presence of T300A in humans increases Bacteroides.
16S rRNA gene amplicon data from human stool samples from Jostins et al. 2012 (Jostins et al., 2012) cohort were analyzed for differences in the microbiota associated with the presence (T300A – GG), absence (WT – AA) or heterozygous (Het – AG) genotype. (g = genus, s = species). (a) Relative abundance of Bacteroides. (b) Relative abundance of B. fragilis. (c) Relative abundance of B. caccae.
Figure 5—figure supplement 1.
Figure 5—figure supplement 1.. The presence of T300A in humans reduces Clostrida spp. and increases Gammaproteobacteria.
16S rRNA gene amplicon data from human stool samples from Jostins et al. 2012 (Xavier and Podolsky, 2007) cohort were analyzed for differences in the microbiota associated with the presence (T300A – GG), absence (WT – AA) or heterozygous (Het – AG) genotype. (g = genus). (a) Relative abundance of Roseburia. (b) Relative abundance of Blautia. (c) Relative abundance of Oscillospira. (d) Relative abundance of Haemophilus.
Figure 6.
Figure 6.. Alterations in T cell and myeloid cell populations in the gut of T300A mice associated with stool from patients with active Crohn’s disease.
LP flow cytometry of T and myeloid cell populations from GF mice associated with 50 mg of frozen stool from a patient with Crohn’s disease (CD, WT n = 6 and T300A n = 6) or ulcerative colitis (UC, WT n = 7 and T300A n = 5) for four wks. T cells gated as the frequency of RORγt+ (Th17), T-bet+ (Th1), Foxp3+ (Treg) or GATA-3+ (Th2) cells out of CD3+CD4+ cells and myeloid cells gated as the frequency of CD11c+MHCII+ cells out of CD45+ cells (conventional DCs), CD11b-CD103+ cells out of CD11c+MHCII+ cells (tolerogenic DCs), CD11b+GR-1int cells out of CD45+ cells (neutrophils), and CD11b+GR-1hi cells out of CD45+ cells (inflammatory monocytes). CD3+CD4+ and myeloid cell populations were gated on single, live, CD45+ lymphocytes. (a) GF +CD stool colonic LP T cells (top) and myeloid cells (bottom) (b) GF +UC stool colonic LP T cells (top) and myeloid cells (bottom). (c) GF +CD stool ileal LP T cells (top) and myeloid cells (bottom) (d) GF +UC stool ileal LP T cells (top) and myeloid cells (bottom). Data are plotted as the mean ± SEM. ns = not significant. Mann-Whitney U test.
Figure 6—figure supplement 1.
Figure 6—figure supplement 1.. Representative T cell flow cytometry gating strategy.
LP cells from either the colon or ileum (distal 10 cm of the small intestine) were gated on single cells, live cells, CD45+, lymphocytes, CD3+CD4+ and finally T-bet+ out of CD3+CD4+ and RORγt+ out of CD3+CD4+.
Figure 6—figure supplement 2.
Figure 6—figure supplement 2.. Representative myeloid cell flow cytometry gating strategy.
LP cells from either the colon or ileum (distal 10 cm of the small intestine) were gated on single cells, live cells and CD45+. CD11c+MHCII+ (1 - conventional DCs) were gated out of CD45+ cells and CD11b-CD103+ cells (2 - tolerogenic DCs) were gated out of CD11c+MHCII+ cells. CD11b+GR-1hi (3 - inflammatory monocytes) and CD11b+GF-1int (4 - neutrophils) were gated out of CD45+.
Figure 6—figure supplement 3.
Figure 6—figure supplement 3.. Microbiota changes and immune infiltration occur in the absence of disease.
WT and T300A gnotobiotically housed mice were associated with human stool samples from patients with either active CD (WT n = 6, T300A n = 6) or active UC (WT n = 7, T300A n = 5). Histologic colitis/ileitis scores were calculated by grading monocyte infiltration, epithelial hyperplasia, epithelial injury and polymorphonuclear (PMN) cell infiltration, all from 0 to 3 for a maximum total score of 12. Histologic colitis scores from (a) the colon and (b) the ileum from mice associated with stool from patients with active CD or active UC. Data are plotted as mean ± SEM.
Figure 7.
Figure 7.. No change in immune cell population frequency in the gut of GF or GF mice monoassociated with B. ovatus 8483.
LP flow cytometry of T and myeloid cell populations from GF mice (WT n = 6, T300A n = 6) or GF mice associated with ~109 CFU of B. ovatus 8483 for three wks (WT n = 6, T300A n = 6). T cell populations are gated as the frequency of RORγt+ (Th17), T-bet+ (Th1), Foxp3+ (Treg) or GATA-3+ (Th2) cells out of CD3+CD4+ cells and myeloid cell populations are gated as the frequency of CD11c+MHCII+ cells out of CD45+ cells (conventional DCs), CD11b-CD103+ cells out of CD11c+MHCII+ cells (tolerogentic DCs), CD11b+GR-1int cells out of CD45+ cells (neutrophils), and CD11b+GR-1hi cells out of CD45+ cells (inflammatory monocytes). CD3+CD4+ and myeloid cell populations were gated on single, live, CD45+ lymphocytes. (a) GF colonic LP T cells (top) and myeloid cells (bottom) (b) GF +B. ovatus 8483 colonic LP T cells (top) and myeloid cells (bottom). (c) GF ileal LP T cells (top) and myeloid cells (bottom) (d) GF +B. ovatus 8483 ileal LP T cells (top) and myeloid cells (bottom). Data are plotted as the mean ± SEM. ns = not significant. Mann-Whitney U test.
Figure 8.
Figure 8.. Increased frequency of Th17 cells in the gut of T300A ASF mice associated with B. ovatus 8483.
LP flow cytometry of T cell and myeloid cell populations from ASF mice (WT n = 6 and T300A n = 6) or ASF mice associated with ~109 CFU of B. ovatus 8483 for 3 weeks (WT n = 6 and T300A n = 6). T cells gated as the frequency of RORγt+ (Th17), T-bet+ (Th1), Foxp3+ (Treg) or GATA-3+ (Th2) cells out of CD3+CD4+ cells and myeloid cell gated as the frequency of CD11c+MHCII+ cells out of CD45+ cells (conventional DCs), CD11b-CD103+ cells out of CD11c+MHCII+ cells (tolerogentic DCs), CD11b+GR-1int cells out of CD45+ cells (neutrophils), and CD11b+GR-1hi cells out of CD45+ cells (inflammatory monocytes). CD3+CD4+ cell and myeloid cell populations were gated on single, live, CD45+ lymphocytes. (a) ASF colonic LP T cells (top) and myeloid cells (bottom) (b) ASF +B. ovatus 8483 colonic LP T cells (top) and myeloid cells (bottom). (c) ASF ileal LP T cells (top) and myeloid cells (bottom) (d) ASF +B. ovatus 8483 ileal LP T cells (top) and myeloid cells (bottom). Data are plotted as the mean ± SEM. ns = not significant. Mann-Whitney U test.
Figure 8—figure supplement 1.
Figure 8—figure supplement 1.. Immune infiltration in ASF mice associated with B. ovatus occurs in the absence of disease.
WT and T300A ASF mice were associated ~109 CFU of B. ovatus 8483 for 3 weeks (WT n = 6, T300A n = 6). Histologic colitis/ileitis scores were calculated by grading monocyte infiltration, epithelial hyperplasia, epithelial injury and polymorphonuclear (PMN) cell infiltration, all from 0 to 3 for a maximum total score of 12. Histologic colitis/ileitis scores from (a) the colon and (b) the ileum of ASF mice or ASF mice associated with B. ovatus 8483. Data are plotted as mean ± SEM.
Figure 8—figure supplement 2.
Figure 8—figure supplement 2.. No differences in colonization levels of B. ovatus 8483 in GF or ASF mice.
GF mice (WT n = 6, T300A n = 6) or ASF mice (n = 6, T300A n = 6) were associated with ~109 CFU of B. ovatus 8483 for three wks. Fecal samples were taken at the three wk timepoint and CFU/g stool was calculated. ns = not significant. Two-way ANOVA with Tukey’s post-hoc test.
Figure 9.
Figure 9.. Increased expression of Il23p19 in the lamina propria from the colon and ileum of T300A ASF mice associated with B. ovatus 8483.
Expression of Il23p19 by qPCR from colon (a) and ileum (b) LP cells isolated from ASF T300A mice or ASF T300A mice associated with B. ovatus 8483.

References

    1. Abubucker S, Segata N, Goll J, Schubert AM, Izard J, Cantarel BL, Rodriguez-Mueller B, Zucker J, Thiagarajan M, Henrissat B, White O, Kelley ST, Methé B, Schloss PD, Gevers D, Mitreva M, Huttenhower C. Metabolic reconstruction for metagenomic data and its application to the human microbiome. PLOS Computational Biology. 2012;8:e1002358. doi: 10.1371/journal.pcbi.1002358. - DOI - PMC - PubMed
    1. Andoh A, Zhang Z, Inatomi O, Fujino S, Deguchi Y, Araki Y, Tsujikawa T, Kitoh K, Kim-Mitsuyama S, Takayanagi A, Shimizu N, Fujiyama Y. Interleukin-22, a member of the IL-10 subfamily, induces inflammatory responses in colonic subepithelial myofibroblasts. Gastroenterology. 2005;129:969–984. doi: 10.1053/j.gastro.2005.06.071. - DOI - PubMed
    1. Bel S, Pendse M, Wang Y, Li Y, Ruhn KA, Hassell B, Leal T, Winter SE, Xavier RJ, Hooper LV. Paneth cells secrete lysozyme via secretory autophagy during bacterial infection of the intestine. Science. 2017;357:1047–1052. doi: 10.1126/science.aal4677. - DOI - PMC - PubMed
    1. Bloom SM, Bijanki VN, Nava GM, Sun L, Malvin NP, Donermeyer DL, Dunne WM, Allen PM, Stappenbeck TS. Commensal Bacteroides species induce colitis in host-genotype-specific fashion in a mouse model of inflammatory bowel disease. Cell Host & Microbe. 2011;9:390–403. doi: 10.1016/j.chom.2011.04.009. - DOI - PMC - PubMed
    1. Cadwell K, Liu JY, Brown SL, Miyoshi H, Loh J, Lennerz JK, Kishi C, Kc W, Carrero JA, Hunt S, Stone CD, Brunt EM, Xavier RJ, Sleckman BP, Li E, Mizushima N, Stappenbeck TS, Virgin HW. A key role for autophagy and the autophagy gene Atg16l1 in mouse and human intestinal Paneth cells. Nature. 2008;456:259–263. doi: 10.1038/nature07416. - DOI - PMC - PubMed

Publication types

MeSH terms

Substances