

Feasibility study of a point-of-care positron emission tomography system with interactive imaging capability
- PMID: 30667069
- PMCID: PMC6453727
- DOI: 10.1002/mp.13397
Feasibility study of a point-of-care positron emission tomography system with interactive imaging capability
Abstract
Purpose: We investigated the feasibility of a novel positron emission tomography (PET) system that provides near real-time feedback to an operator who can interactively scan a patient to optimize image quality. The system should be compact and mobile to support point-of-care (POC) molecular imaging applications. In this study, we present the key technologies required and discuss the potential benefits of such new capability.
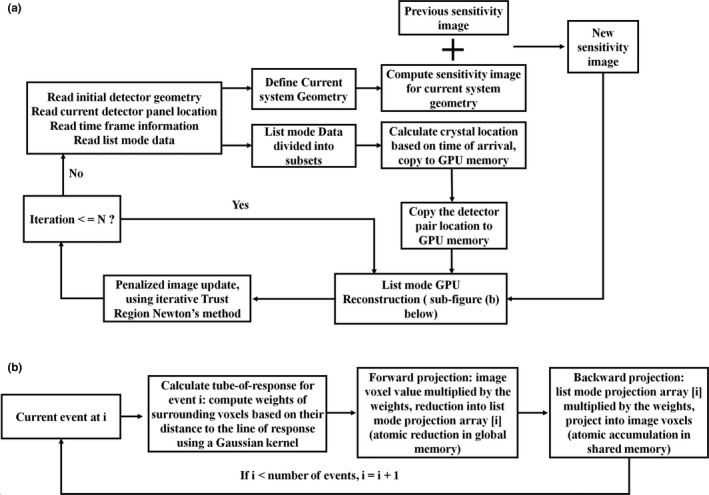
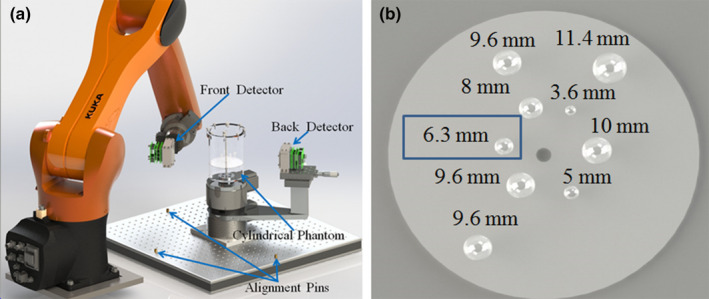
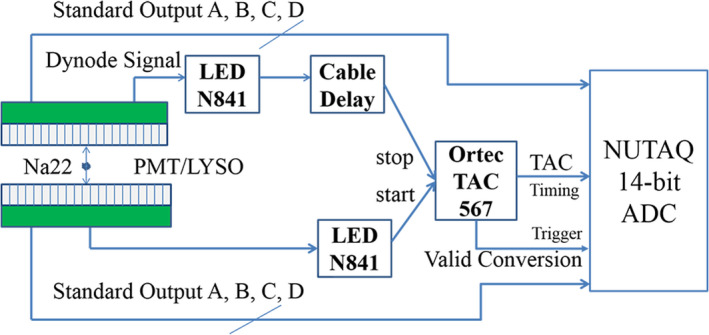
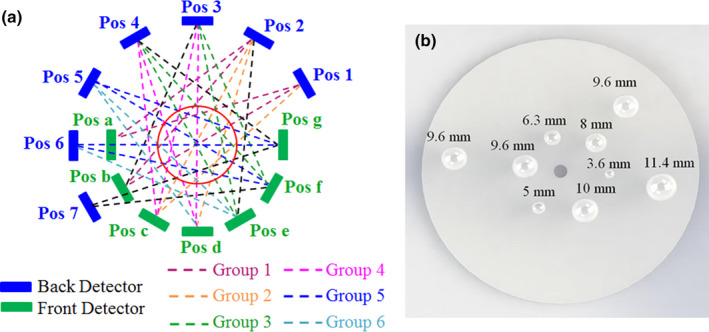
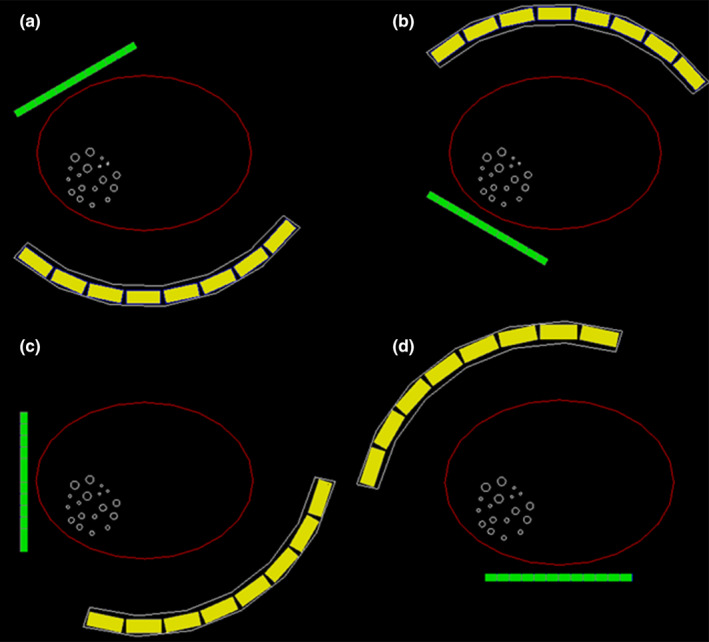
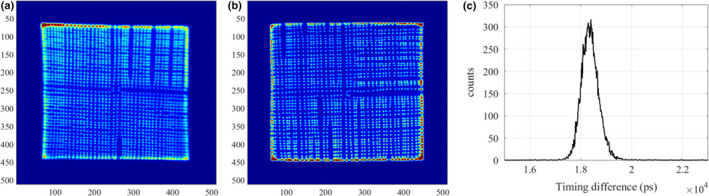
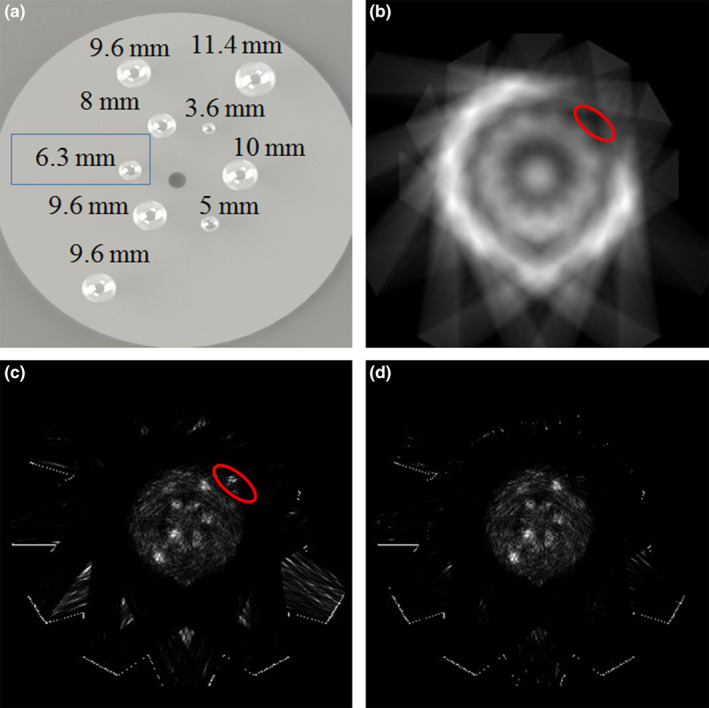
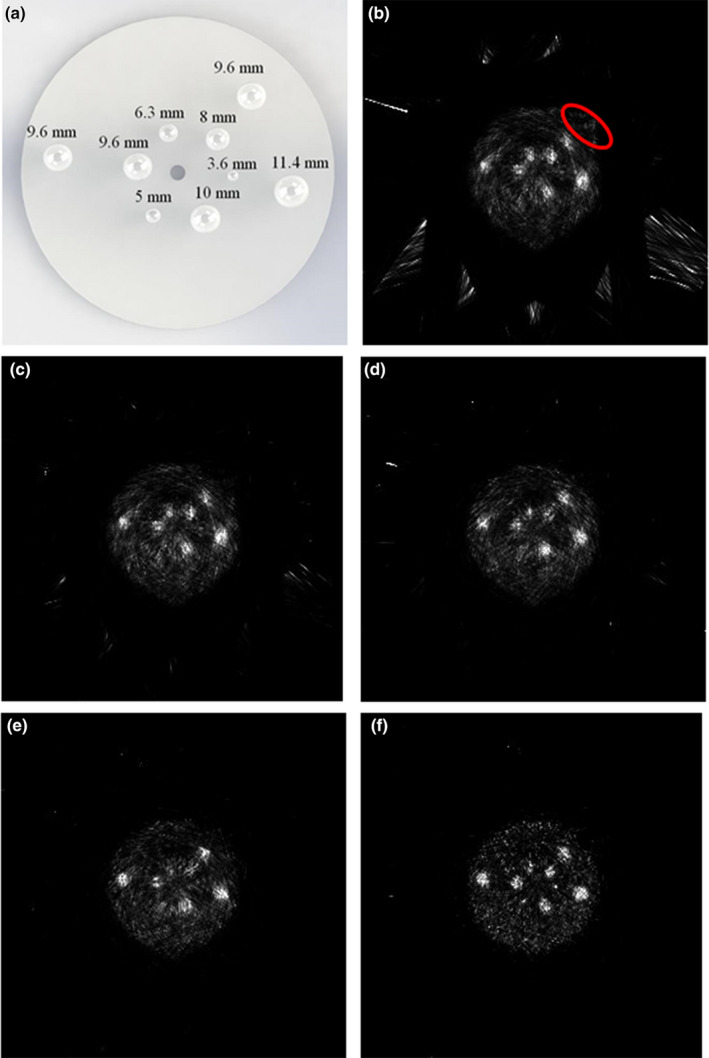
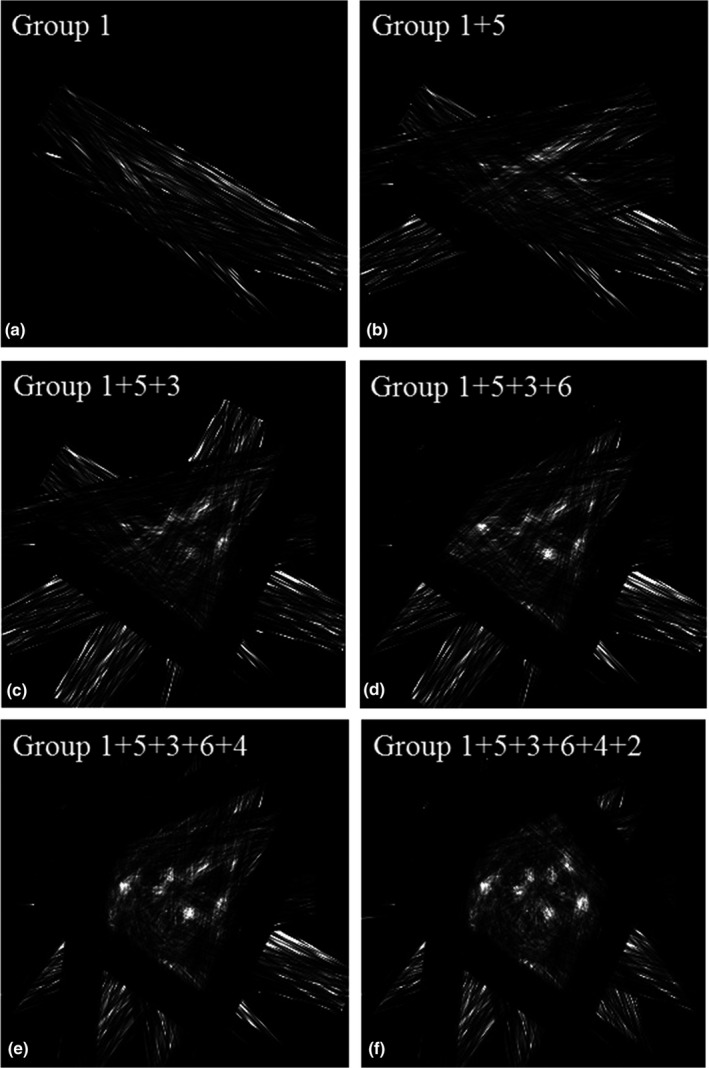
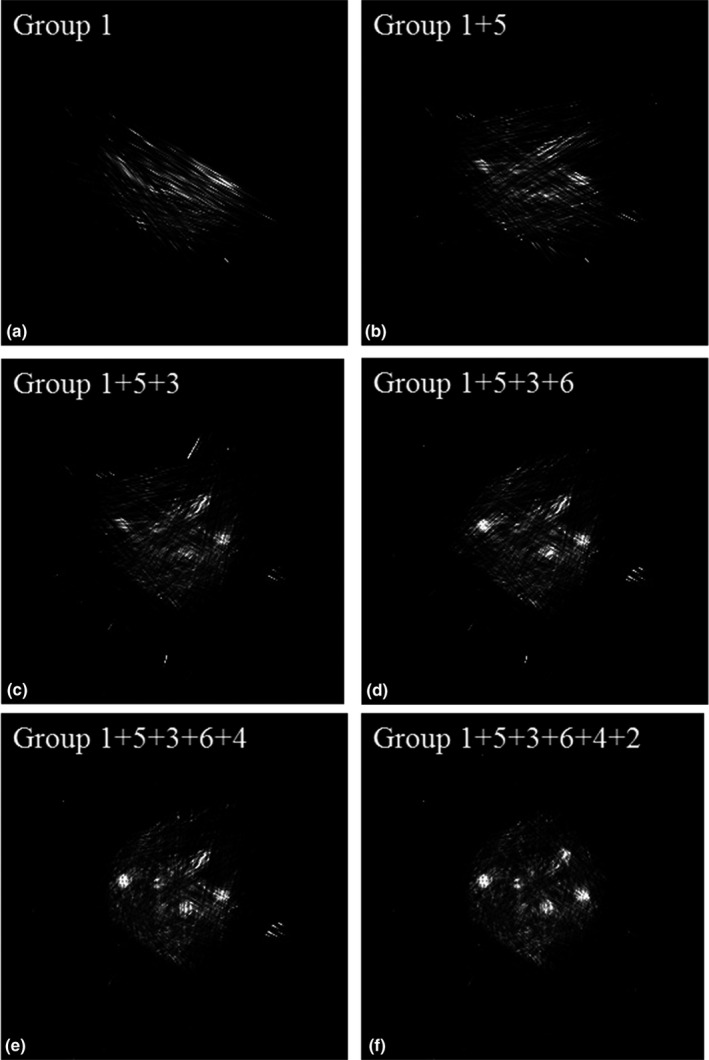
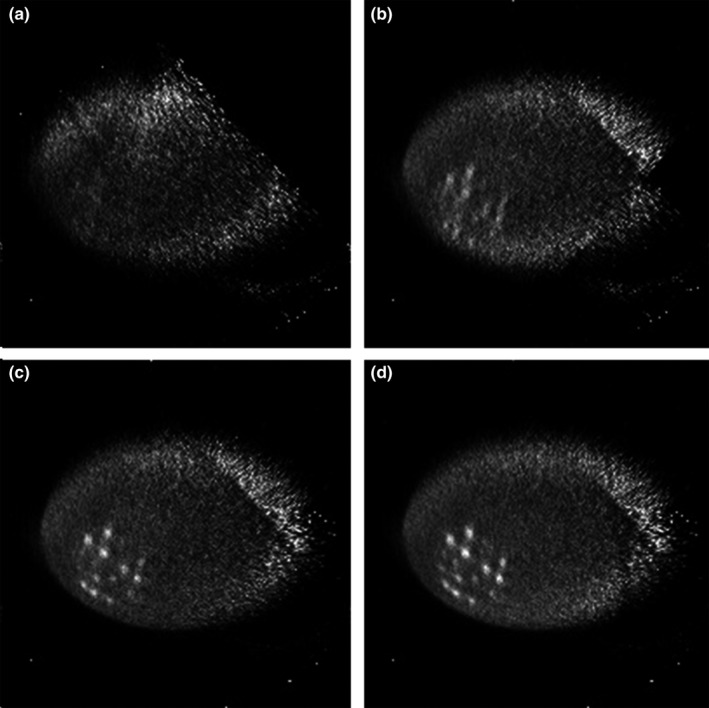
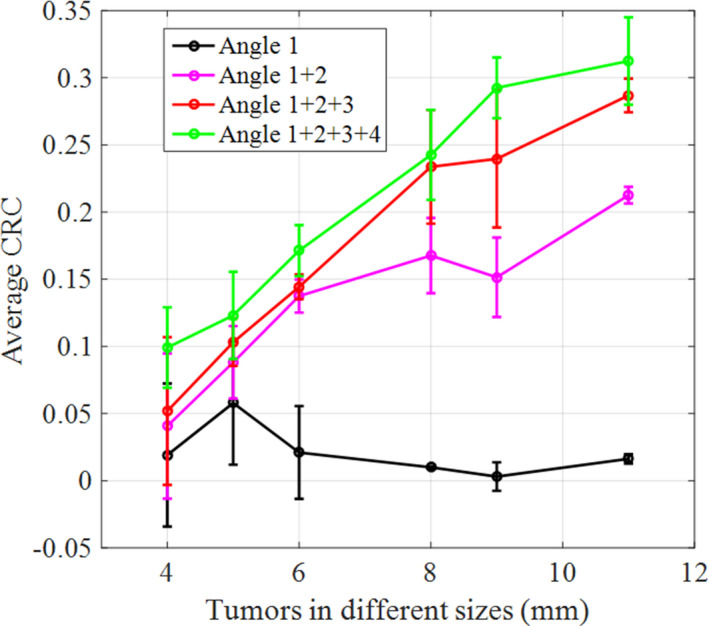
Methods: The core of this novel PET technology includes trackable PET detectors and a fully three-dimensional, fast image reconstruction engine implemented on multiple graphics processing units (GPUs) to support dynamically changing geometry by calculating the system matrix on-the-fly using a tube-of-response approach. With near real-time image reconstruction capability, a POC-PET system may comprise a maneuverable front PET detector and a second detector panel which can be stationary or moved synchronously with the front detector such that both panels face the region-of-interest (ROI) with the detector trajectory contoured around a patient's body. We built a proof-of-concept prototype using two planar detectors each consisting of a photomultiplier tube (PMT) optically coupled to an array of 48 × 48 lutetium-yttrium oxyorthosilicate (LYSO) crystals (1.0 × 1.0 × 10.0 mm3 each). Only 38 × 38 crystals in each arrays can be clearly re-solved and used for coincidence detection. One detector was mounted to a robotic arm which can position it at arbitrary locations, and the other detector was mounted on a rotational stage. A cylindrical phantom (102 mm in diameter, 150 mm long) with nine spherical lesions (8:1 tumor-to-background activity concentration ratio) was imaged from 27 sampling angles. List-mode events were reconstructed to form images without or with time-of-flight (TOF) information. We conducted two Monte Carlo simulations using two POC-PET systems. The first one uses the same phantom and detector setup as our experiment, with the detector coincidence re-solving time (CRT) ranging from 100 to 700 ps full-width-at-half-maximum (FWHM). The second study simulates a body-size phantom (316 × 228 × 160 mm3 ) imaged by a larger POC-PET system that has 4 × 6 modules (32 × 32 LYSO crystals/module, four in axial and six in transaxial directions) in the front panel and 3 × 8 modules (16 × 16 LYSO crystals/module, three in axial and eight in transaxial directions) in the back panel. We also evaluated an interactive scanning strategy by progressively increasing the number of data sets used for image reconstruction. The updated images were analyzed based on the number of data sets and the detector CRT.
Results: The proof-of-concept prototype re-solves most of the spherical lesions despite a limited number of coincidence events and incomplete sampling. TOF information reduces artifacts in the reconstructed images. Systems with better timing resolution exhibit improved image quality and reduced artifacts. We observed a reconstruction speed of 0.96 × 10⁶ events/s/iteration for 600 × 600 × 224 voxel rectilinear space using four GPUs. A POC-PET system with significantly higher sensitivity can interactively image a body-size object from four angles in less than 7 min.
Conclusions: We have developed GPU-based fast image reconstruction capability to support a PET system with arbitrary and dynamically changing geometry. Using TOF PET detectors, we demonstrated the feasibility of a PET system that can provide timely visual feedback to an operator who can scan a patient interactively to support POC imaging applications.
Keywords: GPU reconstruction; interactive PET Imaging; point-of- care application; time-of-flight PET.
© 2019 American Association of Physicists in Medicine.
Conflict of interest statement
The authors have no relevant conflicts of interest to disclose.
Figures
Similar articles
-
A second-generation virtual-pinhole PET device for enhancing contrast recovery and improving lesion detectability of a whole-body PET/CT scanner.Med Phys. 2019 Sep;46(9):4165-4176. doi: 10.1002/mp.13724. Epub 2019 Aug 7. Med Phys. 2019. PMID: 31315157 Free PMC article.
-
Effects of system geometry and other physical factors on photon sensitivity of high-resolution positron emission tomography.Phys Med Biol. 2007 Jul 7;52(13):3753-72. doi: 10.1088/0031-9155/52/13/007. Epub 2007 May 29. Phys Med Biol. 2007. PMID: 17664575 Free PMC article.
-
Performance evaluation of a high-resolution brain PET scanner using four-layer MPPC DOI detectors.Phys Med Biol. 2017 Aug 18;62(17):7148-7166. doi: 10.1088/1361-6560/aa82e8. Phys Med Biol. 2017. PMID: 28753133
-
State of the art in total body PET.EJNMMI Phys. 2020 May 25;7(1):35. doi: 10.1186/s40658-020-00290-2. EJNMMI Phys. 2020. PMID: 32451783 Free PMC article. Review.
-
Physics and technology of time-of-flight PET detectors.Phys Med Biol. 2021 Apr 21;66(9). doi: 10.1088/1361-6560/abee56. Phys Med Biol. 2021. PMID: 33711831 Review.
Cited by
-
High-resolution Imaging Using Virtual-Pinhole PET Concept.PET Clin. 2024 Jan;19(1):69-82. doi: 10.1016/j.cpet.2023.08.002. Epub 2023 Sep 27. PET Clin. 2024. PMID: 37775372 Free PMC article. Review.
-
Augmented Whole-Body Scanning via Magnifying PET.IEEE Trans Med Imaging. 2020 Nov;39(11):3268-3277. doi: 10.1109/TMI.2019.2962623. Epub 2020 Oct 28. IEEE Trans Med Imaging. 2020. PMID: 31899415 Free PMC article.
-
A second-generation virtual-pinhole PET device for enhancing contrast recovery and improving lesion detectability of a whole-body PET/CT scanner.Med Phys. 2019 Sep;46(9):4165-4176. doi: 10.1002/mp.13724. Epub 2019 Aug 7. Med Phys. 2019. PMID: 31315157 Free PMC article.
-
2D feasibility study of joint reconstruction of attenuation and activity in limited angle TOF-PET.IEEE Trans Radiat Plasma Med Sci. 2021 Sep;5(5):712-722. doi: 10.1109/trpms.2021.3079462. Epub 2021 May 12. IEEE Trans Radiat Plasma Med Sci. 2021. PMID: 34541435 Free PMC article.
-
Multimodal laparoscopic coincidence gamma imaging system for near-infrared fluorescence guided surgery: a preclinical study.J Med Imaging (Bellingham). 2023 May;10(3):033505. doi: 10.1117/1.JMI.10.3.033505. Epub 2023 Jun 21. J Med Imaging (Bellingham). 2023. PMID: 37351312 Free PMC article.
References
MeSH terms
Grants and funding
LinkOut - more resources
Full Text Sources
Research Materials
