

Snow algae communities in Antarctica: metabolic and taxonomic composition
- PMID: 30667072
- PMCID: PMC6492300
- DOI: 10.1111/nph.15701
Snow algae communities in Antarctica: metabolic and taxonomic composition
Abstract
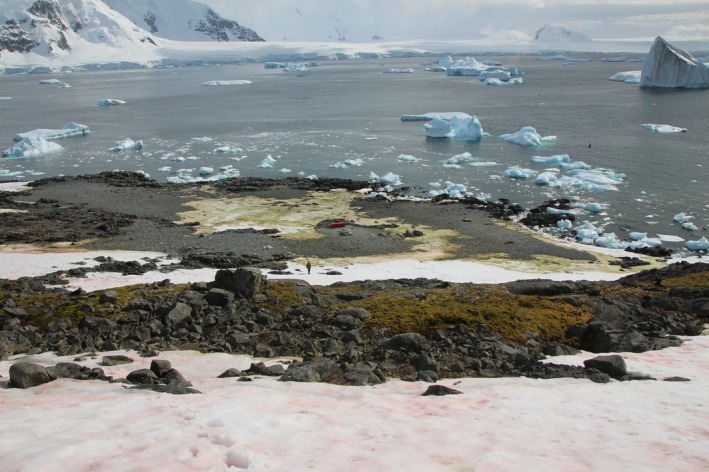
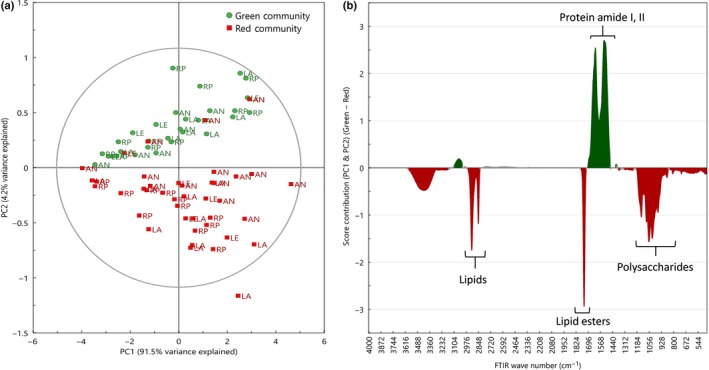
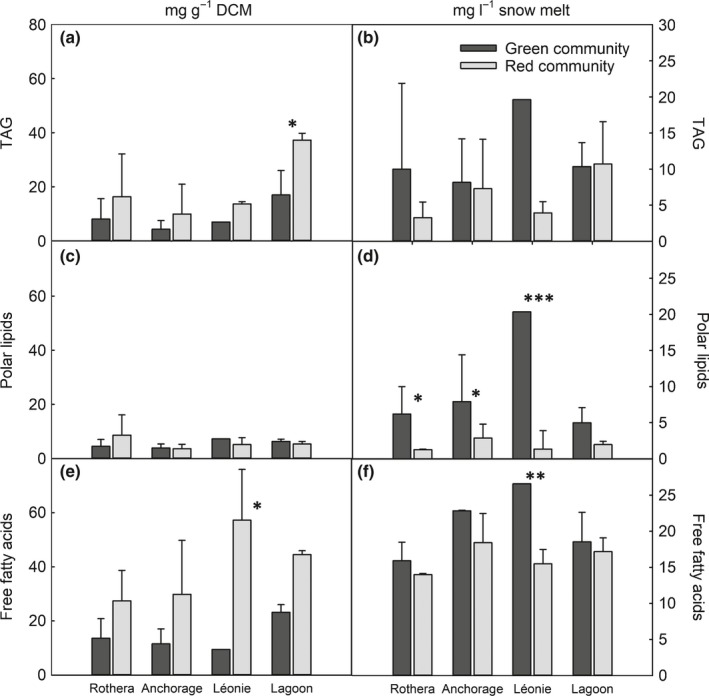
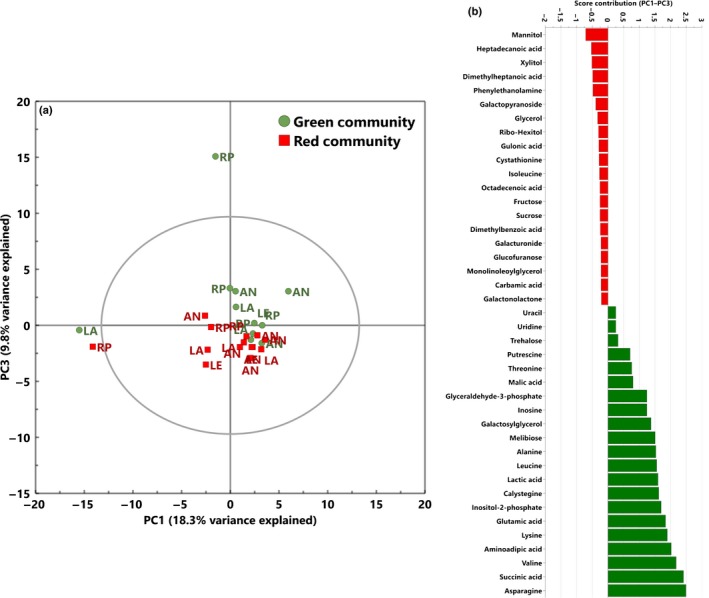
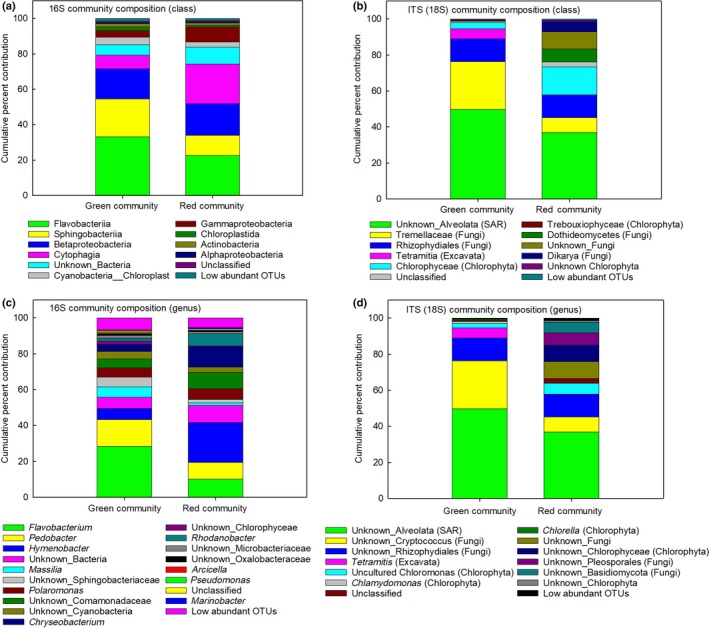
Snow algae are found in snowfields across cold regions of the planet, forming highly visible red and green patches below and on the snow surface. In Antarctica, they contribute significantly to terrestrial net primary productivity due to the paucity of land plants, but our knowledge of these communities is limited. Here we provide the first description of the metabolic and species diversity of green and red snow algae communities from four locations in Ryder Bay (Adelaide Island, 68°S), Antarctic Peninsula. During the 2015 austral summer season, we collected samples to measure the metabolic composition of snow algae communities and determined the species composition of these communities using metabarcoding. Green communities were protein-rich, had a high chlorophyll content and contained many metabolites associated with nitrogen and amino acid metabolism. Red communities had a higher carotenoid content and contained more metabolites associated with carbohydrate and fatty acid metabolism. Chloromonas, Chlamydomonas and Chlorella were found in green blooms but only Chloromonas was detected in red blooms. Both communities also contained bacteria, protists and fungi. These data show the complexity and variation within snow algae communities in Antarctica and provide initial insights into the contribution they make to ecosystem functioning.
Keywords: Antarctica; bacteria; community composition; cryophilic; fungi; metabarcoding; metabolomics; snow algae.
© 2019 The Authors. New Phytologist © 2019 New Phytologist Trust.
Figures
Similar articles
-
Functional filtering and random processes affect the assembly of microbial communities of snow algae blooms at Maritime Antarctic.Sci Total Environ. 2022 Jan 20;805:150305. doi: 10.1016/j.scitotenv.2021.150305. Epub 2021 Sep 11. Sci Total Environ. 2022. PMID: 34818790
-
Remote Sensing Phenology of Antarctic Green and Red Snow Algae Using WorldView Satellites.Front Plant Sci. 2021 Jun 16;12:671981. doi: 10.3389/fpls.2021.671981. eCollection 2021. Front Plant Sci. 2021. PMID: 34226827 Free PMC article.
-
Antarctic snow algae: unraveling the processes underlying microbial community assembly during blooms formation.Microbiome. 2023 Sep 5;11(1):200. doi: 10.1186/s40168-023-01643-6. Microbiome. 2023. PMID: 37667346 Free PMC article.
-
Snow and Glacial Algae: A Review1.J Phycol. 2020 Apr;56(2):264-282. doi: 10.1111/jpy.12952. Epub 2020 Feb 29. J Phycol. 2020. PMID: 31825096 Free PMC article. Review.
-
Effects of solar UV-B radiation on aquatic ecosystems.Adv Space Res. 2000;26(12):2029-40. doi: 10.1016/s0273-1177(00)00170-8. Adv Space Res. 2000. PMID: 12038489 Review.
Cited by
-
The molecular phylogeny of Chionaster nivalis reveals a novel order of psychrophilic and globally distributed Tremellomycetes (Fungi, Basidiomycota).PLoS One. 2021 Mar 24;16(3):e0247594. doi: 10.1371/journal.pone.0247594. eCollection 2021. PLoS One. 2021. PMID: 33760841 Free PMC article.
-
Isolation and characterization of fast-growing green snow bacteria from coastal East Antarctica.Microbiologyopen. 2021 Jan;10(1):e1152. doi: 10.1002/mbo3.1152. Epub 2020 Dec 29. Microbiologyopen. 2021. PMID: 33377317 Free PMC article.
-
Seasonal cycles of snow algal blooms intensify surface melting on Antarctic ice shelves.Sci Rep. 2025 Jul 2;15(1):23139. doi: 10.1038/s41598-025-05129-3. Sci Rep. 2025. PMID: 40603364 Free PMC article.
-
The snow alga Chloromonas kaweckae sp. nov. (Volvocales, Chlorophyta) causes green surface blooms in the high tatras (Slovakia) and tolerates high irradiance.J Phycol. 2023 Feb;59(1):236-248. doi: 10.1111/jpy.13307. Epub 2023 Jan 13. J Phycol. 2023. PMID: 36461636 Free PMC article.
-
Metabolic Niches and Plasticity of Sand-Dune Plant Communities Along a Trans-European Gradient.Metabolites. 2025 Mar 24;15(4):217. doi: 10.3390/metabo15040217. Metabolites. 2025. PMID: 40278346 Free PMC article.
References
-
- Altschul SF, Gish W, Miller W, Myers EW, Lipman DJ. 1990. Basic local alignment search tool. Journal of Molecular Biology 215: 403–410. - PubMed
-
- Anderson MJ. 2001. A new method for non‐parametric multivariate analysis of variance. Austral Ecology 26: 32–46.
-
- Bidigare RR, Ondrusek ME. 1993. Evidence for a photoprotective function for secondary carotenoids of snow algae. Journal of Phycology 29: 427–434.
-
- Boetius A, Anesio AM, Deming JW, Mikucki JA, Rapp JZ. 2015. Microbial ecology of the cryosphere: sea ice and glacial habitats. Nature Reviews: Microbiology 13: 677–690. - PubMed
Publication types
MeSH terms
Substances
Grants and funding
LinkOut - more resources
Full Text Sources
