. 2019 May;67(5):896-914.
doi: 10.1002/glia.23579. Epub 2019 Jan 22.

Blockade of microglial adenosine A2A receptor suppresses elevated pressure-induced inflammation, oxidative stress, and cell death in retinal cells

Affiliations

Blockade of microglial adenosine A2A receptor suppresses elevated pressure-induced inflammation, oxidative stress, and cell death in retinal cells

Inês Dinis Aires et al. Glia. 2019 May.

Abstract

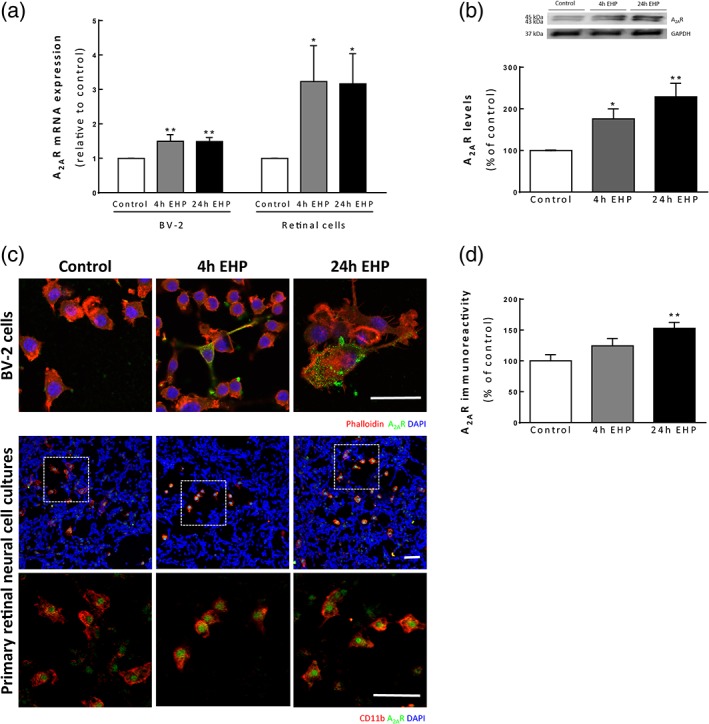
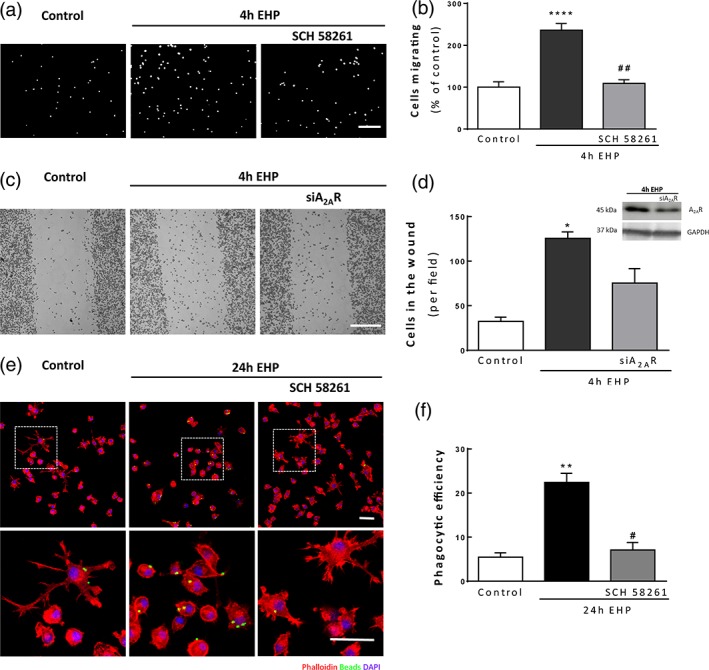
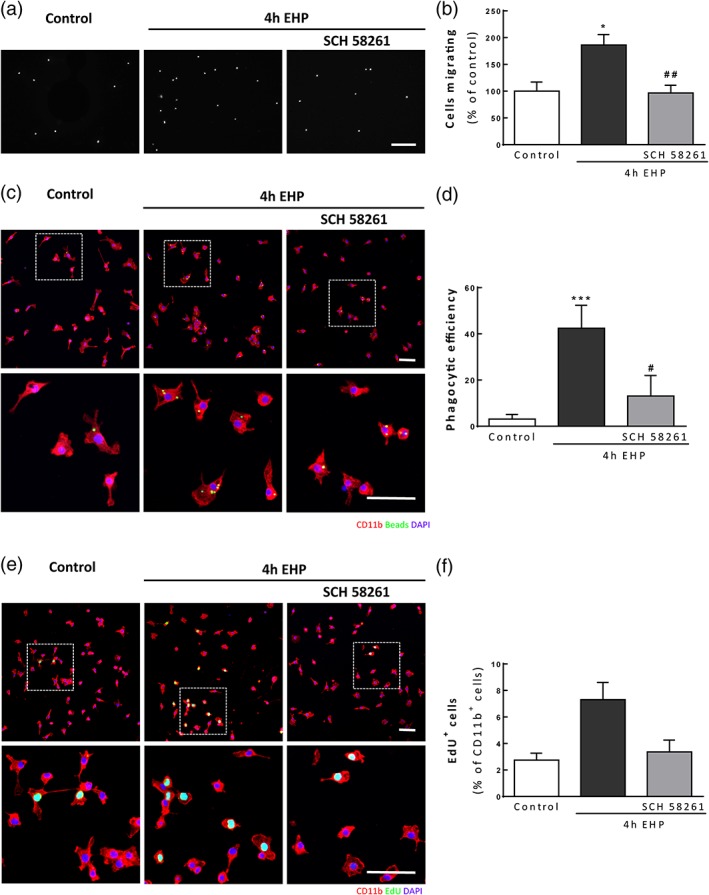
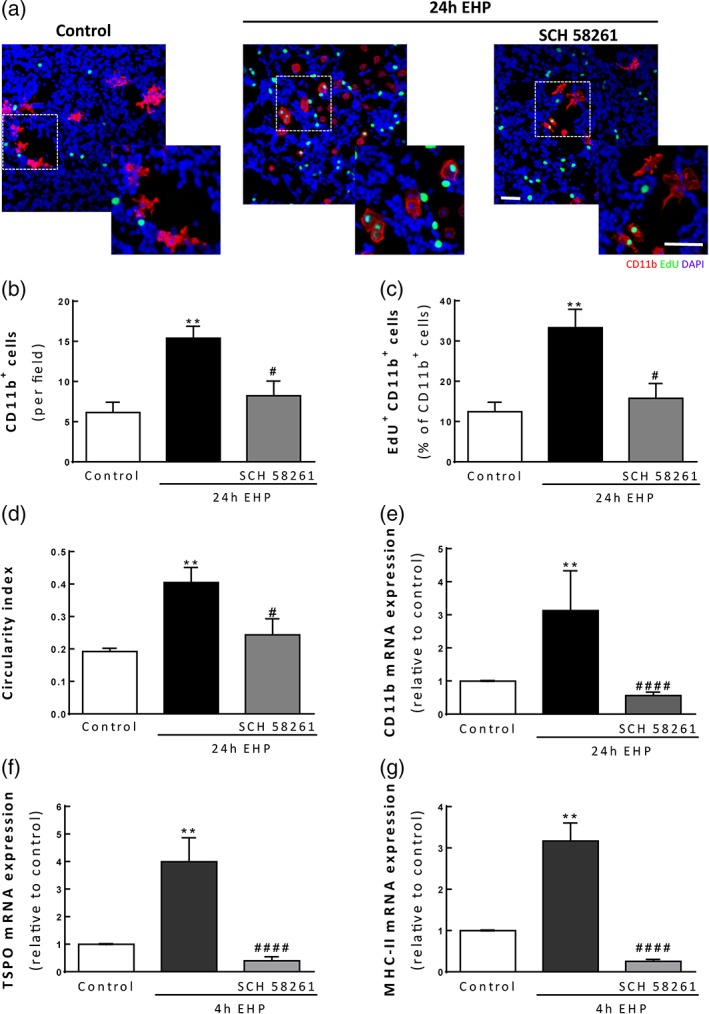
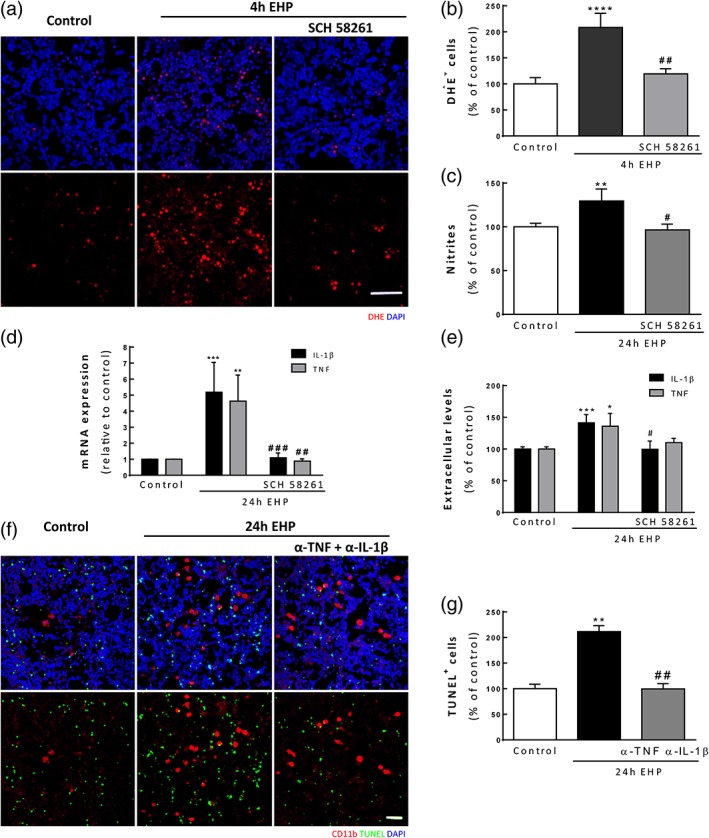
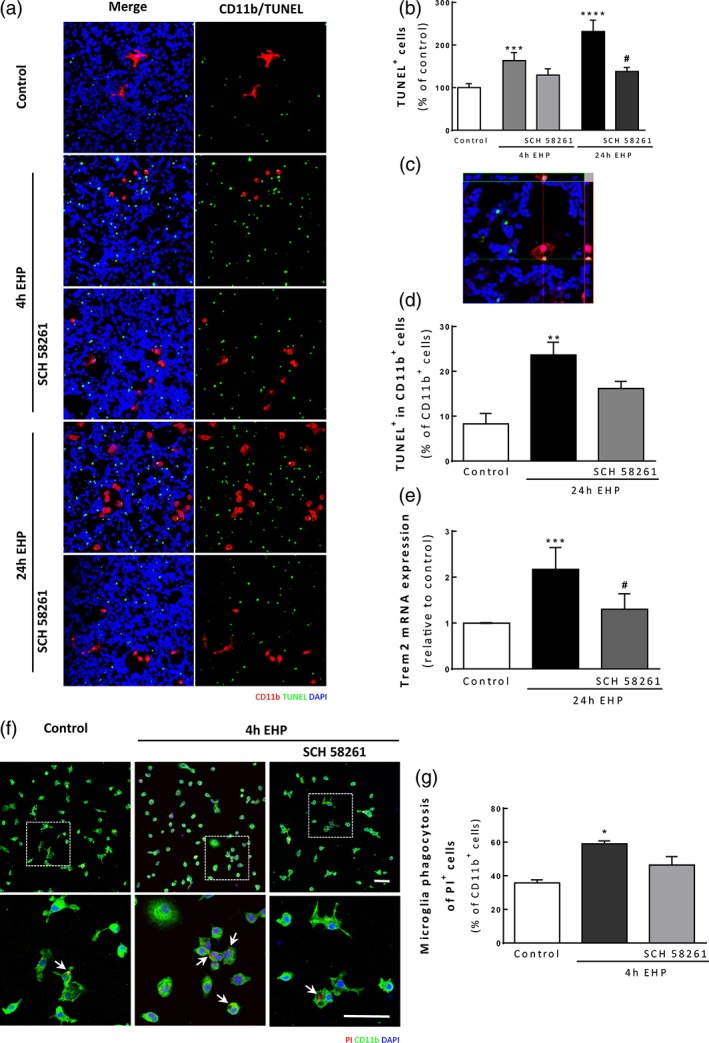
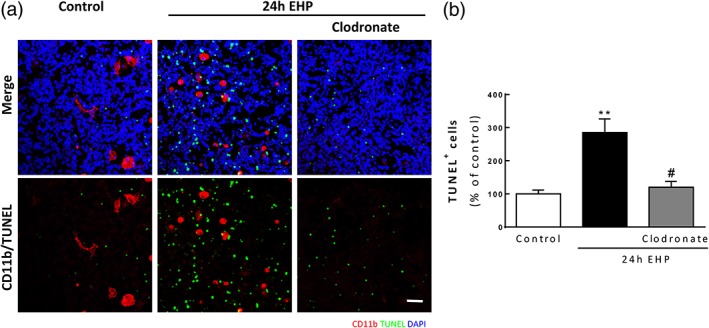
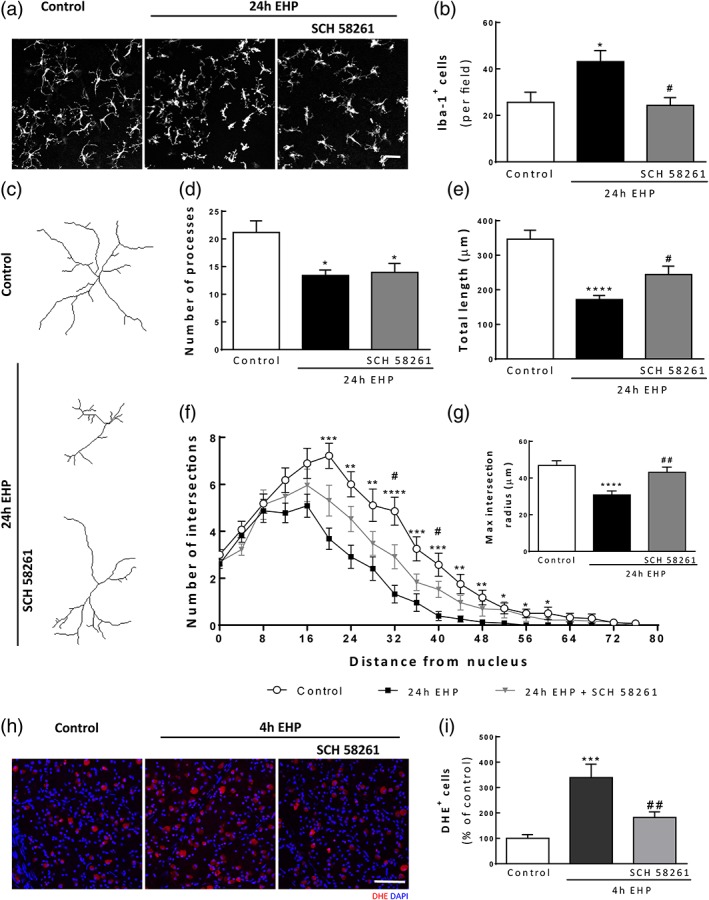
Glaucoma is a retinal degenerative disease characterized by the loss of retinal ganglion cells and damage of the optic nerve. Recently, we demonstrated that antagonists of adenosine A2A receptor (A2A R) control retinal inflammation and afford protection to rat retinal cells in glaucoma models. However, the precise contribution of microglia to retinal injury was not addressed, as well as the effect of A2A R blockade directly in microglia. Here we show that blocking microglial A2A R prevents microglial cell response to elevated pressure and it is sufficient to protect retinal cells from elevated pressure-induced death. The A2A R antagonist SCH 58261 or the knockdown of A2A R expression with siRNA in microglial cells prevented the increase in microglia response to elevated hydrostatic pressure. Furthermore, in retinal neural cell cultures, the A2A R antagonist decreased microglia proliferation, as well as the expression and release of pro-inflammatory mediators. Microglia ablation prevented neural cell death triggered by elevated pressure. The A2A R blockade recapitulated the effects of microglia depletion, suggesting that blocking A2A R in microglia is able to control neurodegeneration in glaucoma-like conditions. Importantly, in human organotypic retinal cultures, A2A R blockade prevented the increase in reactive oxygen species and the morphological alterations in microglia triggered by elevated pressure. These findings place microglia as the main contributors for retinal cell death during elevated pressure and identify microglial A2A R as a therapeutic target to control retinal neuroinflammation and prevent neural apoptosis elicited by elevated pressure.

Keywords: adenosine A2A receptors; glaucoma; microglia; neurodegeneration; neuroinflammation.


Conflict of interest statement

The authors declare no conflict of interest.

Figures

Figure 1
Figure 1
A2AR expression increases upon exposure to EHP in BV‐2 microglia and primary retinal neural cell cultures. (a) The A2AR mRNA expression was assessed in BV‐2 microglial cells and primary retinal cell cultures by qPCR and is presented as fold change of the control n = 4–5 and n = 8–11, respectively. (b) A2AR protein levels were assessed by Western blot in BV‐2 extracts. The densitometry of each band for A2AR was normalized for GAPDH, and the results are expressed as percentage of the control, n = 5–6. (c) A2AR immunoreactivity was assessed in BV‐2 and retinal cultures by immunocytochemistry. Representative images of BV‐2 cells stained with phalloidin (red) and microglia labeled with anti‐CD11b (red) in primary retinal cultures and anti‐A2AR (green) (c). Nuclei were stained with DAPI (blue). (d) In primary retinal neural cell cultures, the immunoreactivity of A2AR in CD11b+ cells was quantified, and is presented as percentage of the control, n = 3–4. *p < 0.05, **p < 0.01, compared with the control; Kruskal–Wallis test, followed by Dunn's multiple comparison test. Scale bar: 50 μm [Color figure can be viewed at wileyonlinelibrary.com]
Figure 2
Figure 2
Gene silencing or pharmacologic blockade of A2AR inhibits the EHP‐induced increase in microglia motility and phagocytosis. Microglial cells were pretreated with 50 nM SCH 58261 or A2AR siRNA followed by exposure to EHP for 4 hr. BV‐2 microglial cell motility was assessed by the Boyden chamber migration (a and b) and scratch wound (c and d) assays. (b) The results are expressed as percentage of the control, n = 4–5. (d) The number of cells in the wound per field was counted, n = 3. In every experiment with siRNA A2AR, the decrease in the protein levels was confirmed by Western blot. (e) Phagocytosis was assessed in BV‐2 cells exposed to EHP for 24 hr using fluorescent beads. Representative images of BV‐2 cells stained with phalloidin (red) with incorporated beads (green). Nuclei were counterstained with DAPI (blue). (f) The phagocytic efficiency was calculated, n = 4–6. *p < 0.05, **p < 0.01, ****p < 0.0001, compared with control; #p < 0.05, ##p < 0.01, compared with EHP; Kruskal–Wallis test, followed by Dunn's multiple comparison test. Scale bar: 50 μm [Color figure can be viewed at wileyonlinelibrary.com]
Figure 3
Figure 3
Blockade of A2AR in primary retinal microglia controls cell response to EHP. Primary retinal microglial cells were pretreated with 50 nM SCH 58261 and then exposed to EHP for 4 hr. Cell motility was assessed by the Boyden chamber assay (a and b). The results are presented as percentage of control (b), n = 6. (c and d) Phagocytosis was assessed in primary retinal microglial cells exposed to EHP for 4 hr using fluorescent beads. (c) Representative images of CD11b+ cells (red) with incorporated beads (green). Nuclei were counterstained with DAPI (blue). (d) The phagocytic efficiency was calculated, n = 6. (e) Representative images of microglia labeled with anti‐CD11b (red) and stained with EdU (green). Nuclei were stained with DAPI (blue). (f) The number of proliferating microglia (EdU+ CD11b+ cells) was counted and expressed as percentage of total microglia. *p < 0.05, ***p < 0.001, compared with control; #p < 0.05, ##p < 0.01, compared with EHP; Kruskal–Wallis test, followed by Dunn's multiple comparison test. Scale bar: 50 μm [Color figure can be viewed at wileyonlinelibrary.com]
Figure 4
Figure 4
The antagonist of A2AR prevents EHP‐induced changes in microglia morphology and cell response. Primary retinal neural cell cultures were pretreated with 50 nM SCH 58261 following exposure to EHP for 24 hr. (a) Microglial cells were labeled using anti‐CD11b (red) and cell proliferation was measured by counting the number of EdU+ cells (green). Nuclei were counterstained with DAPI (blue). (b) The number of CD11b+ cells per field was counted, n = 6–7. (c) The number of microglial cells proliferating (EdU+CD11b+ cells) was counted and the results are expressed as the ratio EdU+CD11b+/CD11b+, n = 6–8. (d) The circularity index was determined using ImageJ, n = 6–8. The mRNA expression levels of CD11b (e), TSPO (f) and MHC II (g) were assessed by qPCR and the results are presented as fold change of the control, n = 4–6. **p < 0.01, compared with control; #p < 0.05, ####p < 0.001, compared with EHP; Kruskal–Wallis test, followed by Dunn's multiple comparison test. Scale bar: 50 μm [Color figure can be viewed at wileyonlinelibrary.com]
Figure 5
Figure 5
The blockade of A2AR prevents oxidative/nitrosative stress and the release of pro‐inflammatory mediators triggered by EHP in primary retinal neural cell cultures. (a) The production of ROS was assessed by DHE staining (red). Nuclei were stained with DAPI (blue). (b) The number of DHE+ was counted, and the results are expressed as percentage of the control, n = 5–9. (c) Extracellular nitrites concentration was quantified in supernatants from primary retinal neural cell cultures by the Griess reaction method, n = 6. (d) The mRNA expression levels of TNF and IL‐1β were assessed by qPCR, n = 7–10. (e) The protein levels of TNF and IL‐1β in culture supernatants of primary retinal neural cell cultures were determined by ELISA, n = 7–11. (f) Primary retinal neural cell cultures were pretreated with antibodies to neutralize the actions of TNF and IL‐1β and exposed to EHP for 24 hr. Cell death was assessed with TUNEL assay. The number of TUNEL+ cells (green) was counted (g). Nuclei were stained with DAPI (blue). *p < 0.05, **p < 0.01, ***p < 0.001, ****p < 0.0001, compared with control; #p < 0.05, ##p < 0.01, ###p < 0.001; compared with EHP, Kruskal–Wallis test, followed by Dunn's multiple comparison test (b, c, e, g) or one‐way anova followed by Sidak's multiple comparisons test (d). Scale bar: 50 μm [Color figure can be viewed at wileyonlinelibrary.com]
Figure 6
Figure 6
A2AR blockade prevents EHP‐induced cell death in primary retinal neural cell cultures and decreases dead/dying cell engulfment by primary microglia. (a) Cell death was assessed by TUNEL assay. Microglial cells were identified by immunocytochemistry with anti‐CD11b (red) and nuclei were counterstained with DAPI (blue). (b) The number of TUNEL+ cells (green) was counted and the results are expressed as percentage of the control n = 6–10. (c) Orthogonal confocal image representing microglial engulfment of a TUNEL+ cell. (d) The number of microglial cells with engulfed TUNEL+ cells (TUNEL+ in CD11b+ cells) was counted, and the results are expressed as the percentage of total microglial cells per field, n = 5–6. (e) The mRNA expression levels of Trem2 were assessed by qPCR, n = 5–6. (f) Phagocytosis of PI‐labeled retinal cells (red) by primary retinal microglia labeled with anti‐CD11b, green). Nuclei were counterstained with DAPI (blue). Arrows indicate some engulfed PI+ cells. (g) The number of microglia with engulfed PI+ cells was counted and presented as a percentage of total microglia, n = 4. *p < 0.05, **p < 0.01, ***p < 0.001, ****p < 0.0001, compared with control; #p < 0.05, compared with EHP; Kruskal–Wallis test, followed by Dunn's multiple comparison test. Scale bar: 50 μm [Color figure can be viewed at wileyonlinelibrary.com]
Figure 7
Figure 7
Microglia depletion prevents EHP‐induced cell death in primary retinal neural cell cultures. Microglial cells were depleted from primary retinal neural cell cultures using clodronate liposomes and then were exposed to EHP for 24 hr (a). Cell death was assessed by TUNEL assay (a and b). Microglial cells were identified by immunocytochemistry with anti‐CD11b (red) (a). Nuclei were counterstained with DAPI (blue). (b) The number of TUNEL+ cells (green) was counted, n = 4–8. **p < 0.01, compared with control; #p < 0.05, compared with EHP; Kruskal–Wallis, followed by Dunn's multiple comparison test. Scale bar: 50 μm [Color figure can be viewed at wileyonlinelibrary.com]
Figure 8
Figure 8
The blockade of A2AR inhibits microglial cell response in human organotypic retinal cultures. Human retinal explants were pretreated with 50 nM SCH 58261 followed by exposure to EHP for 4 hr or 24 hr. (a) Microglial cells were labeled by immunocytochemistry with an antibody anti‐Iba‐1 (white). (b) The number of Iba‐1+ cells per field was counted, n = 5. Microglia morphologic features were assessed from 3D reconstructed images (c). The total number of processes (d), total length (e), Sholl analysis (f), and last intersection radius (g) were analyzed from four independent donors in a total of 21–28 cells analyzed per condition. Results represent the average morphologic features from the total number of cells analyzed. ROS production was assessed by DHE staining (h). Nuclei were stained with DAPI (blue). (i) The number of DHE+ cells (red) was counted n = 6–7. *p < 0.05, ***p < 0.001, ****p < 0.0001, compared with control; #p < 0.05, ##p < 0.01, compared with EHP; Kruskal–Wallis, followed by Dunn's multiple comparison test (b, d, and f) or one‐way anova followed by Sidak's multiple comparisons test (e, g, and i). Scale bar: 50 μm [Color figure can be viewed at wileyonlinelibrary.com]

Similar articles

Cited by

References

    1. Agar, A. , Li, S. , Agarwal, N. , Coroneo, M. T. , & Hill, M. A. (2006). Retinal ganglion cell line apoptosis induced by hydrostatic pressure. Brain Research, 1086(1), 191–200. 10.1016/j.brainres.2006.02.061 - DOI - PubMed
    1. Agar, A. , Yip, S. S. , Hill, M. A. , & Coroneo, M. T. (2000). Pressure related apoptosis in neuronal cell lines. Journal of Neuroscience Research, 60(4), 495–503. 10.1002/(SICI)1097-4547(20000515)60:4<495::AID-JNR8>3.0.CO;2-S - DOI - PubMed
    1. Aires, I. D. , Ambrósio, A. F. , & Santiago, A. R. (2016). Modeling human glaucoma: Lessons from the in vitro models. Ophthalmic Research, 57, 77–86. 10.1159/000448480 - DOI - PubMed
    1. Almasieh, M. , Wilson, A. M. , Morquette, B. , Cueva Vargas, J. L. , & Di Polo, A. (2012). The molecular basis of retinal ganglion cell death in glaucoma. Progress in Retinal and Eye Research, 31(2), 152–181. 10.1016/j.preteyeres.2011.11.002 - DOI - PubMed
    1. Alvaro, A. R. , Martins, J. , Araujo, I. M. , Rosmaninho‐Salgado, J. , Ambrósio, A. F. , & Cavadas, C. (2008). Neuropeptide Y stimulates retinal neural cell proliferation—Involvement of nitric oxide. Journal of Neurochemistry, 105(6), 2501–2510. 10.1111/j.1471-4159.2008.05334.x - DOI - PubMed

Publication types

MeSH terms

Substances