. 2019 Mar;290(3):709-719.
doi: 10.1148/radiol.2018181278. Epub 2019 Jan 22.

A Grading System for the Assessment of Risk of Extraprostatic Extension of Prostate Cancer at Multiparametric MRI

Affiliations

A Grading System for the Assessment of Risk of Extraprostatic Extension of Prostate Cancer at Multiparametric MRI

Sherif Mehralivand et al. Radiology. 2019 Mar.

Abstract

Purpose To evaluate MRI features associated with pathologically defined extraprostatic extension (EPE) of prostate cancer and to propose an MRI grading system for pathologic EPE. Materials and Methods In this prospective study, consecutive male study participants underwent preoperative 3.0-T MRI from June 2007 to March 2017 followed by robotic-assisted laparoscopic radical prostatectomy. An MRI-based EPE grading system was defined as follows: curvilinear contact length of 1.5 cm or capsular bulge and irregularity were grade 1, both features were grade 2, and frank capsular breach were grade 3. Multivariable logistic regression and decision curve analyses were performed to compare the MRI grade model and clinical parameters (prostate-specific antigen, Gleason score) for pathologic EPE prediction by using the area under the receiver operating characteristic curve (AUC) value. Results Among 553 study participants, the mean age was 60 years ± 8 (standard deviation); the median prostate-specific antigen value was 6.3 ng/mL. A total of 125 of 553 (22%) participants had pathologic EPE at radical prostatectomy. Detection of pathologic EPE, defined as number of pathologic EPEs divided by number of participants with individual MRI features, was as follows: curvilinear contact length, 88 of 208 (42%); capsular bulge and irregularity, 78 of 175 (45%); and EPE visible at MRI, 37 of 56 (66%). For MRI, grades 1, 2, and 3 for detection of pathologic EPE were 18 of 74 (24%), 39 of 102 (38%), and 37 of 56 (66%), respectively. Clinical features plus the MRI-based EPE grading system (prostate-specific antigen, International Society of Urological Pathology stage, MRI grade) predicted pathologic EPE better than did MRI grade alone (AUC, 0.81 vs 0.77, respectively; P < .001). Conclusion Higher MRI-based extraprostatic extension (EPE) grading categories were associated with a greater risk of pathologic EPE. Clinical features plus MRI grading had the highest diagnostic performance for prediction of pathologic EPE. © RSNA, 2019 Online supplemental material is available for this article. See also the editorial by Eberhardt in this issue.


Figures
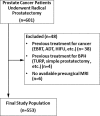
Figure 1:
Figure 1:
Flowchart shows determination of final study population. ADT = androgen deprivation therapy, BPH = benign prostatic hyperplasia, EBRT = external beam radiation therapy, HIFU = high-intensity focused ultrasound, TURP = transurethral resection of prostate.
Figure 2a:
Figure 2a:
Images show indirect (a) curvilinear contact length associated with left midperipheral zone lesion (arrows), (b) capsular bulge or irregularity associated with left apical-midperipheral zone lesion (arrows), (c) obliteration of rectoprostatic angle associated with left apical-midperipheral zone lesion (arrows) compared with normal right side, (d) asymmetry of neurovascular bundles associated with left apical peripheral zone lesion [arrows]) and direct (e) frank breach of prostate capsule associated with right midperipheral zone lesion (arrows) MRI features at axial T2-weighted MRI and (f) seminal vesicle invasion (arrows) at sagittal T2-weighted MRI associated with pathologic extraprostatic extension.
Figure 2b:
Figure 2b:
Images show indirect (a) curvilinear contact length associated with left midperipheral zone lesion (arrows), (b) capsular bulge or irregularity associated with left apical-midperipheral zone lesion (arrows), (c) obliteration of rectoprostatic angle associated with left apical-midperipheral zone lesion (arrows) compared with normal right side, (d) asymmetry of neurovascular bundles associated with left apical peripheral zone lesion [arrows]) and direct (e) frank breach of prostate capsule associated with right midperipheral zone lesion (arrows) MRI features at axial T2-weighted MRI and (f) seminal vesicle invasion (arrows) at sagittal T2-weighted MRI associated with pathologic extraprostatic extension.
Figure 2c:
Figure 2c:
Images show indirect (a) curvilinear contact length associated with left midperipheral zone lesion (arrows), (b) capsular bulge or irregularity associated with left apical-midperipheral zone lesion (arrows), (c) obliteration of rectoprostatic angle associated with left apical-midperipheral zone lesion (arrows) compared with normal right side, (d) asymmetry of neurovascular bundles associated with left apical peripheral zone lesion [arrows]) and direct (e) frank breach of prostate capsule associated with right midperipheral zone lesion (arrows) MRI features at axial T2-weighted MRI and (f) seminal vesicle invasion (arrows) at sagittal T2-weighted MRI associated with pathologic extraprostatic extension.
Figure 2d:
Figure 2d:
Images show indirect (a) curvilinear contact length associated with left midperipheral zone lesion (arrows), (b) capsular bulge or irregularity associated with left apical-midperipheral zone lesion (arrows), (c) obliteration of rectoprostatic angle associated with left apical-midperipheral zone lesion (arrows) compared with normal right side, (d) asymmetry of neurovascular bundles associated with left apical peripheral zone lesion [arrows]) and direct (e) frank breach of prostate capsule associated with right midperipheral zone lesion (arrows) MRI features at axial T2-weighted MRI and (f) seminal vesicle invasion (arrows) at sagittal T2-weighted MRI associated with pathologic extraprostatic extension.
Figure 2e:
Figure 2e:
Images show indirect (a) curvilinear contact length associated with left midperipheral zone lesion (arrows), (b) capsular bulge or irregularity associated with left apical-midperipheral zone lesion (arrows), (c) obliteration of rectoprostatic angle associated with left apical-midperipheral zone lesion (arrows) compared with normal right side, (d) asymmetry of neurovascular bundles associated with left apical peripheral zone lesion [arrows]) and direct (e) frank breach of prostate capsule associated with right midperipheral zone lesion (arrows) MRI features at axial T2-weighted MRI and (f) seminal vesicle invasion (arrows) at sagittal T2-weighted MRI associated with pathologic extraprostatic extension.
Figure 2f:
Figure 2f:
Images show indirect (a) curvilinear contact length associated with left midperipheral zone lesion (arrows), (b) capsular bulge or irregularity associated with left apical-midperipheral zone lesion (arrows), (c) obliteration of rectoprostatic angle associated with left apical-midperipheral zone lesion (arrows) compared with normal right side, (d) asymmetry of neurovascular bundles associated with left apical peripheral zone lesion [arrows]) and direct (e) frank breach of prostate capsule associated with right midperipheral zone lesion (arrows) MRI features at axial T2-weighted MRI and (f) seminal vesicle invasion (arrows) at sagittal T2-weighted MRI associated with pathologic extraprostatic extension.
Figure 3:
Figure 3:
Axial T2-weighted MR images show proposed MRI-derived extraprostatic extension (EPE) grading system for prediction of pathologic EPE (pEPE). MRI features included curvilinear contact length, defined as present when distance exceeded 1.5 cm (arrows); capsular bulge, defined as smooth convex extension of margin of prostate into extraprostatic space, in continuity with intraprostatic tumor (arrows); and EPE visible at MRI, a well-defined breach of prostate capsule with tumor extension into periprostatic space or invasion of adjacent anatomic structures such as rectum, bladder, or pelvic wall (arrows).
Figure 4:
Figure 4:
Calibration plots show mean predicted risk of pathologic extraprostatic extension (EPE) and the 95% confidence interval versus observed proportion of pathologic EPE in each decile of pathologic EPE risk scores calculated from each multivariable logistic regression model. Clinical plus MRI-derived EPE grade model consists of clinical factors and MRI-derived EPE grade; clinical plus MRI features model consists of clinical factors and MRI features. Clinical model had poorer fit and worse ability in discriminating between EPE and non-EPE cases than did other three models, because it had more observed proportions of EPE lying outside 95% confidence intervals and less spread in predicted risks. Thus, including MRI-derived EPE grade or MRI features in risk prediction model improves predicted value for EPE.
Figure 5a:
Figure 5a:
Graphs show performance of four multivariable logistic regression models. Clinical plus MRI-derived extraprostatic extension (EPE) grade model consists of clinical factors and MRI-derived EPE grade; clinical plus MRI features model consists of clinical factors and MRI features. (a) Receiver operating characteristic curves are shown. Both clinical plus MRI-combined models had higher area under receiver operating characteristic curves (AUCs) than did MRI-derived EPE grade model and clinical model. (b) True-positive rate was plotted against risk threshold. Clinical model exhibited lower true-positive rate than did other three models except for risk threshold less than 15%. (c) False-positive rate was plotted against risk threshold. False-positive rates did not differ significantly among four models except for risk threshold less than 15%, whereas false-positive rate in clinical model was much higher. (d) Net benefits (proportion of true-positive results minus weighted proportion of false-positive results with weight equal to ratio of risk threshold to 1 minus risk threshold) of two clinical plus MRI-combined models were comparable and higher than were those of MRI-derived EPE grade or clinical model for risk threshold greater than 10%. Thus, MRI-derived EPE grade can simplify EPE reporting while maintaining same diagnostic performance as by using all MRI features.
Figure 5b:
Figure 5b:
Graphs show performance of four multivariable logistic regression models. Clinical plus MRI-derived extraprostatic extension (EPE) grade model consists of clinical factors and MRI-derived EPE grade; clinical plus MRI features model consists of clinical factors and MRI features. (a) Receiver operating characteristic curves are shown. Both clinical plus MRI-combined models had higher area under receiver operating characteristic curves (AUCs) than did MRI-derived EPE grade model and clinical model. (b) True-positive rate was plotted against risk threshold. Clinical model exhibited lower true-positive rate than did other three models except for risk threshold less than 15%. (c) False-positive rate was plotted against risk threshold. False-positive rates did not differ significantly among four models except for risk threshold less than 15%, whereas false-positive rate in clinical model was much higher. (d) Net benefits (proportion of true-positive results minus weighted proportion of false-positive results with weight equal to ratio of risk threshold to 1 minus risk threshold) of two clinical plus MRI-combined models were comparable and higher than were those of MRI-derived EPE grade or clinical model for risk threshold greater than 10%. Thus, MRI-derived EPE grade can simplify EPE reporting while maintaining same diagnostic performance as by using all MRI features.
Figure 5c:
Figure 5c:
Graphs show performance of four multivariable logistic regression models. Clinical plus MRI-derived extraprostatic extension (EPE) grade model consists of clinical factors and MRI-derived EPE grade; clinical plus MRI features model consists of clinical factors and MRI features. (a) Receiver operating characteristic curves are shown. Both clinical plus MRI-combined models had higher area under receiver operating characteristic curves (AUCs) than did MRI-derived EPE grade model and clinical model. (b) True-positive rate was plotted against risk threshold. Clinical model exhibited lower true-positive rate than did other three models except for risk threshold less than 15%. (c) False-positive rate was plotted against risk threshold. False-positive rates did not differ significantly among four models except for risk threshold less than 15%, whereas false-positive rate in clinical model was much higher. (d) Net benefits (proportion of true-positive results minus weighted proportion of false-positive results with weight equal to ratio of risk threshold to 1 minus risk threshold) of two clinical plus MRI-combined models were comparable and higher than were those of MRI-derived EPE grade or clinical model for risk threshold greater than 10%. Thus, MRI-derived EPE grade can simplify EPE reporting while maintaining same diagnostic performance as by using all MRI features.
Figure 5d:
Figure 5d:
Graphs show performance of four multivariable logistic regression models. Clinical plus MRI-derived extraprostatic extension (EPE) grade model consists of clinical factors and MRI-derived EPE grade; clinical plus MRI features model consists of clinical factors and MRI features. (a) Receiver operating characteristic curves are shown. Both clinical plus MRI-combined models had higher area under receiver operating characteristic curves (AUCs) than did MRI-derived EPE grade model and clinical model. (b) True-positive rate was plotted against risk threshold. Clinical model exhibited lower true-positive rate than did other three models except for risk threshold less than 15%. (c) False-positive rate was plotted against risk threshold. False-positive rates did not differ significantly among four models except for risk threshold less than 15%, whereas false-positive rate in clinical model was much higher. (d) Net benefits (proportion of true-positive results minus weighted proportion of false-positive results with weight equal to ratio of risk threshold to 1 minus risk threshold) of two clinical plus MRI-combined models were comparable and higher than were those of MRI-derived EPE grade or clinical model for risk threshold greater than 10%. Thus, MRI-derived EPE grade can simplify EPE reporting while maintaining same diagnostic performance as by using all MRI features.

Comment in

References

    1. Hull GW, Rabbani F, Abbas F, Wheeler TM, Kattan MW, Scardino PT. Cancer control with radical prostatectomy alone in 1,000 consecutive patients. J Urol 2002;167(2 Pt 1):528–534. - PubMed
    1. Mikel Hubanks J, Boorjian SA, Frank I, et al. . The presence of extracapsular extension is associated with an increased risk of death from prostate cancer after radical prostatectomy for patients with seminal vesicle invasion and negative lymph nodes. Urol Oncol 2014;32(1):26.e1–26.e7. - PubMed
    1. Tollefson MK, Karnes RJ, Rangel LJ, Bergstralh EJ, Boorjian SA. The impact of clinical stage on prostate cancer survival following radical prostatectomy. J Urol 2013;189(5):1707–1712. - PubMed
    1. Wheeler TM, Dillioglugil O, Kattan MW, et al. . Clinical and pathological significance of the level and extent of capsular invasion in clinical stage T1-2 prostate cancer. Hum Pathol 1998;29(8):856–862. - PubMed
    1. Roethke MC, Lichy MP, Kniess M, et al. . Accuracy of preoperative endorectal MRI in predicting extracapsular extension and influence on neurovascular bundle sparing in radical prostatectomy. World J Urol 2013;31(5):1111–1116. - PubMed

Publication types

Substances