. 2019 Feb 1;129(2):820-833.
doi: 10.1172/JCI122954. Epub 2019 Jan 22.

Genetic reduction of eEF2 kinase alleviates pathophysiology in Alzheimer's disease model mice

Affiliations

Genetic reduction of eEF2 kinase alleviates pathophysiology in Alzheimer's disease model mice

Brenna C Beckelman et al. J Clin Invest. .

Abstract

Molecular signaling mechanisms underlying Alzheimer's disease (AD) remain unclear. Maintenance of memory and synaptic plasticity depend on de novo protein synthesis, dysregulation of which is implicated in AD. Recent studies showed AD-associated hyperphosphorylation of mRNA translation factor eukaryotic elongation factor 2 (eEF2), which results in inhibition of protein synthesis. We tested to determine whether suppression of eEF2 phosphorylation could improve protein synthesis capacity and AD-associated cognitive and synaptic impairments. Genetic reduction of the eEF2 kinase (eEF2K) in 2 AD mouse models suppressed AD-associated eEF2 hyperphosphorylation and improved memory deficits and hippocampal long-term potentiation (LTP) impairments without altering brain amyloid β (Aβ) pathology. Furthermore, eEF2K reduction alleviated AD-associated defects in dendritic spine morphology, postsynaptic density formation, de novo protein synthesis, and dendritic polyribosome assembly. Our results link eEF2K/eEF2 signaling dysregulation to AD pathophysiology and therefore offer a feasible therapeutic target.

Keywords: Alzheimer’s disease; Neuroscience; Protein kinases.


Conflict of interest statement

Conflict of interest: The authors have declared that no conflict of interest exists.

Figures

Figure 1
Figure 1. Hyperphosphorylation of eEF2 in the AD hippocampus.
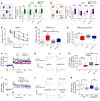
(A) Postmortem human hippocampal lysates from AD patients exhibit increased eEF2 phosphorylation compared with those of age-matched controls (CT). n = 9. *P < 0.05, unpaired t test. (B) Human postmortem hippocampal tissue from FTD patients shows decreased eEF2 phosphorylation compared with that of healthy controls. Controls, n = 8; FTD, n = 5. **P < 0.01, unpaired t test. (C) eEF2 phosphorylation is not affected in hippocampal tissue from LBD patients (n = 4) compared with that of age-matched controls. n = 5. P = 0.99, unpaired t test. Error bars for human patient data indicate ± SEM. (D) Representative images demonstrating hyperphosphorylation of eEF2 in the AD hippocampus. Insets are shown at ×60 magnification. Scale bars: 300 μm (×20); 40 μm (×60). Immunohistochemical experiments were replicated 3 times. (E) Genetic reduction of eEF2K corrects eEF2 hyperphosphorylation in hippocampal lysates from Tg19959 AD model mice. n = 10. *P < 0.05; **P < 0.01, 1-way ANOVA with Tukey’s post hoc test. (F) Representative images from SUnSET puromycin incorporation assay. Image shows 10–250 kDa range. (G) Quantification of de novo protein synthesis via SUnSET assay. WT, n = 6 mice; Tg19959, n = 5; eEF2K+/–, n = 4; Tg19959/eEF2K+/–, n = 8. *P < 0.05; ***P < 0.001, 1-way ANOVA with Tukey’s post hoc test. Box and whisker plots represent the interquartile range, with the line across the box indicating the median. Whiskers show the highest and lowest values detected.
Figure 2
Figure 2. Genetic reduction of eEF2K restores cognitive dysfunction and LTP impairments in Tg19959 AD model mice.
(A) Novel object recognition (NOR) paradigm and object preference for familiar and novel object. (WT, n = 11; Tg19959, n = 14; eEF2K+/–, n = 14; Tg19959/eEF2K+/–, n = 11. *P < 0.05, paired t test). (B) OLM task and object preference for familiar and new locations (WT, n = 10; Tg19959, n = 11; eEF2K+/–, n = 12; Tg19959/eEF2K+/–, n = 10. *P < 0.05; **P < 0.01; ***P < 0.001, paired t test). (C) Escape latency in MWM. Tg19959 (n = 12) had significantly longer latency to platform than WT (n = 14; P < 0.001), eEF2K+/– (n = 15; P < 0.001), and Tg19959/eEF2K+/–. n = 10. P < 0.05, 1-way repeated measures ANOVA with Tukey’s post hoc tests. (D) Escape latency on day 5 of MWM training. **P < 0.01; ***P < 0.001, 1-way ANOVA with Tukey’s post hoc test. (E) Percentage of time in target quadrant during MWM probe trial. **P < 0.01, 1-way ANOVA with Tukey’s post hoc test. (F) Hippocampal LTP in WT (n = 12 slices), Tg19959 (n = 9), eEF2K+/– (n = 9), and Tg19959/eEF2K+/– (n = 9) mice. Arrow indicates HFS. Tg19959 slices had significantly impaired LTP compared with WT (P < 0.0001), eEF2K+/– (P < 0.0001), and Tg19959/eEF2K+/– (P < 0.01) slices (1-way repeated measures ANOVA with Tukey’s post hoc tests). (G) Representative traces before and after HFS. (H) fEPSP slope 60 minutes after HFS. **P < 0.01; ***P < 0.001, 1-way ANOVA with Tukey’s post hoc test. (I) WT and Tg19959/eEF2K+/– slices were treated with vehicle (DMSO; WT, n = 7 slices; Tg19959/eEF2K+/–, n = 10) or the protein synthesis inhibitor anisomycin (40 μM; WT, n = 7; Tg19959/eEF2K+/–, n = 17) and stimulated with HFS to induce LTP. Tg19959/eEF2K+/– slices exposed to anisomycin had significantly impaired LTP compared with vehicle slices. P < 0.0001, 1-way repeated measures ANOVA with Tukey’s post hoc tests. (J) Representative traces before and after HFS. (K) fEPSP slope 60 minutes after HFS. *P < 0.05; **P < 0.01, 1-way ANOVA with Tukey’s post hoc test.
Figure 3
Figure 3. Amyloid plaque deposition in Tg19959 AD model mice is not affected by genetic reduction of eEF2K.
(A) Representative images of hippocampal plaque deposition in WT, Tg19959, eEF2K+/–, and Tg19959/eEF2K+/– mice. Insets are shown at ×60 magnification. Scale bars: 300 μm (×20); 40 μm (×60). (B) Percentage of hippocampal area covered in amyloid plaques in Tg19959 (n = 9 sections) and Tg19959/eEF2K+/– mice (n = 10). P = 0.68, unpaired t test. (C) Representative images of somatosensory cortical plaque deposition in WT, Tg19959, eEF2K+/–, and Tg19959/eEF2K+/– mice. Insets are shown at ×60 magnification. Scale bars: 300 μm (×20); 40 μm (×60). (D) Percentage of cortical area covered by amyloid plaques in Tg19959 and Tg19959/eEF2K+/– mice. P = 0.33, unpaired t test. Box and whisker plots represent the interquartile range, with the line across the box indicating the median. Whiskers show the highest and lowest values detected. (E) ELISA showed no differences in levels of Aβ 1–42 or Aβ 1–40 oligomers (F) in Tg19959 and Tg19959/eEF2K+/– forebrain tissue. n = 8. P = 0.32 for Aβ 1-42; P = 0.11 for Aβ 1-40, unpaired t test. ELISAs were performed in triplicate. Error bars represent ± SEM.
Figure 4
Figure 4. Genetic reduction of eEF2K restores spine density in hippocampus from Tg19959 mice.
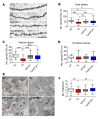
(A) Representative images from Golgi-Cox stain of area CA1 dendritic spines. Original magnification, ×100. Scale bar: 12 μm. (B) Total CA1 spine density per 100 μm. WT, n = 34 dendrites; Tg19559, n = 58; eEF2K+/–, n = 40; Tg19959/eEF2K+/–, n = 50. (C) Mature spine density per 100 μm. Branched and mushroom type spines were classified as mature. (D) Immature spine density per 100 μm. Thin and filopodial spines were classified as immature. (E) Representative TEM images for CA1 PSDs. n = 3 mice per genotype. Original magnification, ×11,000. Scale bar: 500 nm. (F) Number of PSDs per μm2. *P < 0.05; **P < 0.01; ***P < 0.001, 1-way ANOVA with Tukey’s post hoc test. Box and whisker plots represent the interquartile range, with the line across the box indicating the median. Whiskers show the highest and lowest values detected.
Figure 5
Figure 5. Suppression of eEF2K enhances translation in hippocampus from Tg19959 mice.
(A) Representative TEM images for CA1 polyribosomes. Arrows indicate polyribosomes. n = 3 mice per genotype. Original magnification, ×11,000. Scale bar: 500 nm. (B) Number of polyribosomes per μm2. *P < 0.05; ***P < 0.001, 1-way ANOVA with Tukey’s post hoc test. Box and whisker plots represent the interquartile range, with the line across the box indicating the median. Whiskers show the highest and lowest values detected. (C) Functional classification of proteins upregulated in hippocampus from Tg19959/eEF2K+/– compared with Tg19959 mice by MS analysis. n = 3 mice per genotype. (D) Functional classifications of proteins downregulated in Tg19959/eEF2K+/– compared with Tg19959 hippocampi.
Figure 6
Figure 6. Reduction of eEF2K rescued memory and synaptic plasticity failure in APP/PS1 AD model mice.
(A) Representative images showing decreased eEF2 phosphorylation in APP/PS1 AD model mice with genetic reduction of eEF2K. (B) Quantification of results shown in A. WT, n = 9; APP/PS1, n = 10; eEF2K+/–, n = 9; APP/PS1/eEF2K+/–, n = 10. *P < 0.05; **P < 0.01, 1-way ANOVA with Tukey’s post hoc tests. (C) Object preference for familiar or novel objects in NOR paradigm. WT, n = 12; APP/PS1, n = 13; eEF2K+/–, n = 10; APP/PS1/eEF2K+/–, n = 13. *P < 0.05, paired t test. (D) Object preference in familiar or new location in OLM task. *P < 0.05, paired t test. (E) Acute hippocampal slices were stimulated with HFS to induce LTP at the CA3-CA1 synapse. WT, n = 11; APP/PS1, n = 12; eEF2K+/–, n = 7; APP/PS1/eEF2K+/–, n = 9. APP/PS1 slices exhibited significantly impaired LTP compared with WT (P < 0.0001), eEF2K+/– (P < 0.0001), and APP/PS1/eEF2K+/– (P < 0.0001) slices. One-way repeated measures ANOVA with Tukey’s post hoc tests. (F) fEPSP slope 60 minutes after HFS. *P < 0.05, 1-way ANOVA with Tukey’s post hoc tests. (G) ELISA showed no differences in levels of Aβ 1–42 or Aβ 1–40 oligomers (H) in APP/PS1 and APP/PS1/eEF2K+/– forebrain tissue. n = 8. P = 0.49 for Aβ 1-42; P = 0.17 for Aβ 1-40, unpaired t test. ELISAs were performed in triplicate. Box and whisker plots represent the interquartile range, with the line across the box indicating the median. Whiskers show the highest and lowest values detected. Scatter plots are shown with mean ± SEM.

References

    1. Selkoe DJ. Alzheimer’s disease is a synaptic failure. Science. 2002;298(5594):789–791. doi: 10.1126/science.1074069. - DOI - PubMed
    1. Mochida H, Sato K, Sasaki S, Yazawa I, Kamino K, Momose-Sato Y. Effects of anisomycin on LTP in the hippocampal CA1: long-term analysis using optical recording. Neuroreport. 2001;12(5):987–991. doi: 10.1097/00001756-200104170-00025. - DOI - PubMed
    1. Remaud J, et al. Anisomycin injection in area CA3 of the hippocampus impairs both short-term and long-term memories of contextual fear. Learn Mem. 2014;21(6):311–315. doi: 10.1101/lm.033969.113. - DOI - PMC - PubMed
    1. Rossato JI, Bevilaqua LR, Myskiw JC, Medina JH, Izquierdo I, Cammarota M. On the role of hippocampal protein synthesis in the consolidation and reconsolidation of object recognition memory. Learn Mem. 2007;14(1):36–46. - PMC - PubMed
    1. Costa-Mattioli M, Sossin WS, Klann E, Sonenberg N. Translational control of long-lasting synaptic plasticity and memory. Neuron. 2009;61(1):10–26. doi: 10.1016/j.neuron.2008.10.055. - DOI - PMC - PubMed

Publication types

MeSH terms

Substances