. 2019;11(1):1-9.
doi: 10.1080/19382014.2018.1557486. Epub 2019 Jan 22.

Pancreatic beta cell/islet mass and body mass index

Affiliations

Pancreatic beta cell/islet mass and body mass index

Michael P Dybala et al. Islets. 2019.

Abstract

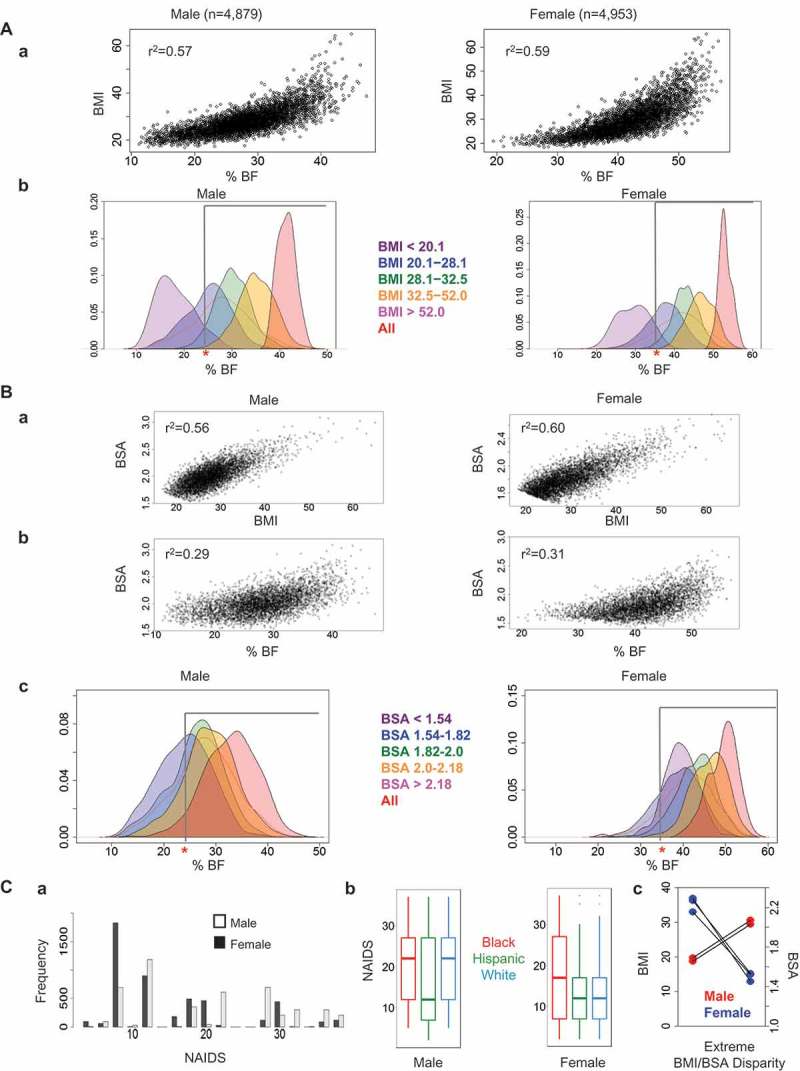
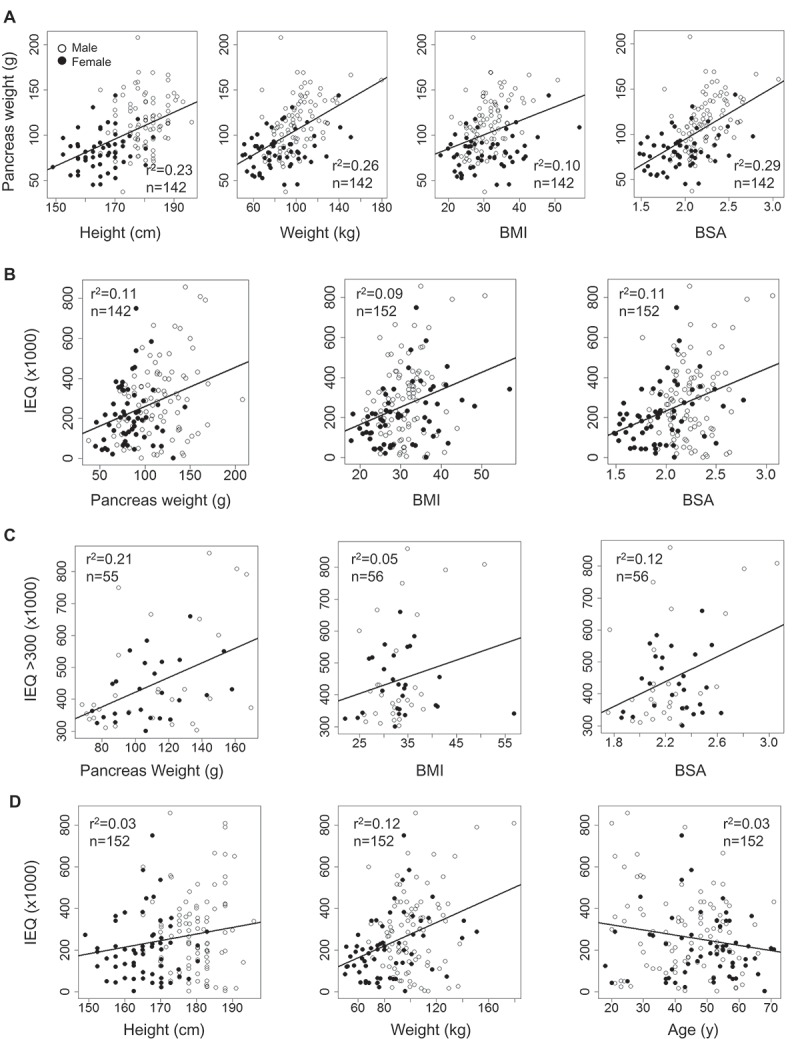
Body mass index (BMI) is widely used to define obesity. In studies of pancreatic beta-cell/islet mass, BMI is also a common standard for matching control subjects in comparative studies along with age and sex, based on the existing dogma of their significant positive correlation reported in the literature. We aimed to test the feasibility of BMI and BSA to assess obesity and predict beta-cell/islet mass. We used National Health and Nutrition Examination Survey (NHANES) data that provided dual-energy Xray absorptiometry (DXA)-measured fat mass (percent body fat; %BF), BMI, and BSA for adult subjects (20-75y; 4,879 males and 4,953 females). We then analyzed 152 cases of islet isolation performed at our center for correlation between islet yields and various donor anthropometric indices. From NHANES, over 50% of male subjects and 60% of female subjects with BMI:20.1-28.1 were obese as defined by %BF, indicating a poor correlation between BMI and %BF. BSA was also a poor indicator of %BF, as broad overlap was observed in different BSA ranges. Additionally, BMI and BSA ranges markedly varied between sex and race/ethnicity groups. From islet isolation, BMI and BSA accounted for only a small proportion of variance in islet equivalent (IEQ; r2 = 0.09 and 0.11, respectively). BMI and obesity were strongly correlated in cases of high BMI subjects. However, the critical populations were non-obese subjects with BMI ranging from 20.1-28.1, in which a substantial proportion of individuals may carry excess body fat. Correlations between BMI, BSA, pancreas weight and beta-cell/islet mass were low.

Keywords: adiposity; beta cell mass; body mass index; body surface area; islets; obesity.


Figures

Figure 1.
Figure 1.
Relationship of %BF with BMI and BSA. A. Distribution of %BF by BMI range. (a) DXA-measured percentage of body fat (%BF) compared with BMI in non-diabetic adults; male adults (n = 4,879) and female adults (n = 4,953). (b) Distribution of %BF plotted according to BMI ranges. The population was classified into five BMI groups used in NAIDS; BMI<20.1 (purple), BMI:20.1–28.1 (blue), BMI:28.1–32.5 (green), BMI:32.5–52.0 (yellow), and BMI>52.0 (red). The red line depicts the proportion of individuals with a given %BF for all subjects. The cutoff for obesity as determined by %BF is shown by the gray bar (25% for males and 35% for females). (B) Distribution of %BF by BSA range. (a) Correlation between BMI and BSA. (b) DXA-measured %BF compared with BSA in male and female adults. c. Distribution of %BF by sex plotted according to BSA ranges. The population was classified into five BSA groups used in NAIDS; BSA<1.54 (purple), BSA:1.54–1.82 (blue), BSA:1.82–2 (green), BSA:2–2.18 (orange), and BSA>2.18 (red). (C) Comparison of NAIDS, BMI, and BSA by sex. a. Distribution of NAIDS for male and female subjects from NHANES data set. (b) Distribution of NAIDS across sex and race/ethnicity groups from NHANES data set. The center bar indicates the median of each group, the box contains the 25th-75th percentile of data, and the whiskers show the range of all data. (c) Cases of extreme BMI/BSA disparity in males and females from NHANES data set.
Figure 2.
Figure 2.
Relationship between post-purification IEQ and various parameters from donors. (A) Pancreas weight: height, weight, BMI and BSA. (B) IEQ: pancreas weight, BMI and BSA. (C) IEQ>300K: pancreas weight, BMI and BSA. (D) IEQ: height, weight and age. Males: open circles and females: closed circles.

References

    1. Wang X, Zielinski MC, Misawa R, Wen P, Wang T-Y, Wang C-Z, Witkowski P, Hara M.. Quantitative analysis of pancreatic polypeptide cell distribution in the human pancreas. PloS One. 2013;8(1):e55501. doi:10.1371/journal.pone.0055501. - DOI - PMC - PubMed
    1. Wang X, Misawa R, Zielinski MC, Cowen P, Jo J, Periwal V, Ricordi C, Khan A, Szust J, Shen J, et al. Regional differences in islet distribution in the human pancreas–preferential beta-cell loss in the head region in patients with type 2 diabetes. PLoS One. 2013;8:e67454. doi:10.1371/journal.pone.0067454. - DOI - PMC - PubMed
    1. Poudel A, Fowler JL, Zielinski MC, Kilimnik G., Hara M.. Stereological analyses of the whole human pancreas. Sci Rep. 2016;6:34049. doi:10.1038/srep34049. - DOI - PMC - PubMed
    1. Poudel A, Savari O, Striegel DA, Periwal V, Taxy J, Millis JM, Witkowski P, Atkinson MA, Hara M.. Beta-cell destruction and preservation in childhood and adult onset type 1 diabetes. Endocrine. 2015;49:693–702. doi:10.1007/s12020-015-0534-9. - DOI - PMC - PubMed
    1. Olehnik SK, Fowler JL, Avramovich G, Hara M.. Quantitative analysis of intra-and inter-individual variability of human beta-cell mass. Sci Rep. 2017;7:16398. doi:10.1038/s41598-017-16300-w. - DOI - PMC - PubMed

Publication types