Comparative Study
. 2019 Jan 22;14(1):e0210775.
doi: 10.1371/journal.pone.0210775. eCollection 2019.

Limiting factors for wearing personal protective equipment (PPE) in a health care environment evaluated in a randomised study

Affiliations
Comparative Study

Limiting factors for wearing personal protective equipment (PPE) in a health care environment evaluated in a randomised study

Martina Loibner et al. PLoS One. .

Abstract

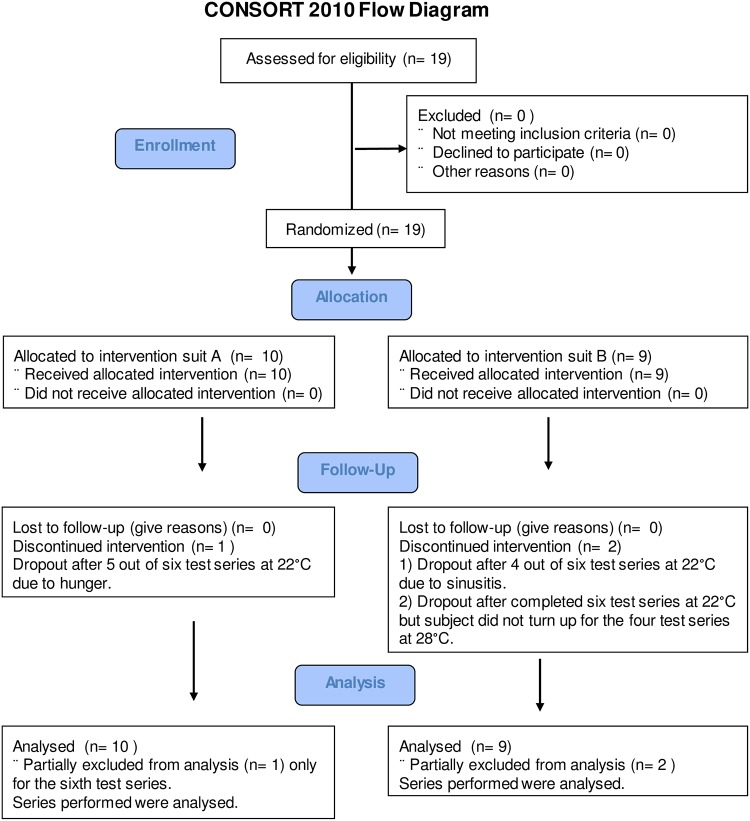
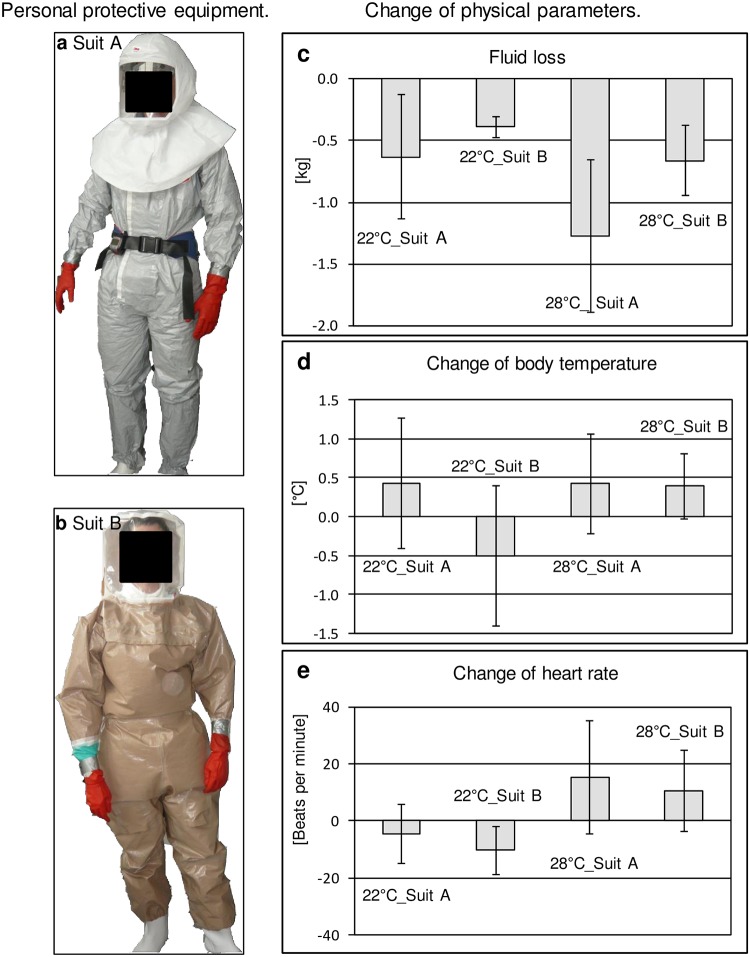
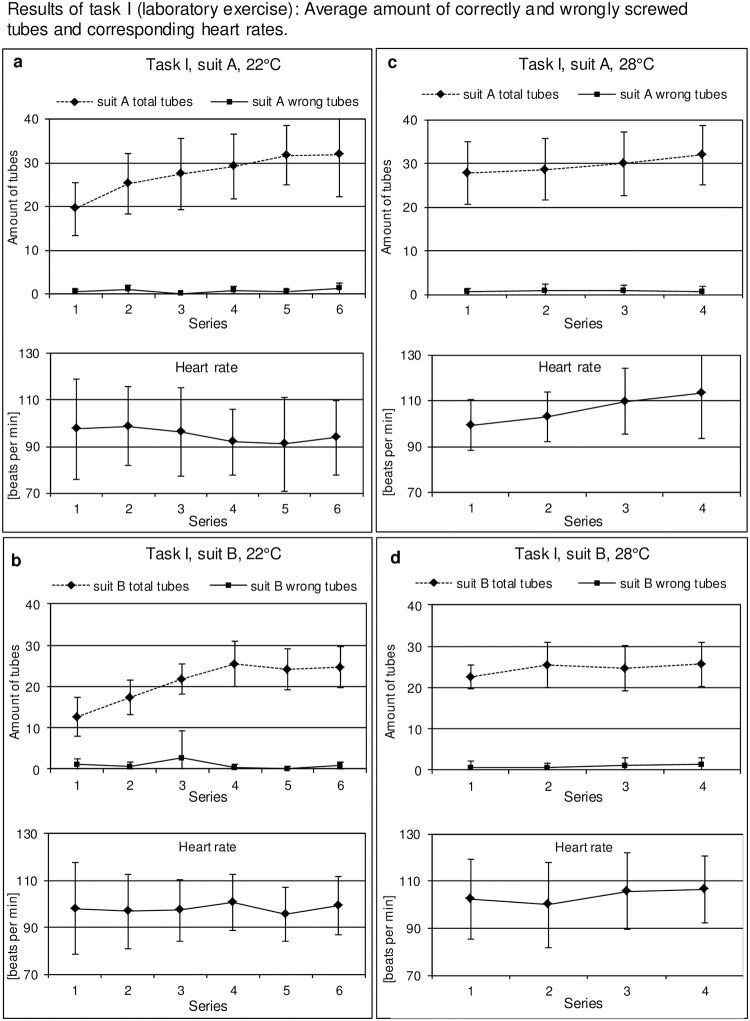
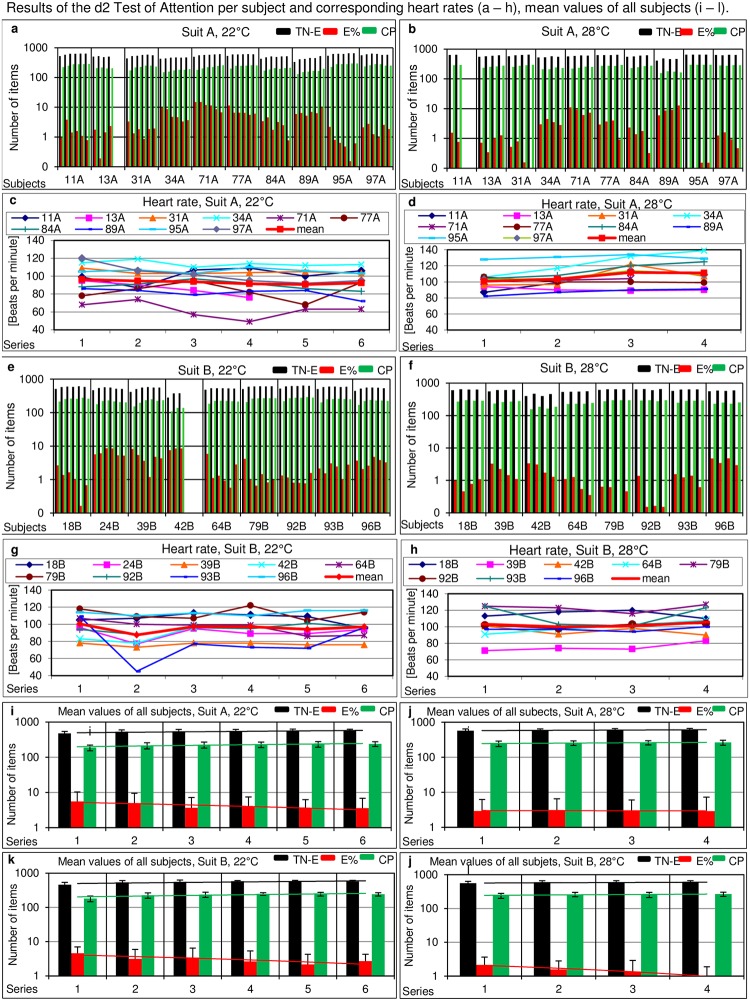
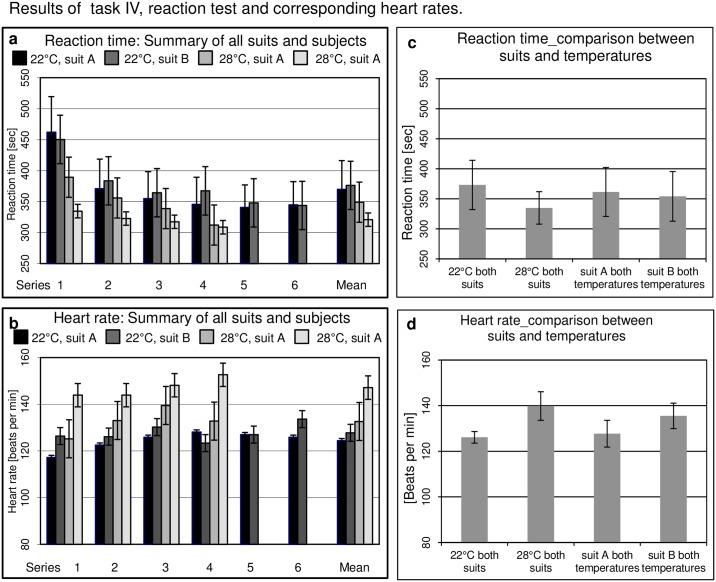
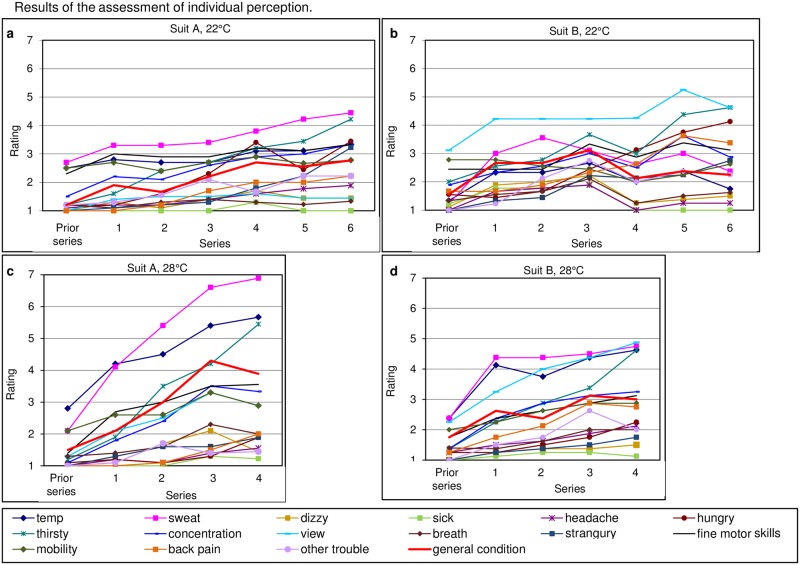
Pandemics and re-emerging diseases put pressure on the health care system to prepare for patient care and sample logistics requiring enhanced personnel protective equipment (PPE) for health care workers. We generated quantifiable data on ergonomics of PPE applicable in a health care setting by defining error rates and physically limiting factors due to PPE-induced restrictions. Nineteen study volunteers tested randomly allocated head- or full body-ventilated PPE suits equipped with powered-air-purifying-respirators and performed four different tasks (two laboratory tutorials, a timed test of selective attention and a test investigating reaction time, mobility, speed and physical exercise) during 6 working hours at 22°C on one day and 4 working hours at 28°C on another day. Error rates and physical parameters (fluid loss, body temperature, heart rate) were determined and ergonomic-related parameters were assessed hourly using assessment sheets. Depending on the PPE system the most restrictive factors, which however had no negative impact on performance (speed and error rate), were: reduced dexterity due to multiple glove layers, impaired visibility by flexible face shields and back pain related to the respirator of the fully ventilated suit. Heat stress and liquid loss were perceived as restrictive at a working temperature of 28°C but not 22°C.

Trial registration: ClinicalTrials.gov NCT03004690.


Conflict of interest statement

The authors have declared that no competing interests exist.

Figures

Fig 1
Fig 1. CONSORT flow diagram.
Fig 2
Fig 2. Personal protective equipment (suit A, suit B) and change of physical parameters.
Suit A. (b) Suit B. (c) Fluid loss, (d) change of body temperature and (e) change of heart rate of subjects wearing different PPE were measured before the start and immediately after termination of the task series at 22°C (6 hours) and 28°C (4 hours). Mean values plus/minus standard deviation.
Fig 3
Fig 3. Results of task I (screwing tubes).
Graphs show mean values and standard deviations calculated from the amount of all processed and wrongly screwed tubes (Y-axis) for 6 series (X-axis) by the subjects under the indicated conditions. (a) Suit A at 22°C, 6 series. (b) Suit B at 22°C, 6 series. (c) Suit A at 28°C, 4 series. (d) Suit B, 28°C, 4 series. The corresponding heart rates during the various task series are shown in the corresponding panels below.
Fig 4
Fig 4. Results of the d2 test of attention.
a, b, e, f: Y-axis: Graphs show TN-E (black bars), the amount of symbols recognized correctly, E% (red bars), the percentage of errors and CP (green bars), index of concentration performance. X-axis: Individual performance values of each subject performing six series at 22°C with (a) suit A, (e) suit B and four tests at 28°C (b) suit A and (f) suit B are divided by vertical lines. c, d, g, h: Courses of every individual´s heart rate corresponding to d2 test performances during the six or four tests, respectively. i, j, k and l: Mean values of all subjects calculated per test series including a trend line showing the average development of TN-E and E% in 6 series at 22°C and 4 series at 28°C.
Fig 5
Fig 5. Task IV. Reaction time.
Reaction time was evaluated by digital readouts on a screen indicating to tap four touch sensors with the hands located on the left and right side in front of and behind the subject and two touch sensors for the feet.
Fig 6
Fig 6. Results of the assessment of individual perception.
Participants rated their individual comfort and general condition in an assessment sheet prior to and after the task series from 1 (= low interference) to 10 (= high interference, cause for termination).

References

    1. Castle N, Owen R, Hann M, Clark S, Reeves D, Gurney I. Impact of chemical, biological, radiation, and nuclear personal protective equipment on the performance of low- and high-dexterity airway and vascular access skills. Resuscitation. 2009;80(11): 1290–5. 10.1016/j.resuscitation.2009.08.001 - DOI - PubMed
    1. Kümin D, Krebs C, Wick P. How to Choose a Suit for a BSL-4 Laboratory- The Approach Taken at SPIEZ LABORATORY. Applied Biosafety. 2011;16 (2): 94–102.
    1. O´Brian C, Blanchard L, Cadarette B, Endrisick T, Xu X, Berglund L. Methods of Evaluating Protective Clothing Relative to Heat and Cold Stress: Thermal Manikin, Biomedical Modeling and Human Testing. J Occup Environ Hyg. 2011;8: 588–599. 10.1080/15459624.2011.613291 - DOI - PubMed
    1. Merens A, Cavallo JD, Thibault F, Salicis F, Munoz JF, Courcol R, et al. Assessment of the bio-preparedness and of the training of the French hospital laboratories in the event of biological threat. Euro Surveill 2012;17(45):20312 - PubMed
    1. Garner A, Laurence H, Lee A. Practicality of performing medical procedures in chemical protective ensembles. Emerg Med Australas 2004;16(2): 108–13. 10.1111/j.1742-6723.2004.00560.x - DOI - PubMed

Publication types

Associated data