. 2019 Jan 22;15(1):e1007889.
doi: 10.1371/journal.pgen.1007889. eCollection 2019 Jan.

Integrating predicted transcriptome from multiple tissues improves association detection

Affiliations

Integrating predicted transcriptome from multiple tissues improves association detection

Alvaro N Barbeira et al. PLoS Genet. .

Abstract

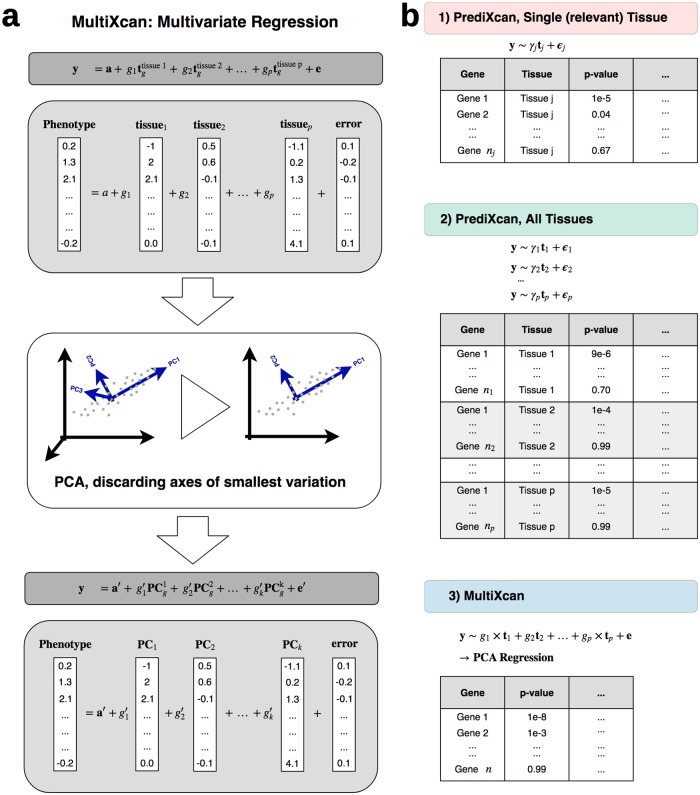
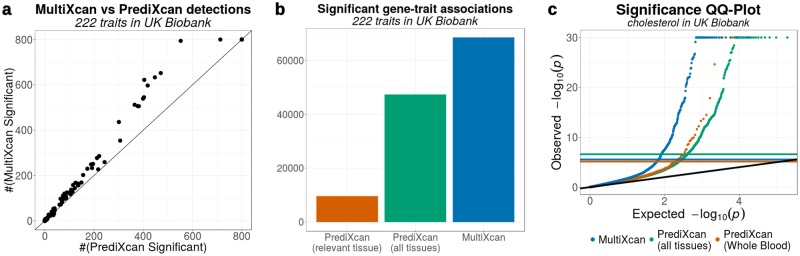
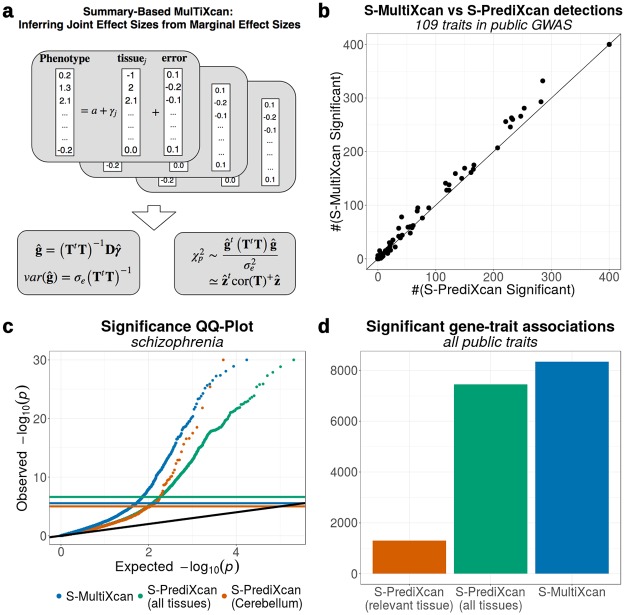
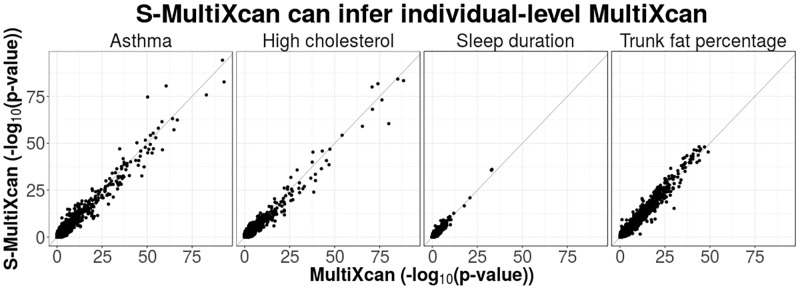
Integration of genome-wide association studies (GWAS) and expression quantitative trait loci (eQTL) studies is needed to improve our understanding of the biological mechanisms underlying GWAS hits, and our ability to identify therapeutic targets. Gene-level association methods such as PrediXcan can prioritize candidate targets. However, limited eQTL sample sizes and absence of relevant developmental and disease context restrict our ability to detect associations. Here we propose an efficient statistical method (MultiXcan) that leverages the substantial sharing of eQTLs across tissues and contexts to improve our ability to identify potential target genes. MultiXcan integrates evidence across multiple panels using multivariate regression, which naturally takes into account the correlation structure. We apply our method to simulated and real traits from the UK Biobank and show that, in realistic settings, we can detect a larger set of significantly associated genes than using each panel separately. To improve applicability, we developed a summary result-based extension called S-MultiXcan, which we show yields highly concordant results with the individual level version when LD is well matched. Our multivariate model-based approach allowed us to use the individual level results as a gold standard to calibrate and develop a robust implementation of the summary-based extension. Results from our analysis as well as software and necessary resources to apply our method are publicly available.


Conflict of interest statement

The authors have declared that no competing interests exist.

Figures

Fig 1
Fig 1. MultiXcan method.
Panel a illustrates the MultiXcan method. Predicted expression from all available tissue models are used as explanatory variables. To avoid multicolinearity, we use the first k Principal Components of the predicted expression. y is a vector of phenotypes for n individuals, tgtissuej is the standardized predicted gene expression for tissue j, gj is its effect size, a is an intercept and e is an error term. Panel b shows a schematic representation of MultiXcan results compared to classical PrediXcan, both for a single relevant tissue and all available tissues in agnostic scanning. y is a (centered) vector of phenotypes for n individuals, tj is the standardized predicted gene expression for model j, gj is its effect size in the joint regression, γj is its effect size in the marginal regression using only prediction j, e and ϵj are error terms.
Fig 2
Fig 2. Improved significance of MultiXcan vs PrediXcan across a broad set of traits.
Panel a compares the number of significant associations detected by MultiXcan and PrediXcan for 222 traits from UK Biobank. These numbers were thresholded at 800 for visualization purposes. Panel b shows the number of discoveries in each method across the 222 UK Biobank traits. MultiXcan is able to detect more findings PrediXcan, either with a single tissue or using all 44 GTEx tissues. Panel c compares the distribution of MultiXcan’s p-values to PrediXcan’s p-values for the Cholesterol trait in the UK Biobank cohort. Both PrediXcan with a single tissue model (GTEx Whole Blood) and 44 models (GTEx v6p models) are shown. Notice that Bonferroni-significance levels are different for each case, since 6588 genes were tested in PrediXcan for Whole Blood, 195532 gene-tissue pairs for all GTEx tissues, and 17434 genes in MultiXcan. P-values were truncated at 10−30 for visualization convenience.
Fig 3
Fig 3. MultiXcan results can be inferred from GWAS summary statistics and a reference panel.
Panel a illustrates the S-MultiXcan method: the joint effect sizes are inferred from the marginal univariate effect sizes obtained from S-PrediXcan. Significance is quantified using the estimated covariance of the multivariate effect sizes. With the approximations described in Methods, the final χ2 statistics ends up being equivalent to the omnibus test. Panel b compares the number of associations significant via S-MultiXcan versus those significant via S-PrediXcan, for the same GWAS Studies. In most cases, S-MultiXcan detects a larger number of significant associations. The number of discoveries was thresholded at 200 for visualization purposes. Panel c displays QQ-Plots for the association p-values from S-MultiXcan and S-PrediXcan in Schizophrenia, using a model trained on brain’s cerebellum, and S-PrediXcan associations for all 44 GTEx tissues. Panel d shows the number of significant associations across all public GWAS traits for each method as a bar plot.
Fig 4
Fig 4. Comparison between S-MultiXcan and individual-level MultiXcan.
This figure compares S-MultiXcan to MultiXcan in four UK Biobank phenotypes. GTEx individuals were used as a reference panel for estimating expression correlation in the study population. The summary data-based method shows a good level of agreement with the individual-based method. In cases where the LD-structure between reference and study cohorts is mismatched, the summary-based method becomes less accurate. For example in Asthma, two genes are overestimated; however it tends to be conservative for most genes.

References

    1. Smoller JW, Craddock N, Kendler K, Lee PH, Neale BM, Nurnberger JI, et al. Identification of risk loci with shared effects on five major psychiatric disorders: a genome-wide analysis. Lancet. 2013;381(9875):1371–9. Available from: 026E30F$nhttp://www.ncbi.nlm.nih.gov/pubmed/23453885">http://discovery.u.... - PMC - PubMed
    1. Deloukas P, Kanoni S, Willenborg C, Farrall M, Assimes TL, Thompson JR, et al. Large-scale association analysis identifies new risk loci for coronary artery disease. Nature genetics. 2013;45(1):25–33. Available from: http://www.pubmedcentral.nih.gov/articlerender.fcgi?artid=3679547{&}tool.... - PMC - PubMed
    1. Morris AP, Voight BF, Teslovich TM, Ferreira T, Segrè AV, Steinthorsdottir V, et al. Large-scale association analysis provides insights into the genetic architecture and pathophysiology of type 2 diabetes. Nature Genetics. 2012;44(9):981–990. Available from: 026E30F$nhttp://www.nature.com/doifinder/10.1038/ng.2383">http://www.ncb.... - DOI - PMC - PubMed
    1. Nica AC, Montgomery SB, Dimas AS, Stranger BE, Beazley C, Barroso I, et al. Candidate causal regulatory effects by integration of expression QTLs with complex trait genetic associations. PLoS Genetics. 2010;6(4). 10.1371/journal.pgen.1000895 - DOI - PMC - PubMed
    1. Nicolae DL, Gamazon E, Zhang W, Duan S, Eileen Dolan M, Cox NJ. Trait-associated SNPs are more likely to be eQTLs: Annotation to enhance discovery from GWAS. PLoS Genetics. 2010;6(4). 10.1371/journal.pgen.1000888 - DOI - PMC - PubMed

Publication types

MeSH terms