. 2019 Jan 22;15(1):e1006600.
doi: 10.1371/journal.pcbi.1006600. eCollection 2019 Jan.

Differential mobility and local variation in infection attack rate

Affiliations

Differential mobility and local variation in infection attack rate

David J Haw et al. PLoS Comput Biol. .

Abstract

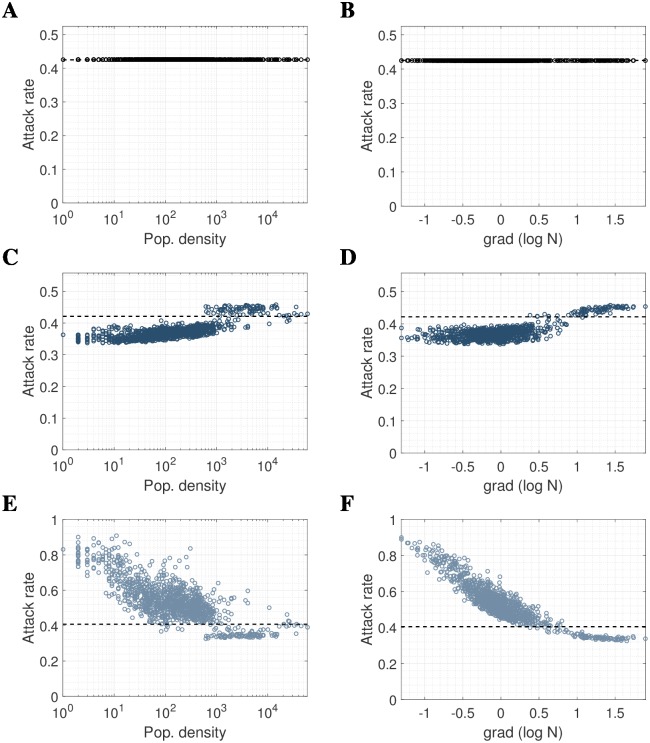
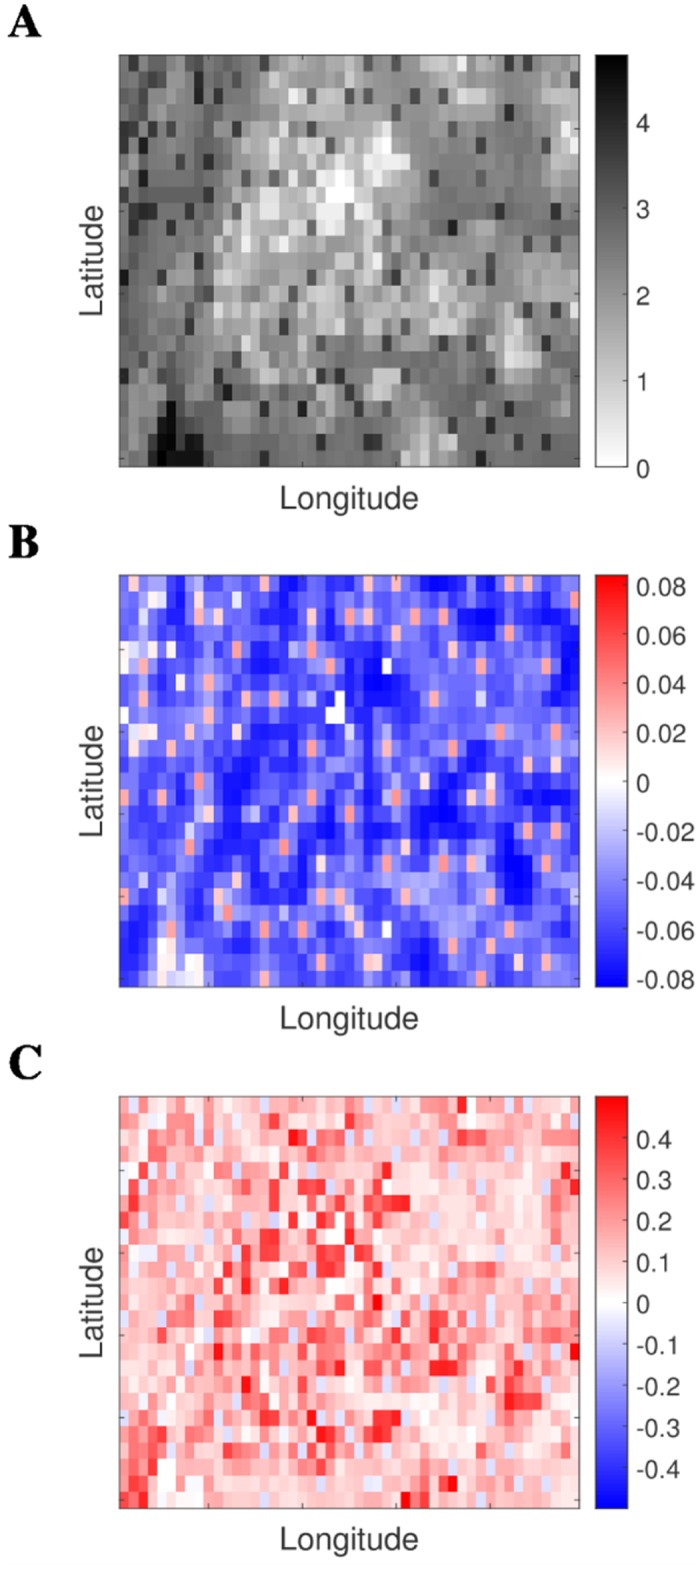
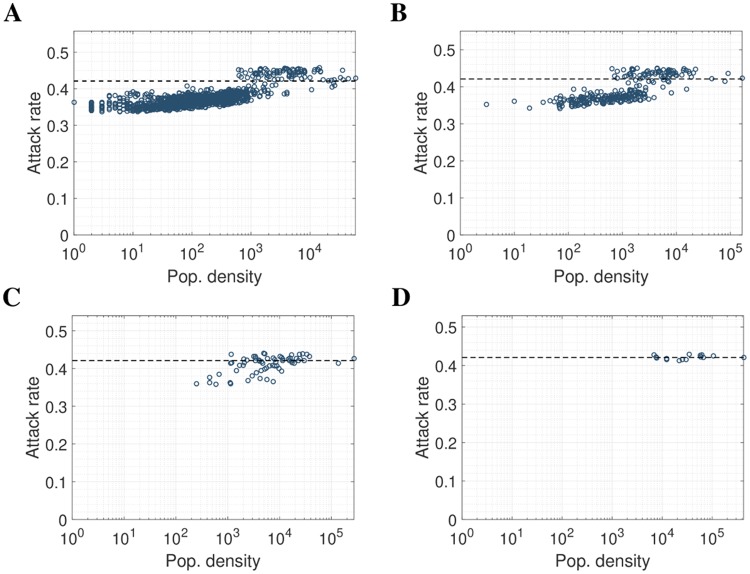
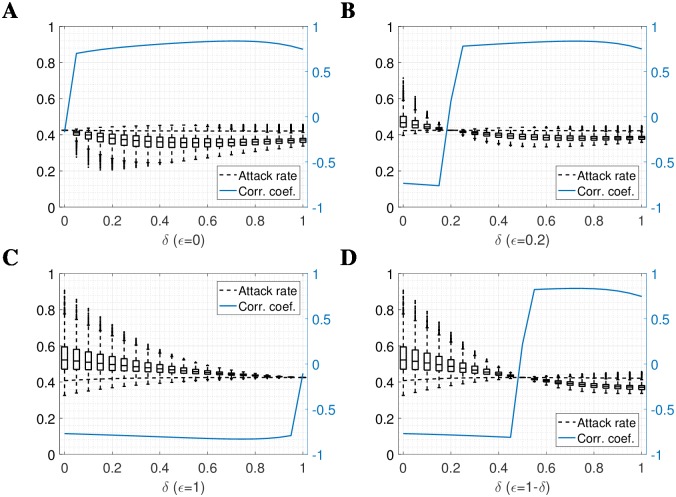
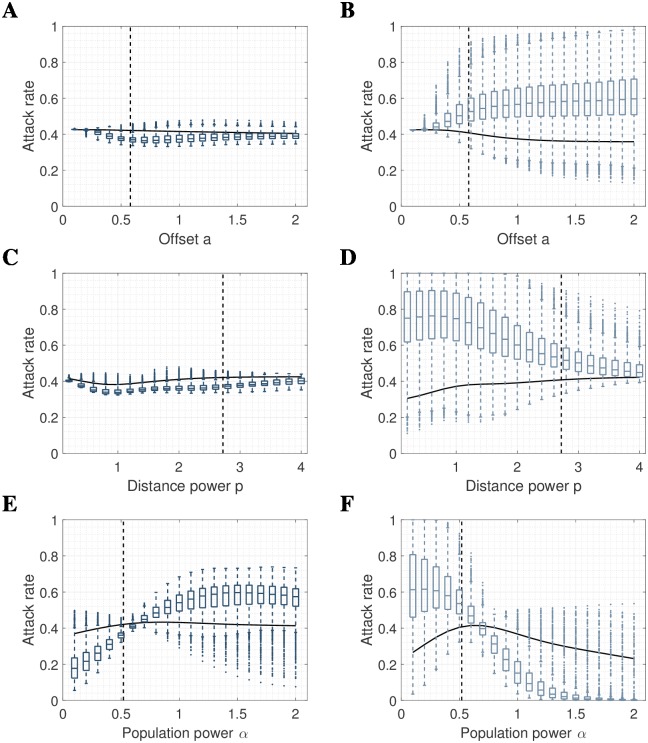
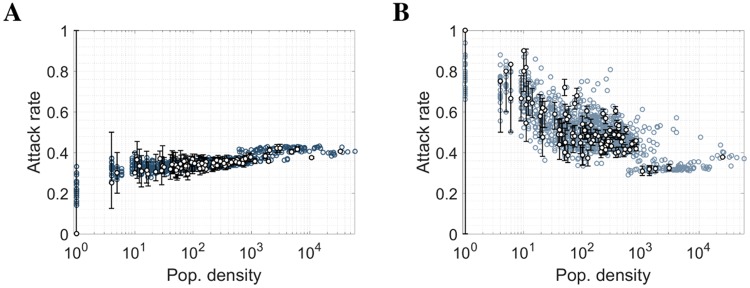
Infectious disease transmission is an inherently spatial process in which a host's home location and their social mixing patterns are important, with the mixing of infectious individuals often different to that of susceptible individuals. Although incidence data for humans have traditionally been aggregated into low-resolution data sets, modern representative surveillance systems such as electronic hospital records generate high volume case data with precise home locations. Here, we use a gridded spatial transmission model of arbitrary resolution to investigate the theoretical relationship between population density, differential population movement and local variability in incidence. We show analytically that a uniform local attack rate is typically only possible for individual pixels in the grid if susceptible and infectious individuals move in the same way. Using a population in Guangdong, China, for which a robust quantitative description of movement is available (a travel kernel), and a natural history consistent with pandemic influenza; we show that local cumulative incidence is positively correlated with population density when susceptible individuals are more connected in space than infectious individuals. Conversely, under the less intuitively likely scenario, when infectious individuals are more connected, local cumulative incidence is negatively correlated with population density. The strength and direction of correlation changes sign for other kernel parameter values. We show that simulation models in which it is assumed implicitly that only infectious individuals move are assuming a slightly unusual specific correlation between population density and attack rate. However, we also show that this potential structural bias can be corrected by using the appropriate non-isotropic kernel that maps infectious-only code onto the isotropic dual-mobility kernel. These results describe a precise relationship between the spatio-social mixing of infectious and susceptible individuals and local variability in attack rates. More generally, these results suggest a genuine risk that mechanistic models of high-resolution attack rate data may reach spurious conclusions if the precise implications of spatial force-of-infection assumptions are not first fully characterized, prior to models being fit to data.


Conflict of interest statement

The authors have declared that no competing interests exist.

Figures

Fig 1
Fig 1. The relationship between force-of-infection (FOI) assumptions, local attack rates, population density and population density gradient, for a pandemic-influenza-like epidemic.
The LHS shows the relationship between population density N (people/km2) and attack rate for (A) mobility independent of infection status (dual mobility), (C) mobility in non-infectious population only (S-mobility) and (E) mobility in infectious population only (I-mobility). The RHS shows the relationship between the gradient of log10N and attack rate for (B) dual mobility, (D) S-mobility and (F) I-mobility. We used a 33km by 55km grid of 1km by 1km pixels to the North-East of Guangzhou, with kernel parameters α = 0.52, a = 0.58, p = 2.72 and influenza natural history parameters R0 = 1.8, γ = 1/2.6. Population gradient was defined as the difference between the log population density of a pixel and the average log population density of the 8 surrounding pixels.
Fig 2
Fig 2. Spatial illustration of population density and non-uniform attack rates generated using different mobility assumptions.
(A) Log10 population density (people/km2). (B) Difference between location-specific attack rates and global attack rate for S-mobility and (C) difference between location-specific attack rates and global attack rate for I-mobility. We change color scale between plots to better illustrate the emergent patterns. A total of 4 pixels are unpopulated and so attack rates are necessarily always zero in these locations.
Fig 3
Fig 3. Aggregation of result using S-mobility.
Plots show (A) initial result, aggregated into (B) 2km by 2km, (C) 4km by 4km, and (D) 8km by 8km pixels.
Fig 4
Fig 4. Limiting mobility of susceptible/recovered and immune agents according to parameters δ and ϵ.
Mobility of the non-infective population is described by δ such that δ = 0 yields no mobility, δ = 1 yields mobility described by the kernel K, and transformation between these 2 extremes in linear. Similarly, ϵ describes the mobility of the infective population. Any values of δ = ϵ thus yield (reduced) dual mobility, and so attack rates are uniform in space. Plots show (A) infectious population immobile, non-infectious mobility ranging from δ = 0 to δ = 1, moving from dual mobility to S-mobility, (B) constant reduced mobility in the infectious population (ϵ = 0.2), possibly accounting for mobility in asymptomatic cases only, (C) full mobility in the infectious population, moving from I-mobility to dual mobility, and (D) ϵ = 1 − δ, illustrating the transition from I-mobility to S-mobility. Dashed lines show the global attack rate, and solid blue lines show correlation coefficient with log population density.
Fig 5
Fig 5. Sensitivity analysis.
Distribution of local attack rates with respect to (A) offset a using S-mobility. (B) offset a using I-mobility, (C) distance power p using S-mobility, (D) distance power p using I-mobility, (E) population power α using S-mobility, and (F) population power α using I-mobility. Box plots show standard percentiles and outliers, solid lines show global attack rate, and dashed lines show parameter values used in the main result. When fixed, all parameters are as in main result, i.e. a = 0.58, p = 2.72, α = 0.52. Dual mobility are omitted as they are flat with variance σ2 = 0. Empty pixels yield attack rate zero and are omitted from calculations.
Fig 6
Fig 6. Mean attack rate over 100 iterations of stochastic equivalent of main result.
We use (A) S-mobility and (B) I-mobility. 25-, 50- and 75-percentiles are shown for a sample of 100 locations.

References

    1. Hay SI, Snow RW. The malaria Atlas Project: developing global maps of malaria risk. PLoS Med. 2006;3(12):e473 10.1371/journal.pmed.0030473 - DOI - PMC - PubMed
    1. Bhatt S, Weiss DJ, Cameron E, Bisanzio D, Mappin B, Dalrymple U, et al. The effect of malaria control on Plasmodium falciparum in Africa between 2000 and 2015. Nature. 2015;526(7572):207–211. 10.1038/nature15535 - DOI - PMC - PubMed
    1. Charu V, Zeger S, Gog J, Bjørnstad ON, Kissler S, Simonsen L, et al. Human mobility and the spatial transmission of influenza in the United States. PLoS Comput Biol. 2017;13(2):e1005382 10.1371/journal.pcbi.1005382 - DOI - PMC - PubMed
    1. Lessler J, Azman AS, McKay HS, Moore SM. What is a Hotspot Anyway? Am J Trop Med Hyg. 2017;96(6):1270–1273. 10.4269/ajtmh.16-0427 - DOI - PMC - PubMed
    1. Sutton P, Elvidge C, Obremski T. Building and Evaluating Models to Estimate Ambient Population Denstiy. Photogrammetric Engineering and Remote Sensing. 2003;69(5):545–553. 10.14358/PERS.69.5.545 - DOI

Publication types