. 2019 Jun 10;21(6):730-741.
doi: 10.1093/neuonc/noz015.

Modulation of temozolomide dose differentially affects T-cell response to immune checkpoint inhibition

Affiliations

Modulation of temozolomide dose differentially affects T-cell response to immune checkpoint inhibition

Aida Karachi et al. Neuro Oncol. .

Abstract

Background: The changes induced in host immunity and the tumor microenvironment by chemotherapy have been shown to impact immunotherapy response in both a positive and a negative fashion. Temozolomide is the most common chemotherapy used to treat glioblastoma (GBM) and has been shown to have variable effects on immune response to immunotherapy. Therefore, we aimed to determine the immune modulatory effects of temozolomide that would impact response to immune checkpoint inhibition in the treatment of experimental GBM.

Methods: Immune function and antitumor efficacy of immune checkpoint inhibition were tested after treatment with metronomic dose (MD) temozolomide (25 mg/kg × 10 days) or standard dose (SD) temozolomide (50 mg/kg × 5 days) in the GL261 and KR158 murine glioma models.

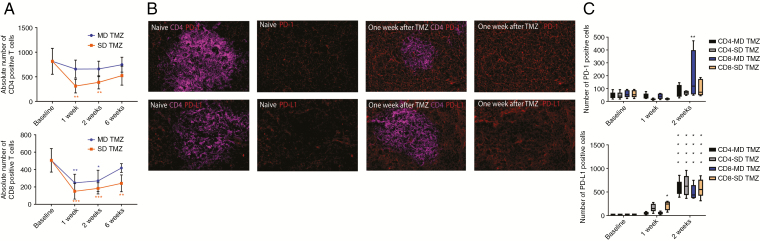
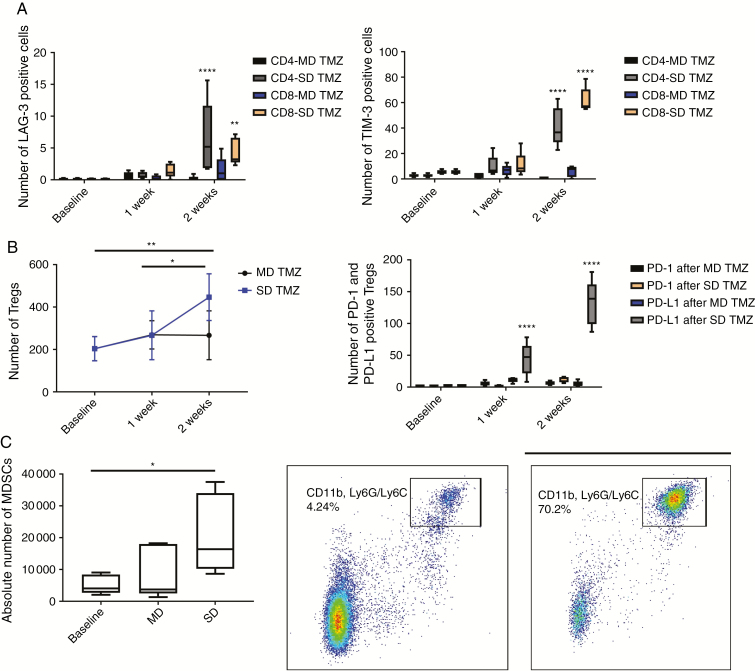
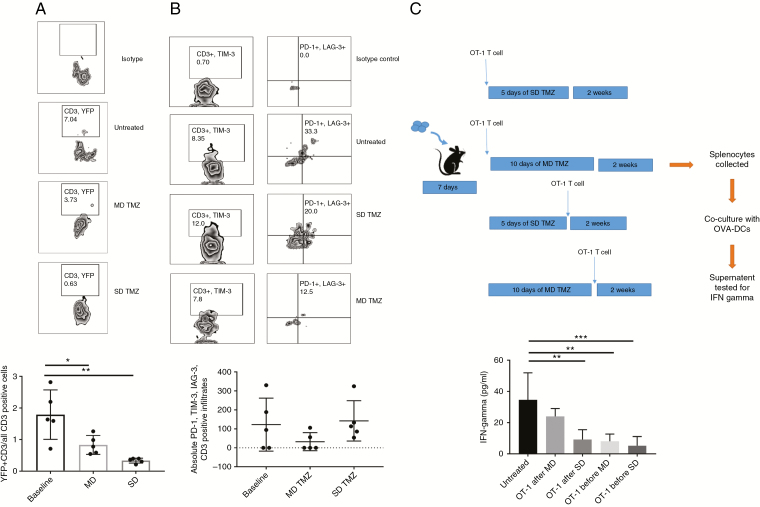
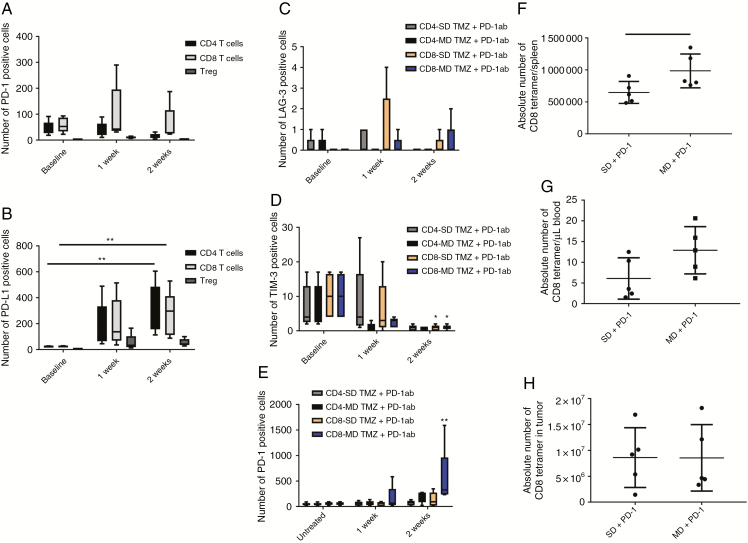
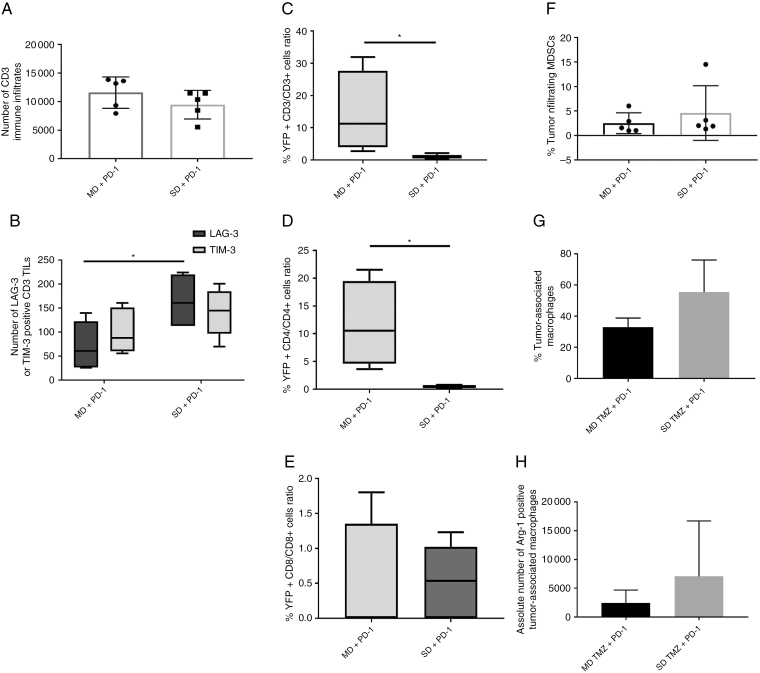
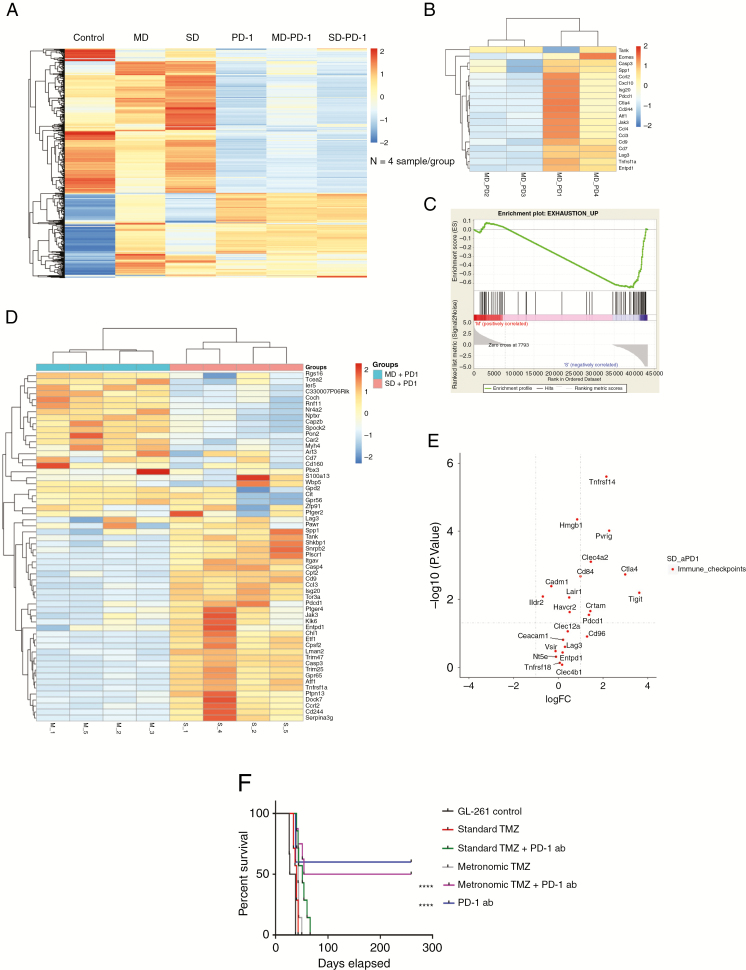
Results: SD temozolomide treatment resulted in an upregulation of markers of T-cell exhaustion such as LAG-3 and TIM-3 in lymphocytes which was not seen with MD temozolomide. When temozolomide treatment was combined with programmed cell death 1 (PD-1) antibody therapy, the MD temozolomide/PD-1 antibody group demonstrated a decrease in exhaustion markers in tumor infiltrating lymphocytes that was not observed in the SD temozolomide/PD-1 antibody group. Also, the survival advantage of PD-1 antibody therapy in a murine syngeneic intracranial glioma model was abrogated by adding SD temozolomide to treatment. However, when MD temozolomide was added to PD-1 inhibition, it preserved the survival benefit that was seen by PD-1 antibody therapy alone.

Conclusion: The peripheral and intratumoral immune microenvironments are distinctively affected by dose modulation of temozolomide.

Keywords: PD-1 antibody; glioblastoma; immune checkpoint inhibition; immunomodulation; temozolomide.


Figures

Fig. 1
Fig. 1
Peripheral blood T-cell counts and PD-1 and PD-L1 expression on T cells after exposure to TMZ. (A) Peripheral blood was collected after animals were treated with SD or MD TMZ for T-cell count using flow cytometry. In the SD group, the mean number of CD4 T-cell count decreased 1 week (2.11-fold), 2 weeks (1.42-fold), and 6 weeks (1.7-fold) compared with the MD group. The mean number of CD8 T-cell count in the SD group decreased at 1 week (1.64-fold), 2 weeks (1.48-fold), and 6 weeks (1.73-fold) compared with the MD group (P < 0.05). In both the SD and MD TMZ groups, lymphopenia was observed in the CD4 and CD8 populations compared with baseline (P < 0.05). (B) Immunofluorescence microscopy of murine spleens after SD treatment showed increased expression of PD-1 and PD-L1 on splenocytes after TMZ exposure compared with the baseline. (C) PD-1 and PD-L1 expression on peripheral blood T cells was evaluated after TMZ treatment using flow cytometry. MD TMZ resulted in a 3.51-fold increase (P < 0.001) of PD-1+/CD8 T cells at 2 weeks without a significant change in PD-1+/CD4 T cells. SD TMZ did not have a significant increase in PD-1+ CD4 or CD8 T cells. MD TMZ resulted in a 21-fold increase in PD-L1+/CD8 T cells and a 27.3-fold increase in PD-L1+/CD4 T cells (P < 0.0001) after 2 weeks. SD TMZ resulted in a 9-fold increase in week 1 of PD-L1+/CD8 T cells, and a 25-fold increase in week 2 of PD-L1+/CD8 T cells (P < 0.0001). There was a 29-fold increase in PD-L1+/CD4 T cells in week 2 (P < 0.0001) without a significant change in week 1. n = 5 per group; baseline = tumor bearing animals without any treatment.
Fig. 2
Fig. 2
Exhaustion markers on peripheral blood T cells and circulatory immunosuppressive cells. LAG-3 and TIM-3 expression on CD4 and CD8 T cells and proportion of Tregs (CD4+ CD25+ FoxP3+) and MDSCs (CD11b+/Ly6G/6c+) were measured in peripheral blood using flow cytometry after TMZ treatment. (A) MD TMZ did not change expression of TIM-3 and LAG-3 on CD4 and CD8 T cells. SD TMZ increased LAG-3+/CD4 (118-fold, P < 0.0001), TIM-3+/CD4 (15-fold, P < 0.0001), LAG-3+/CD8 (104-fold, P = 0.002), and TIM-3+/CD8 T cells (11.6-fold, P < 0.0001). (B) SD TMZ treatment resulted in a relative increase in peripheral blood Tregs (2.3-fold, P = 0.005). MD TMZ did not change the number of Tregs. SD TMZ upregulated PD-L1 expression on Tregs 15.6-fold (P < 0.0001) after 1 week and 47.14-fold (P < 0.0001) after 2 weeks. (C) The mean number of MDSCs increased 4-fold (P = 0.04) 2 weeks after SD TMZ. n = 5 per group; baseline = tumor-bearing animals without any treatment.
Fig. 3
Fig. 3
Peripheral and intratumoral T-cell function in a murine glioma model. (A) IFN-γ expressing CD3 TILs were measured using flow cytometry as a ratio of total CD3 TILs. SD and MD groups had a decrease (5.4-fold, P = 0.0013 and 2.15-fold, P = 0.0222), respectively, in the IFN-γ expressing/YFP+ CD3 TILs compared with the baseline. (B) CD3 TILs were tested for expression of triple exhaustion markers of PD-1, TIM-3, and LAG-3. No significant change was observed among groups. (C) OT-I T cells were infused into tumor-bearing animals before and after MD and SD TMZ treatment. CD3 splenocytes were tested for IFN-γ secretion by enzyme-linked immunosorbent assay. Both SD and MD TMZ significantly decreased IFN-γ secretion when T cells were infused before TMZ treatment. When TMZ was given prior to T-cell infusion, SD TMZ significantly reduced IFN-γ secretion (3.76-fold) from the OT-I T cells compared with untreated animals (P = 0.008). The MD TMZ group had preservation of IFN-γ secretion from OT-I T cells when given prior to T-cell infusion. n = 5 per group; baseline = tumor-bearing animals without any treatment.
Fig. 4
Fig. 4
Evaluation of exhaustion markers on T cells and expansion of T cells after PD-1 antibody or combination treatment. (A) PD-1 antibody treatment did not change PD-1 expression on CD4 and CD8 T cells or Tregs. (B) PD-L1 expression increased on CD4 T cells (14.51-fold, P = 0.002) and CD8 T cells (11.6-fold, P = 0.009) 2 weeks after PD-1 antibody treatment. (C–E) Markers of exhaustion were tested in animals treated with combination PD-1 inhibition and TMZ. LAG-3 expression did not change on CD4 and CD8 T cells when animals were treated with PD-1 antibody in combination with MD or SD TMZ. TIM-3 expression was decreased on CD8 T cells after combination of SD TMZ (9.4-fold) and MD TMZ (9.2-fold) with PD-1 antibody (P = 0.02). MD/PD-1 antibody treatment demonstrated a 9.33-fold increase in the percentage of PD-1+/CD8 T cells 2 weeks after treatment (P = 0.0006). (F) OT-I T cells were infused into B16F10-OVA tumor-bearing mice after SD and MD TMZ treatment in combination with PD-1 antibody. OT-I+/CD8 T cells were significantly more prevalent in the spleens of animals treated with MD TMZ/PD-1 antibody (1.5-fold, P = 0.04) compared with the SD TMZ/PD-1 antibody group. (G) OT-I+/CD8 T cells had a trend for an increase in the blood of animals treated with MD TMZ/PD-1 antibody (2.12-fold). (H) B16F10-OVA intracranial tumors had no difference in the number of CD8 tetramer+ TILs between treatment groups. n = 5 per group; baseline = tumor-bearing animals without any treatment.
Fig. 5
Fig. 5
Intracranial GL261 TILs and immunosuppressive cells after combination treatment of TMZ and PD-1 antibody. (A) No difference in CD3+ TILs was observed between groups treated with SD or MD TMZ/PD-1 antibody. (B) TILs in animals treated with SD TMZ/PD-1 antibody had significantly higher LAG-3 expression (2.3-fold, P = 0.018) compared with MD TMZ/PD-1 animals. There was a trend for increased TIM-3 in the SD TMZ/PD-1 antibody group (1.3-fold P = 0.4) as well. (C–E) GREAT mice underwent GL261 tumor implantation and treatment with TMZ and PD-1 antibody. Activated T cells as measured by YFP expression (IFN-γ expression) were increased within the tumors in the MD/PD-1 antibody group (14-fold YFP+ CD3/CD3 T cells, and 12-fold YFP+ CD4/CD4 T cells, P < 0.05). No differences in the YFP+ CD8 T cells were found between treatment groups (P = 0.8948; F–H). Flow cytometry was performed on intratumoral cells expressing MDSCs (CD11b+/Ly6G/6c+) or macrophages (CD11b+/F480+). The tumor infiltrating MDSCs and macrophages were not different. There was a trend for an increase (5.5-fold, P = 0.07302) in arginase-1 expressing macrophages in the SD/PD1 antibody group. n = 5 per group.
Fig. 6
Fig. 6
NanoString and RNA sequencing for tumor microenvironment and survival analyses. (A) NanoString pan cancer immune profiling was used for evaluation of expression of 770 genes in tumor microenvironment of GL261 tumor bearing animals treated with SD or MD TMZ alone or in combination with PD-1 antibody, PD-1 antibody, or untreated animals. PD-1 antibody treatment groups had significantly different genomic profiles compared with the control and TMZ alone treatment groups. Each column represents an average of 4 animals in the group. (B) The NanoString heat map demonstrated that only half of the MD/PD-1 antibody treated tumors had a significant decrease in genes associated with immune exhaustion. (C) Enrichment plot from RNA sequencing showed a negative enrichment score of exhaustion markers in the GL261 tumors treated with MD TMZ/PD-1 antibody compared with the SD TMZ/PD-1 antibody group (enrichment score: −0.64, FDR q: 0.039, P-value: 0.03). (D) RNA sequencing analysis of MD/PD-1 antibody compared with SD/PD-1 antibody treated tumors demonstrates a significant upregulation of immune exhaustion genes in the SD/PD-1 antibody group. (E) The genomic analysis based on RNA sequencing of immune checkpoint genes demonstrated an increase in the SD TMZ/PD-1 antibody group with no overexpressed immune checkpoint genes in the MD/PD-1 antibody group. n = 4 per group. (F) Both MD and SD TMZ resulted in a modest survival benefit. PD-1 antibody treatment resulted in 50% long-term survivors. When combined with TMZ, the SD group all died (P < 0.0001), but the MD TMZ group showed similar survival benefit as PD-1 antibody alone. n = 4 for NanoString; n = 4 for RNA sequencing; n = 8 for survival analysis.

Comment in

References

    1. Filley AC, Henriquez M, Dey M. Recurrent glioma clinical trial, CheckMate-143: the game is not over yet. Oncotarget. 2017;8(53):91779–91794. - PMC - PubMed
    1. Garon EB, Rizvi NA, Hui R, et al. ; KEYNOTE-001 Investigators Pembrolizumab for the treatment of non-small-cell lung cancer. N Engl J Med. 2015;372(21):2018–2028. - PubMed
    1. Motzer RJ, Escudier B, McDermott DF, et al. ; CheckMate 025 Investigators Nivolumab versus everolimus in advanced renal-cell carcinoma. N Engl J Med. 2015;373(19):1803–1813. - PMC - PubMed
    1. Wolchok JD, Kluger H, Callahan MK, et al. . Nivolumab plus ipilimumab in advanced melanoma. N Engl J Med. 2013;369(2):122–133. - PMC - PubMed
    1. Wang RF, Wang HY. Immune targets and neoantigens for cancer immunotherapy and precision medicine. Cell Res. 2017;27(1):11–37. - PMC - PubMed

Publication types

MeSH terms