. 2019 Apr 23;47(7):3521-3535.
doi: 10.1093/nar/gkz027.

Genome-wide analysis of genomic alterations induced by oxidative DNA damage in yeast

Affiliations

Genome-wide analysis of genomic alterations induced by oxidative DNA damage in yeast

Ke Zhang et al. Nucleic Acids Res. .

Abstract

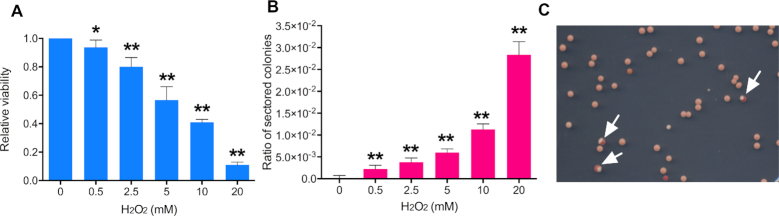
Oxidative DNA damage is a threat to genome stability. Using a genetic system in yeast that allows detection of mitotic recombination, we found that the frequency of crossovers is greatly elevated when cells are treated with hydrogen peroxide (H2O2). Using a combination of microarray analysis and genomic sequencing, we mapped the breakpoints of mitotic recombination events and other chromosome rearrangements at a resolution of about 1 kb. Gene conversions and crossovers were the two most common types of events, but we also observed deletions, duplications, and chromosome aneuploidy. In addition, H2O2-treated cells had elevated rates of point mutations (particularly A to T/T to A and C to G/G to C transversions) and small insertions/deletions (in/dels). In cells that underwent multiple rounds of H2O2 treatments, we identified a genetic alteration that resulted in improved H2O2 tolerance by amplification of the CTT1 gene that encodes cytosolic catalase T. Lastly, we showed that cells grown in the absence of oxygen have reduced levels of recombination. This study provided multiple novel insights into how oxidative stress affects genomic instability and phenotypic evolution in aerobic cells.


Figures

Figure 1.
Figure 1.
Patterns of mitotic recombination. In A–D, we show genetic exchanges in a diploid heterozygous for an insertion of SUP4-o located near the right end of chromosome IV. Red and blue lines indicate the homologs derived from the haploid parental strains W303-1A and YJM789, respectively; the centromeres are shown as ovals and circles. The horizontal rectangles indicate gene conversion tracts; vertical rectangles enclose the daughter cells with recombinant chromosomes. (A) Reciprocal crossover event induced by breaking one chromatid in an S- or G2-phase cell. A 3:1 conversion tract was associated with the crossover. Segregation of the chromatids as indicated by the arrows would produce one cell homozygous for SUP4-o and one cell lacking SUP4-o which would give rise to white and red sectors, respectively. (B) In this figure, the recombination event is initiated by a DSB on an unreplicated chromosome. Replication of the broken chromosome produces two chromatids broken at the same position, and repair of the resulting breaks generates a 4:0 conversion event associated with the crossover. (C) Recombination by break-induced replication. Following a DSB formed on one blue chromatid, the centromere-distal part is lost and the centromere-proximal end invades a red chromatid. The subsequent replication event results in a large non-reciprocal LOH region. (D) Gene conversion unassociated with a crossover.
Figure 2.
Figure 2.
Exposure to H2O2 causes loss of cell viability and elevated mitotic recombination. Experiments were performed three times, and the error bars for the combined experiments represent 95% confidence limits. All values were compared to the values for the untreated strain by t-tests, and significant differences with the untreated strain are shown by single asterisks (P ≤.05) or double asterisks (P ≤.01). (A) Cell viability of yeast strain JSC25-1 after exposure to H2O2 (0.5–20 mM) treatment. Viability is shown relative to an untreated strain. (B) The frequency of crossovers as assayed by the frequency of sectored red/white colonies formed on YPD plates after one-hour treatment with H2O2. The ‘ratio of sectored colonies’ on the Y-axis is the number of sectored colonies divided by the total colonies. (C) An example of colonies derived from cells treated with 20 mM H2O2. Arrows show sectored colonies.
Figure 3.
Figure 3.
Mapping of a crossover with an associated conversion event by SNP microarrays. The values on the Y-axis show the normalized hybridization ratio (HR) of genomic DNA to oligonucleotides that are specific to SNPs from the W303-1A and YJM789 backgrounds. The values on the X-axis indicate the SGD coordinates of the SNPs along chromosome IV. The hybridization ratio values about 0.3, 1, 1.5 represent zero, one, and two copies of W303-1A- (red points or lines) or YJM789- (blue points or lines) derived homolog. (A) Low-resolution depiction of a reciprocal crossover analyzed by the SNP microarrays in the red sector. (B) Low-resolution depiction of a reciprocal crossover analyzed by the SNP microarrays in the white sector. (C) High-resolution depiction of the reciprocal crossover shown in A. (D) High-resolution depiction of the reciprocal crossover shown in B. (E) Schematic depiction of the crossover event. The upper and lower lines represent the red and white sectors, respectively. The green, red, and black segments indicate heterozygous SNPs, homozygous for W303-1A-specific SNPs, and homozygous for YJM789-specific SNPs, respectively. The region between three short dashed lines shows a 3:1/4:0 conversion tract associated with this crossover event.
Figure 4.
Figure 4.
Detection of H2O2 induced chromosome breaks by gel electrophoresis. The strain used in this study (YYy123) had a circular derivative of chromosome III and a LEU2 insertion on both III and chromosome II. (A) Cells were treated with various concentrations of H2O2 (0–20 mM), and examined by CHEF gels as described in the Materials and Methods section. The left panel shows the ethidium bromide-stained gel with Roman numerals indicating the approximate locations of various yeast chromosomes. Following electrophoresis, the chromosomal DNA was transferred to membranes and hybridized to a LEU2-specific probe (right panel). (B) Cell-free samples of DNA embedded in agarose plugs were treated with for one hour with various concentrations of H2O2, and then examined by gel electrophoresis as in A. The numbers at the bottom of the gel are the calculated numbers of DSBs per genome.
Figure 5.
Figure 5.
Characterization of genomic alterations induced by multiple treatments with H2O2 in non-synchronized cells by using whole-genome SNP microarrays. As described in the text, following 20 treatments with H2O2, we examined 30 independent isolates using whole-genome microarrays. (A) Numbers of mitotic recombination and aneuploidy events among the 30 isolates. CON, CO/BIR, DEL/DUP, and PLOIDY designations signify conversions unassociated with crossovers, crossovers or BIR events (which cannot be distinguished except in sectored colonies), deletions or duplications, and changes in chromosome number, respectively. (B) Amount of DNA (in kb) per isolate that experienced LOH, or a change in gene dosage for various categories of genomic alterations. (C) Number of events per chromosome (sum of categories shown in A) as a function of chromosome length. (D) Distribution of LOH and duplication/deletion events across the yeast genome. In this figure, we show interstitial deletion/duplication and terminal deletion/duplication events separately. Centromeres are shown as black ovals, and SNPs are shown as yellow vertical lines.
Figure 6.
Figure 6.
Chromosomal alterations leading to H2O2 tolerance in JSC25-1 isolates exposed to multiple cycles of H2O2. (A) The H2O2-tolerance of JSC25-1 and JSC25-1-derived isolates obtained after 20 generations of subculture was measured as described in the text. We used SNP microarrays to examine genomic changes in the most tolerant strain (HOS5). 95% confidence limits on each viability measurement are shown. An asterisk indicates that the viability for the HOS5 strain is significantly (P < 0.05) greater than that of the wild-type strain by a t-test. (B) Patterns of gene dosage and LOH on chromosome VII. The hybridization ratio indicates that HOS5 had three copies of chromosome VII. Two had the same size as the wild-type copy of VII and contained primarily YJM789-derived SNPs. The third copy had multiple internal duplications, had lost sequences distal to SGD coordinate 733890, and had acquired sequences from chromosome XI. (C) This microarray shows a region of XI that was transferred to chromosome VII, likely by a BIR event. (D) Depictions of the chromosomes that contain VII-derived sequences in HOS5. Red and blue indicate that the sequences were derived from W303-1A and YJM789, respectively. Purple shows the region derived from chromosome XI. The lengths of the various segments are not drawn to scale. (E) Gel analysis and Southern blot analysis of JSC25, the parental haploid strains W303-1A and YJM789, and HOS5. The probe used for the Southern hybridization was CTT1. (F) Resistance of yeast cells to killing by H2O2 is a function of the number of copies of CTT1. We show the viability of cells (normalized to the wild-type diploid JSC25) exposed to 200 mM H2O2 for 1 h. The CTT1 copy numbers for the various isogenic strains are: 2 (JSC25), 5 (HOS5), 4 (HOd1), 3 (HOd2), 2 (HOd3), 1 (HOd4) and 0 (HOd5). By t-tests, the viability of strains HOS5, HOd1, and HOd2 were significantly greater than for the wild-type strain JSC25 (single asterisks and double asterisks, indicating P values < 0.05 and 0.01, respectively). The viabilities of strains HOd3, HOd4, and HOd5 were significantly less than JSC25.
Figure 7.
Figure 7.
Contribution of oxidative stress to spontaneous mitotic recombination. The frequency of crossovers between CEN4 and URA3 on chromosome IV was measured by determining the frequency of 5-FOA-resistant colonies for strain DZ5 and isogenic derivatives. Bars show 95% confidence limits. In comparisons of these values (by t-tests), single asterisks and double asterisks indicate P values less than 0.05 and 0.01, respectively. (A) Growth of yeast under anaerobic conditions resulted in a two-fold reduction of spontaneous crossovers in DZ5 relative to cells grown aerobically. (B) Addition of glutathione to the growth medium (YPD) reduced the frequency of spontaneous crossovers. (C) Frequency of crossovers in wild-type (DZ5), ctt1 (QL11), cta1 (QL12), and sod1 (QL14) strains grown aerobically. (D) Frequency of crossovers in the same strains examined in C, but grown anaerobically. None of the frequencies in Figure 7D were significantly from that observed for DZ5 or from each other.

Similar articles

Cited by

References

    1. Finkel T., Holbrook N.J.. Oxidants, oxidative stress and the biology of ageing. Nature. 2000; 408:239. - PubMed
    1. Herrero E., Ros J., Bellí G., Cabiscol E.. Redox control and oxidative stress in yeast cells. BBA-Gen. Subj. 2008; 1780:1217–1235. - PubMed
    1. Mizutani T., Sumida H., Sagawa Y., Okano Y., Masaki H.. ROS generation from the stratum corneum under UV irradiation. J. Dermatol. Sci. 2016; 84:e78–e79. - PubMed
    1. Fedoseeva I.V., Pyatrikas D.V., Stepanov A.V., Fedyaeva A.V., Varakina N.N., Rusaleva T.M., Borovskii G.B., Rikhvanov E.G.. The role of flavin-containing enzymes in mitochondrial membrane hyperpolarization and ROS production in respiring Saccharomyces cerevisiae cells under heat-shock conditions. Sci. Rep. 2017; 7:2586. - PMC - PubMed
    1. Rai P., Parrish M., Tay I.J.J., Li N., Ackerman S., He F., Kwang J., Chow V.T., Engelward B.P.. Streptococcus pneumoniae secretes hydrogen peroxide leading to DNA damage and apoptosis in lung cells. Proc. Natl. Acad. Sci. U.S.A. 2015; 112:E3421–E3430. - PMC - PubMed

Publication types

MeSH terms