

Sleep and cognitive aging in the eighth decade of life
- PMID: 30668819
- PMCID: PMC6448287
- DOI: 10.1093/sleep/zsz019
Sleep and cognitive aging in the eighth decade of life
Abstract
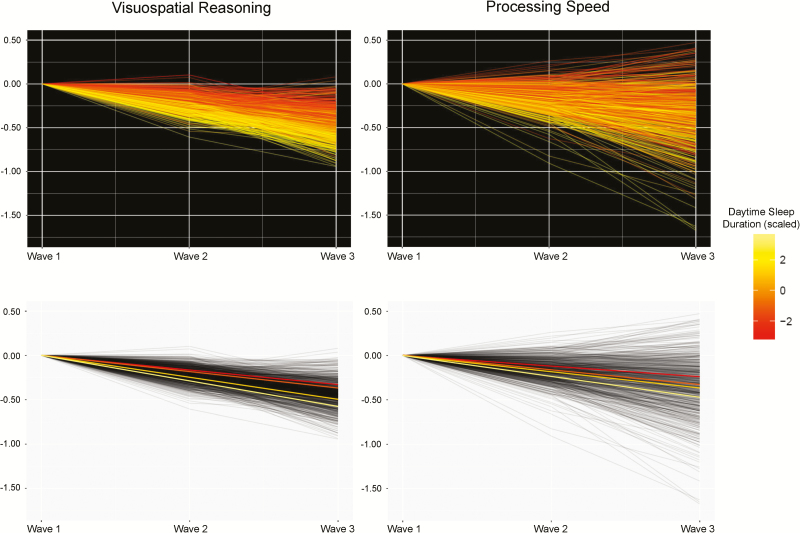
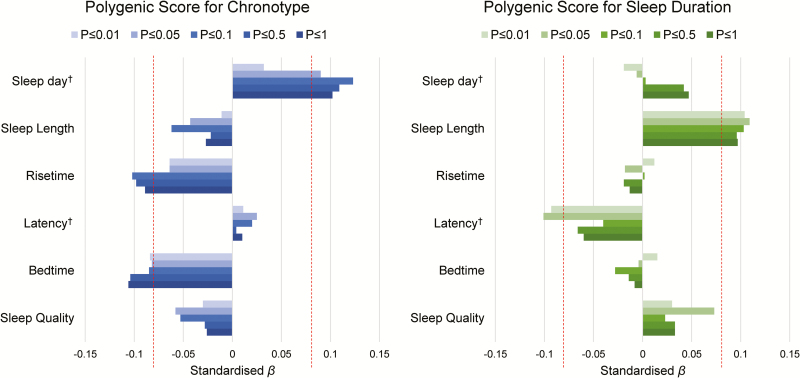
We examined associations between self-reported sleep measures and cognitive level and change (age 70-76 years) in a longitudinal, same-year-of-birth cohort study (baseline N = 1091; longitudinal N = 664). We also leveraged GWAS summary data to ascertain whether polygenic scores (PGS) of chronotype and sleep duration related to self-reported sleep, and to cognitive level and change. Shorter sleep latency was associated with significantly higher levels of visuospatial ability, processing speed, and verbal memory (β ≥ |0.184|, SE ≤ 0.075, p ≤ 0.003). Longer daytime sleep duration was significantly associated slower processing speed (β = -0.085, SE = 0.027, p = 0.001), and with steeper 6-year decline in visuospatial reasoning (β = -0.009, SE = 0.003, p = 0.008), and processing speed (β = -0.009, SE = 0.002, p < 0.001). Only longitudinal associations between longer daytime sleeping and steeper cognitive declines survived correction for important health covariates and false discovery rate (FDR). PGS of chronotype and sleep duration were nominally associated with specific self-reported sleep characteristics for most SNP thresholds (standardized β range = |0.123 to 0.082|, p range = 0.003 to 0.046), but neither PGS predicted cognitive level or change following FDR. Daytime sleep duration is a potentially important correlate of cognitive decline in visuospatial reasoning and processing speed in older age, whereas cross-sectional associations are partially confounded by important health factors. A genetic propensity toward morningness and sleep duration were weakly, but consistently, related to self-reported sleep characteristics, and did not relate to cognitive level or change.
Keywords: cognitive aging; daytime sleep; polygenic scores.
© Sleep Research Society 2019. Published by Oxford University Press [on behalf of the Sleep Research Society].
Figures
References
-
- Ohayon MM, et al. . Meta-analysis of quantitative sleep parameters from childhood to old age in healthy individuals: developing normative sleep values across the human lifespan. Sleep. 2004;27(7):1255–1273. - PubMed
-
- Hara C, et al. . Prevalence of excessive daytime sleepiness and associated factors in a Brazilian community: the Bambuí study. Sleep Med. 2004;5(1):31–36. - PubMed
-
- Hayley AC, et al. . Prevalence of excessive daytime sleepiness in a sample of the Australian adult population. Sleep Med. 2014;15(3):348–354. - PubMed
Publication types
MeSH terms
Grants and funding
- MR/K026992/1/BB_/Biotechnology and Biological Sciences Research Council/United Kingdom
- MR/R024065/1/MRC_/Medical Research Council/United Kingdom
- MR/S015132/1/MRC_/Medical Research Council/United Kingdom
- G0701120/MRC_/Medical Research Council/United Kingdom
- MR/M013111/1/MRC_/Medical Research Council/United Kingdom
LinkOut - more resources
Full Text Sources
Medical
