. 2019 Jan 21;11(2):303-327.
doi: 10.18632/aging.101684.

DNA methylation GrimAge strongly predicts lifespan and healthspan

Affiliations

DNA methylation GrimAge strongly predicts lifespan and healthspan

Ake T Lu et al. Aging (Albany NY). .

Abstract

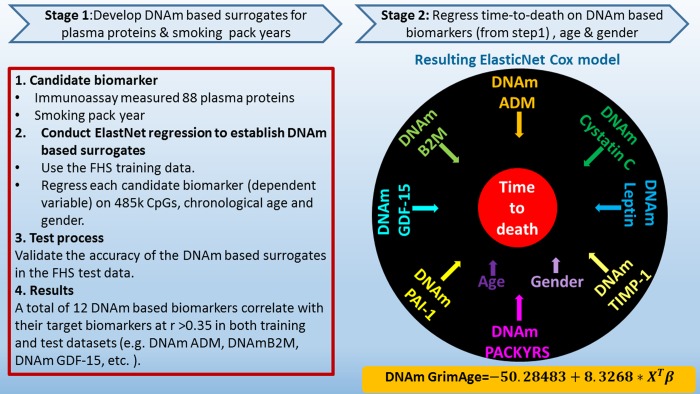
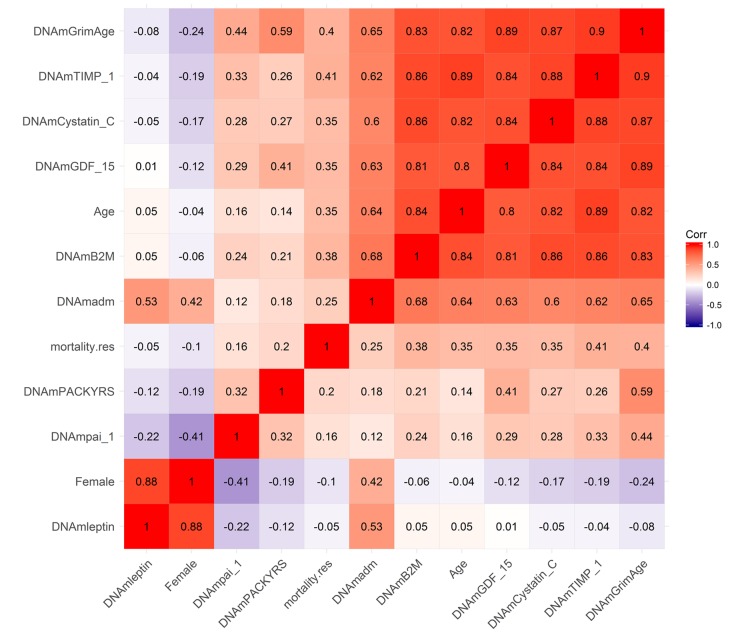
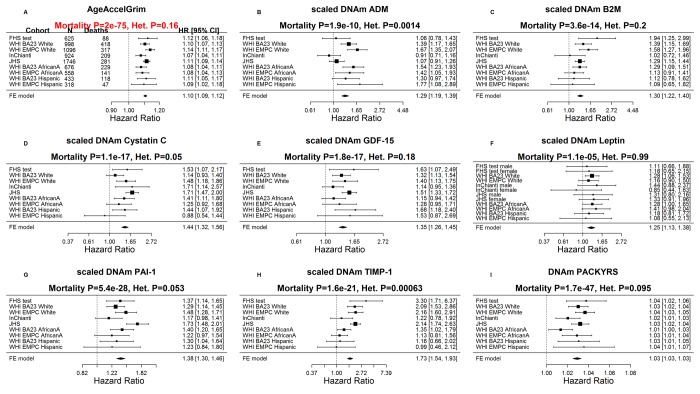
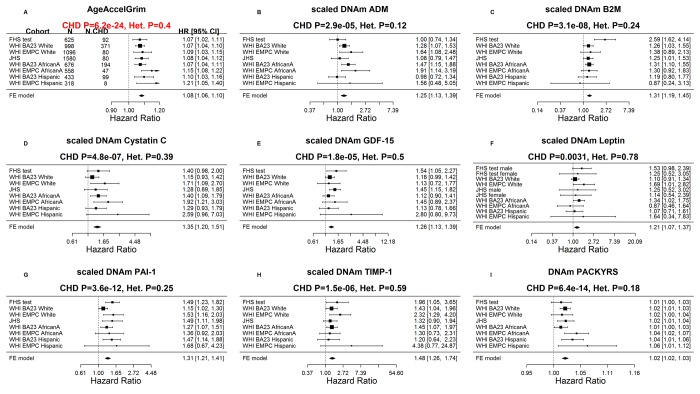
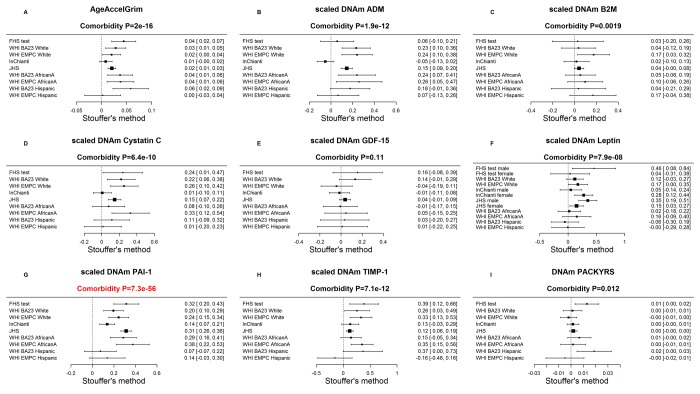
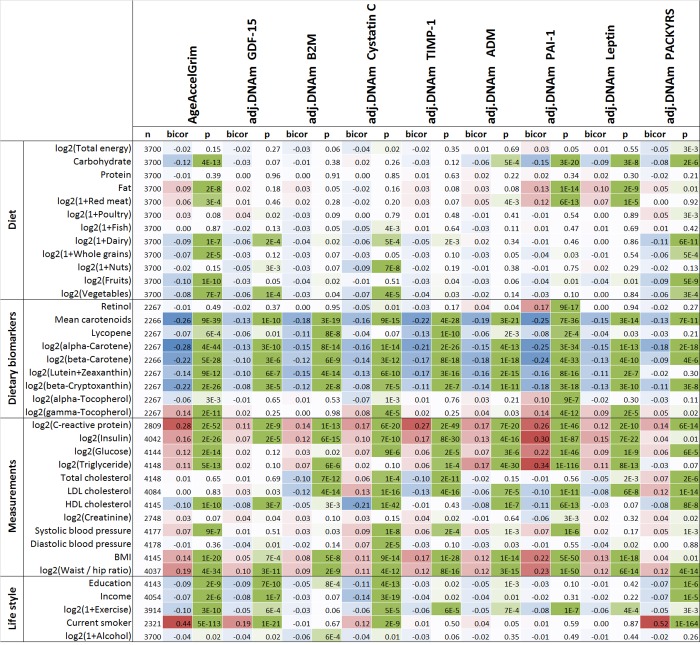
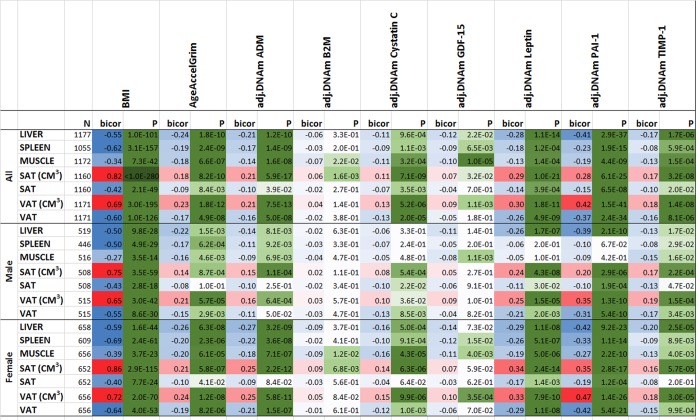
It was unknown whether plasma protein levels can be estimated based on DNA methylation (DNAm) levels, and if so, how the resulting surrogates can be consolidated into a powerful predictor of lifespan. We present here, seven DNAm-based estimators of plasma proteins including those of plasminogen activator inhibitor 1 (PAI-1) and growth differentiation factor 15. The resulting predictor of lifespan, DNAm GrimAge (in units of years), is a composite biomarker based on the seven DNAm surrogates and a DNAm-based estimator of smoking pack-years. Adjusting DNAm GrimAge for chronological age generated novel measure of epigenetic age acceleration, AgeAccelGrim.Using large scale validation data from thousands of individuals, we demonstrate that DNAm GrimAge stands out among existing epigenetic clocks in terms of its predictive ability for time-to-death (Cox regression P=2.0E-75), time-to-coronary heart disease (Cox P=6.2E-24), time-to-cancer (P= 1.3E-12), its strong relationship with computed tomography data for fatty liver/excess visceral fat, and age-at-menopause (P=1.6E-12). AgeAccelGrim is strongly associated with a host of age-related conditions including comorbidity count (P=3.45E-17). Similarly, age-adjusted DNAm PAI-1 levels are associated with lifespan (P=5.4E-28), comorbidity count (P= 7.3E-56) and type 2 diabetes (P=2.0E-26). These DNAm-based biomarkers show the expected relationship with lifestyle factors including healthy diet and educational attainment.Overall, these epigenetic biomarkers are expected to find many applications including human anti-aging studies.

Keywords: DNA methylation; epigenetics; mortality; proteomics.


Conflict of interest statement

CONFLICTS OF INTEREST: The Regents of the University of California is the sole owner of a provisional patent application directed at this invention for which ATL and SH are named inventor.

Figures

Figure 1
Figure 1
Flowchart for developing DNAm GrimAge. Surrogate DNAm-based biomarkers for smoking pack-years and plasma protein levels were defined and validated using training and test data from the Framingham Heart study (stage 1). Only 12 out of 88 plasma proteins exhibited a correlation r >0.35 with their respective DNAm-based surrogate marker in the test data. In stage 2, time-to-death (due to all-cause mortality) was regressed on chronological age, sex, and DNAm-based biomarkers of smoking pack-years and the 12 above mentioned plasma protein levels. The elastic net regression model automatically selected the following covariates: chronological age (Age), sex (Female), and DNAm based surrogates for smoking pack-years (DNAm PACKYRS), adrenomedullin levels (DNAm ADM), beta-2 microglobulin (DNAm B2M), cystatin C (DNAm Cystatin C), growth differentiation factor 15 (DNAm GDF-15), leptin (DNAm Leptin), plasminogen activation inhibitor 1 (DNAm PAI-1), tissue inhibitor metalloproteinase 1 (DNAm TIMP-1). The linear combination of the covariate values XTβ was linearly transformed to be in units of years. Technically speaking, DNAm GrimAge is a mortality risk estimator. Metaphorically speaking, it estimates biological age.
Figure 2
Figure 2
Heat map of pairwise correlations of DNAm based biomarkers. The heat map color-codes the pairwise Pearson correlations of select variables (surrounding the definition of DNAm GrimAge) in the test data from the Framingham Heart Study (N=625). DNAm GrimAge is defined as a linear combination of chronological age (Age), sex (Female takes on the value 1 for females and 0 otherwise), and eight DNAm-based surrogate markers for smoking pack-years (DNAm PACKYRS), adrenomedullin levels (DNAm ADM), beta-2 microglobulin (DNAm B2M), cystatin C (DNAm Cystatin C), growth differentiation factor 15 (DNAm GDF-15), leptin (DNAm Leptin), plasminogen activation inhibitor 1 (DNAm PAI-1), issue inhibitor metalloproteinase 1 (DNAm TIMP-1). The figure also includes an estimator of mortality risk, mortality.res, which can be interpreted as a measure of "excess" mortality risk compared to the baseline risk in the test data. Formally, mortality.res is defined as the deviance residual from a Cox regression model for time-to-death due to all-cause mortality. The rows and columns of the Figure are sorted according to a hierarchical clustering tree. The shades of color (blue, white, and red) visualize correlation values from -1 to 1. Each square reports a Pearson correlation coefficient.
Figure 3
Figure 3
Meta analysis forest plots for predicting time-to-death due to all-cause mortality. Each panel reports a meta-analysis forest plot for combining hazard ratios predicting time-to-death based on a DNAm-based biomarker (reported in the figure heading) across different strata formed by racial group within cohort. (A) Results for AgeAccelGrim. Each row reports a hazard ratio (for time-to-death) and a 95% confidence interval resulting from a Cox regression model in each of 9 strata (defined by cohort and racial groups). Results for (age-adjusted) DNAm-based surrogate markers of (B) adrenomedullin (ADM), (C) beta-2 microglobulin (B2M), (D) cystatin C (Cystatin C), (E) growth differentiation factor 15 (GDF-15), (F) leptin, (G) plasminogen activation inhibitor 1 (PAI-1), (H) tissue inhibitor metalloproteinase 1 (TIMP-1) and (I) smoking pack-years (PACKYRS). The sub-title of each panel reports the meta-analysis p-value and a p-value for a test of heterogeneity Cochran Q test (Het.). (A) Each hazard ratio (HR) corresponds to a one-year increase in AgeAccelGrim. (B-H) Each hazard ratio corresponds to an increase in one-standard deviation. (I) Hazard ratios correspond to a 1 year increase in pack-years. The most significant meta-analysis P value (here AgeAccelGrim) is marked in red. A non-significant Cochran Q test p-value is desirable because it indicates that the hazard ratios do not differ significantly across the strata. For example, the hazard ratios associated with AgeAccelGrim exhibit insignificant heterogeneity across the strata (Cochran Q test PI2=0.16).
Figure 4
Figure 4
Meta analysis forest plots for predicting time-to-coronary heart disease. Each panel reports a meta-analysis forest plot for combining hazard ratios predicting time to CHD and the DNAm-based biomarker (reported in the figure heading) across different strata formed by racial groups within cohorts. (A) Results for AgeAccelGrim. Each row reports a hazard ratio (for time-to-CHD) and a 95% confidence interval resulting from a Cox regression model in each of 9 strata (defined by cohort and racial groups). Results for (age adjusted) DNAm-based surrogate markers of (B) adrenomedullin (ADM), (C) beta-2 microglobulin (B2M), (D) cystatin C (Cystatin C), (E) growth differentiation factor 15 (GDF-15), (F) leptin, (G) plasminogen activation inhibitor 1 (PAI-1), (H) tissue inhibitor metalloproteinase 1 (TIMP-1) and (I) smoking pack-years (PACKYRS). The sub-title of each panel reports the meta-analysis p-value and a p-value for a test of heterogeneity Cochran Q test (Het.). (A) Each hazard ratio (HR) corresponds to a one-year increase in AgeAccelGrim. (B-H) Each hazard ratio corresponds to an increase in one-standard deviation. (I) Hazard ratios correspond to a one unit increased in DNAm pack-years. The most significant meta-analysis P value (here AgeAccelGrim) is marked in red.
Figure 5
Figure 5
Meta-analysis of associations with total number of age-related conditions. Each panel reports a meta-analysis forest plot for combining regression coefficients between the comorbidity index and the DNAm-based biomarker (reported in the figure heading) across different strata, which are formed by racial group within cohort. (A) Meta analysis of the regression slope between AgeAccelGrim and the comorbidity index. Analogous results for (age-adjusted) DNAm based surrogate markers of (B) adrenomedullin (ADM), (C) beta-2 microglobulin (B2M), (D) cystatin C (Cystatin C), (E) growth differentiation factor 15 (GDF-15), (F) leptin, (G) plasminogen activation inhibitor 1 (PAI-1), (H) tissue inhibitor metalloproteinase 1 (TIMP-1) and (I) smoking pack-years (PACKYRS). The individual study results were combined using fixed effect meta-analysis (reported in the panel heading). Cochran Q test for heterogeneity across studies (Het.). The effect sizes correspond to one year of age acceleration in panel A, one pack-year in panel I and one standard deviation in other panels for DNAm proteins. The estimate with the most significant meta P value is marked in red.
Figure 6
Figure 6
Cross sectional correlations between DNAm biomarkers and lifestyle factors. Robust correlation coefficients (biweight midcorrelation [62]) between 1) AgeAccelGrim and its eight age-adjusted underlying DNAm-based surrogate biomarkers and 2) 38 variables including self-reported diet, 9 dietary biomarkers, 12 variables related to metabolic traits and central adiposity, and 5 life style factors. The 2-color scale (blue to red) color-codes bicor correlation coefficients in the range [-1, 1]. The green color scale (light to dark) applied to unadjusted P values. The analysis was performed on the WHI cohort in up to 4200 postmenopausal women. An analogous analysis stratified by race/ethnicity can be found in Supplementary Fig. 30.
Figure 7
Figure 7
Computed tomography variables versus with body mass index and age-adjusted DNAm biomarkers in the FHS. The columns correspond to BMI, AgeAccelGrim and age-adjusted DNAm surrogates of plasma proteins. The rows correspond to computed tomography-derived organ density measures (Hounsfield units) or volumetric measures for subcutaneous adipose tissue (SAT CM3) or visceral adipose tissue (VAT CM3). The columns report the available sample size (n) in the FHS, the robust correlation coefficient (bicor, based on the biweight midcorrelation coefficient [62]). To avoid confounding by pedigree structure, we computed the p-value using a linear mixed effect model (pedigree as random effect). The bicor correlation coefficients are color-coded (blue to red) across its range of [-1, 1]. P-values are color-coded in green (light to dark green scale). We applied the correlation analysis to males and females, respectively, and then combined the results via fixed effect models weighted by inverse variance (listed in the top rows, denoted as “ALL”).

References

    1. Horvath S. DNA methylation age of human tissues and cell types. Genome Biol. 2013; 14:R115. 10.1186/gb-2013-14-10-r115 - DOI - PMC - PubMed
    1. Hannum G, Guinney J, Zhao L, Zhang L, Hughes G, Sadda S, Klotzle B, Bibikova M, Fan JB, Gao Y, Deconde R, Chen M, Rajapakse I, et al.. Genome-wide methylation profiles reveal quantitative views of human aging rates. Mol Cell. 2013; 49:359–67. 10.1016/j.molcel.2012.10.016 - DOI - PMC - PubMed
    1. Lin Q, Weidner CI, Costa IG, Marioni RE, Ferreira MR, Deary IJ, Wagner W. DNA methylation levels at individual age-associated CpG sites can be indicative for life expectancy. Aging (Albany NY). 2016; 8:394–401. 10.18632/aging.100908 - DOI - PMC - PubMed
    1. Horvath S, Oshima J, Martin GM, Lu AT, Quach A, Cohen H, Felton S, Matsuyama M, Lowe D, Kabacik S, Wilson JG, Reiner AP, Maierhofer A, et al.. Epigenetic clock for skin and blood cells applied to Hutchinson Gilford Progeria Syndrome and ex vivo studies. Aging (Albany NY). 2018; 10:1758–75. 10.18632/aging.101508 - DOI - PMC - PubMed
    1. Marioni RE, Shah S, McRae AF, Chen BH, Colicino E, Harris SE, Gibson J, Henders AK, Redmond P, Cox SR, Pattie A, Corley J, Murphy L, et al.. DNA methylation age of blood predicts all-cause mortality in later life. Genome Biol. 2015; 16:25. 10.1186/s13059-015-0584-6 - DOI - PMC - PubMed

Publication types