. 2019 Jan 21;20(2):438.
doi: 10.3390/ijms20020438.

Gut Microbiota and Predicted Metabolic Pathways in a Sample of Mexican Women Affected by Obesity and Obesity Plus Metabolic Syndrome

Affiliations

Gut Microbiota and Predicted Metabolic Pathways in a Sample of Mexican Women Affected by Obesity and Obesity Plus Metabolic Syndrome

Alejandra Chávez-Carbajal et al. Int J Mol Sci. .

Abstract

Obesity is an excessive fat accumulation that could lead to complications like metabolic syndrome. There are reports on gut microbiota and metabolic syndrome in relation to dietary, host genetics, and other environmental factors; however, it is necessary to explore the role of the gut microbiota metabolic pathways in populations like Mexicans, where the prevalence of obesity and metabolic syndrome is high. This study identify alterations of the gut microbiota in a sample of healthy Mexican women (CO), women with obesity (OB), and women with obesity plus metabolic syndrome (OMS). We studied 67 women, characterizing their anthropometric and biochemical parameters along with their gut bacterial diversity by high-throughput DNA sequencing. Our results indicate that in OB or OMS women, Firmicutes was the most abundant bacterial phylum. We observed significant changes in abundances of bacteria belonging to the Ruminococcaceae, Lachnospiraceae, and Erysipelotrichaceae families and significant enrichment of gut bacteria from 16 different taxa that might explain the observed metabolic alterations between the groups. Finally, the predicted functional metagenome of the gut microbiota found in each category shows differences in metabolic pathways related to lipid metabolism. We demonstrate that Mexican women have a particular bacterial gut microbiota characteristic of each phenotype. There are bacteria that potentially explain the observed metabolic differences between the groups, and gut bacteria in OMS and OB conditions carry more genes of metabolic pathways implicated in lipid metabolism.

Keywords: 16S rDNA; Mexican women; gut microbiota; high-throughput DNA sequencing; ion torrent; metabolic syndrome; obesity.


Conflict of interest statement

The authors declare no conflict of interest.

Figures

Figure 1
Figure 1
Bacterial phyla abundance. The figure shows circle charts of the relative abundance of relevant bacterial phyla in the three phenotypic categories. (A) Control; (B) obesity, and (C) obesity + metabolic syndrome. Phyla are identified by colors as indicated underneath the charts. Others includes phyla such as Verrucomicrobia, Spirochaetes, and Fusobacteria. Numbers are the relative abundance in percentage. Solid line and asterisk indicate a significant difference in the relative abundances for the phylum Firmicutes between the control and obesity + metabolic syndrome.
Figure 2
Figure 2
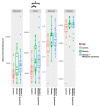
Bacterial alpha diversity. The box-plot figures show the alpha diversity of the bacterial communities in the three study groups Control, OB, and OMS by means of observed Operational Taxonomic Units (OTUs), and Chao1, Shannon, and Simpson indexes. Plotted in the graphic are the interquartile ranges (IQRs) and boxes, medians (lines in the boxes), and lowest and highest values for the first and third quartiles. Each phenotypic category is identified by colors, as indicated on the right side of the figure. Every sample is represented by a colored dot. Solid lines and asterisks indicate a significant difference between control and obesity (lower), (p < 0.002), and control and obesity + metabolic syndrome (upper) (p < 0.003). P-values were calculated to compares alpha diversities based on a two-sample t-test using a non-parametric methods and the default number of Monte Carlo permutations in order to find different significances among groups (see Table S9).
Figure 3
Figure 3
Bacterial beta diversity. The Figure shows a three-dimensional scatter plot, generated using principal coordinates analysis (PCoA) from Unweighted UniFrac analyses, showing the distance of microbial communities among women with normal weight (red spheres), women with obesity (green spheres), and obesity + metabolic syndrome (blue spheres). Each group is identified by colors as indicated on the right side of the figure. The p-value was calculated using ANOSIM method to compare beta diversities between each category in all samples, and between each category in a sub-sample controlled by age, using a distance matrix as the primary input and mapping file. Control, obesity, and obesity + metabolic syndrome have significant differences in all samples (p-value 0.01), and in a sub-sample controlled by age (p-value 0.02; see Table S10).
Figure 4
Figure 4
Linear discriminant analysis Effect Size (LEfSe) for the bacterial communities. The LEfSe plot shows enriched bacterial families and genera significantly associated with the three phenotypic categories. Seven bacteria were enriched in the control group (red), three bacteria in the obesity group (green), and six bacteria in the obesity + metabolic syndrome group (blue). The Linear Discriminant Analysis (LDA) score or effect size is shown at logarithmic scale underneath the bars. Each group is identified by color on top of the figure.
Figure 5
Figure 5
Comparative prediction of the functional metagenome of the gut bacterial microbiota. The figure shows a graphic representation of the significant predicted metabolic pathways using PICRUSt by analysis of the corresponding OTU table generated by QIIME for the bacterial communities. The Y-axis shows the relative frequencies of gene content prediction, and the X-axis shows the control (red), obesity (green) and obesity + metabolic syndrome (blue) categories. *, indicates significant difference among groups (see Table S4).

References

    1. World Health Organization Obesity 2017 [Web Page] [(accessed on 20 November 2018)]; Available online: http://www.who.int/topics/obesity/en/
    1. Martin-Rodriguez E., Guillen-Grima F., Martí A., Brugos-Larumbe A. Comorbidity associated with obesity in a large population: The APNA study. Obes. Res. Clin. Pract. 2015;9:435–447. doi: 10.1016/j.orcp.2015.04.003. - DOI - PubMed
    1. Di Cesare M., Bentham J., Stevens G.A., Zhou B., Danaei G., Lu Y., Bixby H., Cowan M.J., Riley L.M., Hajifathalian K., et al. Trends in adult body-mass index in 200 countries from 1975 to 2014: A pooled analysis of 1698 population-based measurement studies with 19.2 million participants. Lancet. 2016;387:1377–1396. doi: 10.1016/S0140-6736(16)30054-X. - DOI - PMC - PubMed
    1. Encuesta Nacional de Salud y Nutrición de Medio Camino 2016. [(accessed on 20 November 2018)]; Available online: https://www.gob.mx/cms/uploads/attachment/file/209093/ENSANUT.pdf.
    1. Meldrum D.R., Morris M.A., Gambone J.C. Obesity pandemic: Causes, consequences, and solutions—But do we have the will? Fertil. Steril. 2017;107:833–839. doi: 10.1016/j.fertnstert.2017.02.104. - DOI - PubMed

Substances