Review
. 2019 Jan 21;20(2):449.
doi: 10.3390/ijms20020449.

Bactericidal and Cytotoxic Properties of Silver Nanoparticles

Affiliations
Review

Bactericidal and Cytotoxic Properties of Silver Nanoparticles

Chengzhu Liao et al. Int J Mol Sci. .

Abstract

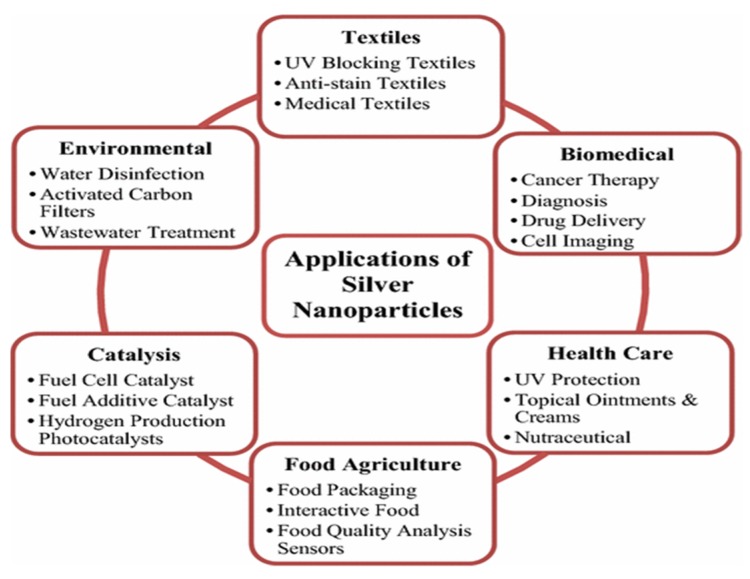
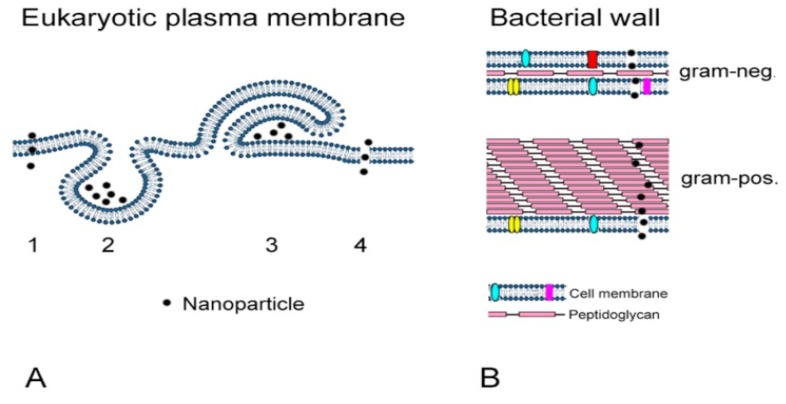
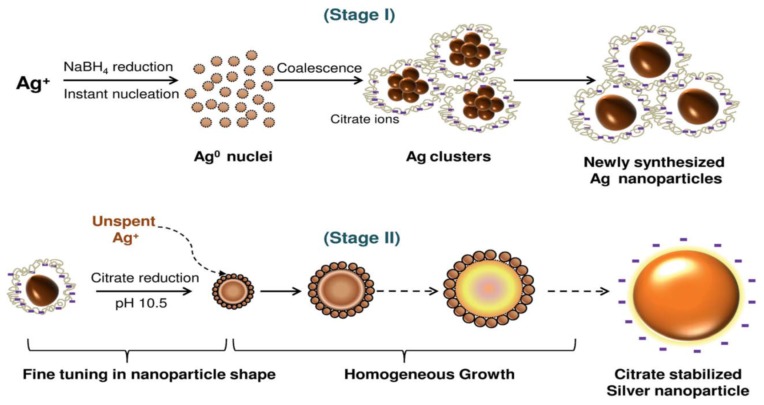
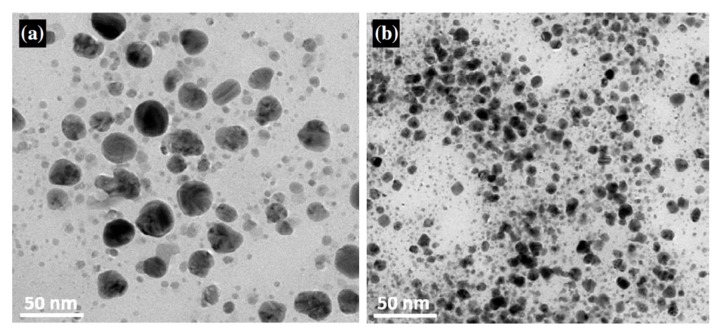
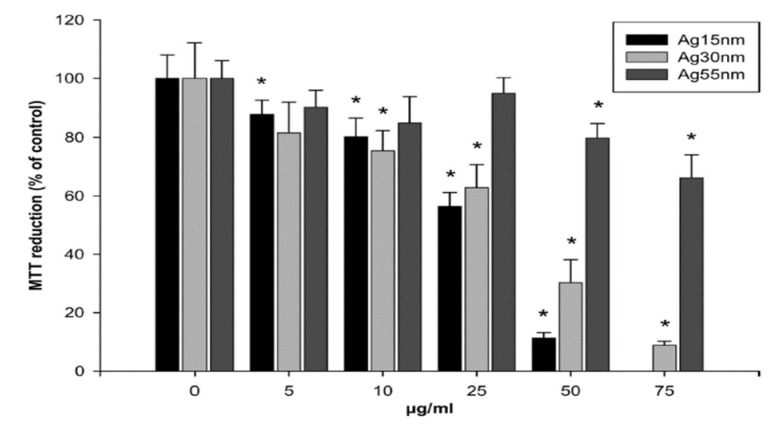
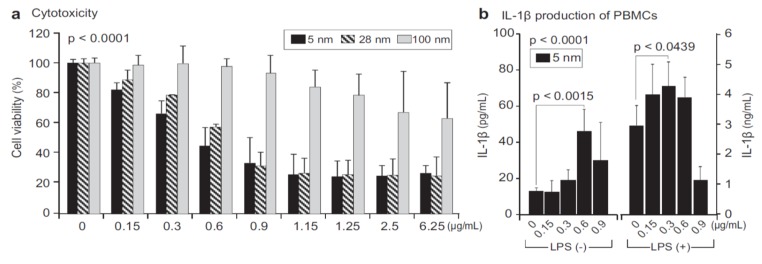
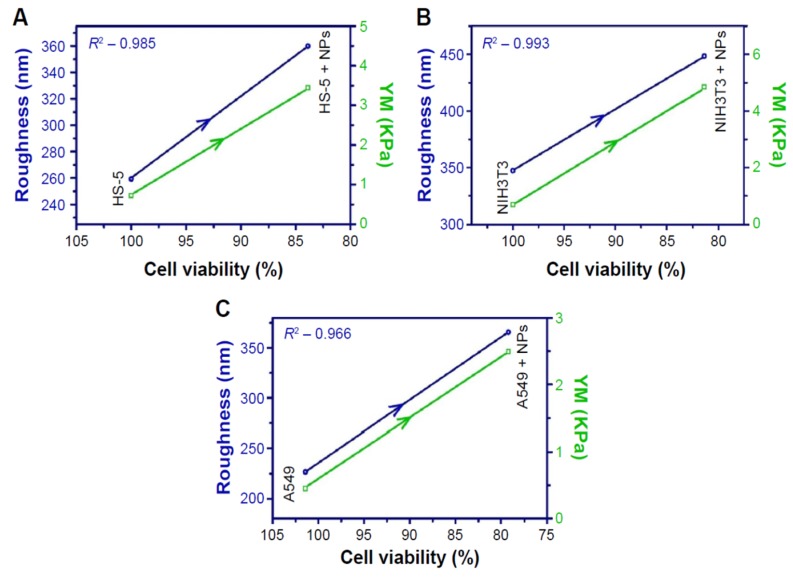
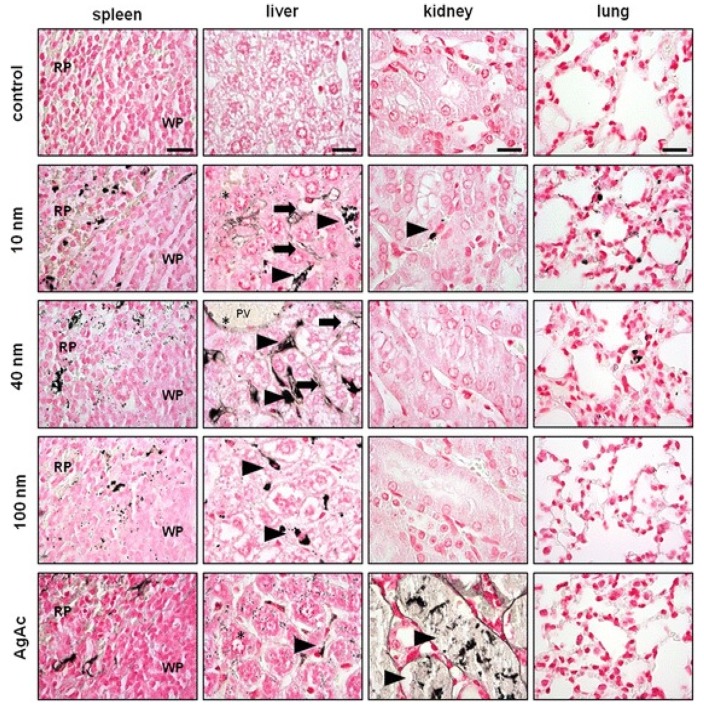
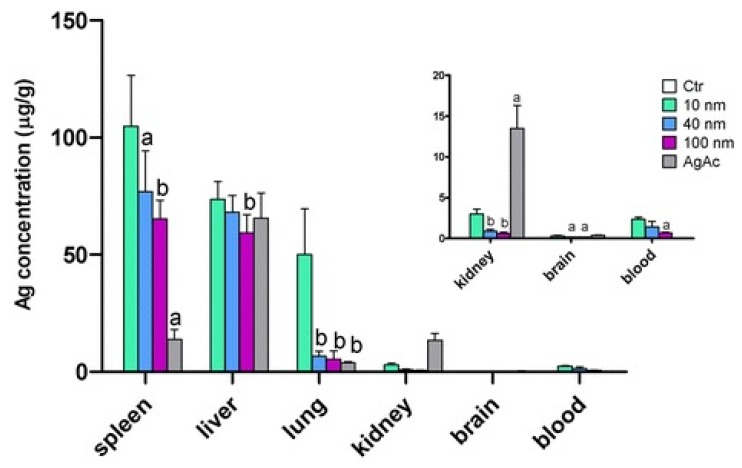
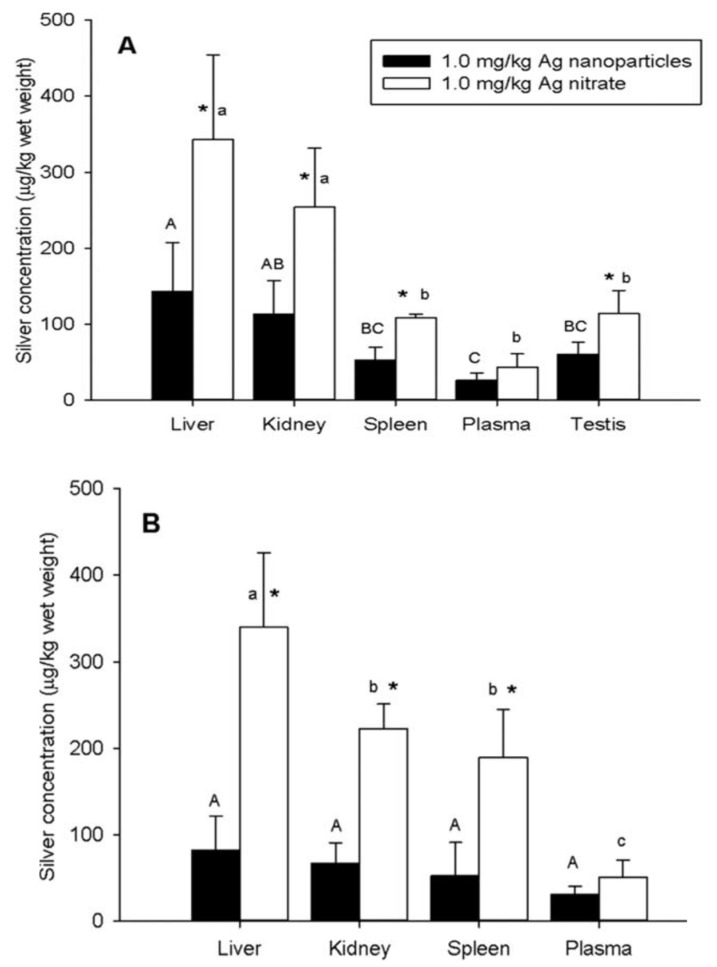
Silver nanoparticles (AgNPs) can be synthesized from a variety of techniques including physical, chemical and biological routes. They have been widely used as nanomaterials for manufacturing cosmetic and healthcare products, antimicrobial textiles, wound dressings, antitumor drug carriers, etc. due to their excellent antimicrobial properties. Accordingly, AgNPs have gained access into our daily life, and the inevitable human exposure to these nanoparticles has raised concerns about their potential hazards to the environment, health, and safety in recent years. From in vitro cell cultivation tests, AgNPs have been reported to be toxic to several human cell lines including human bronchial epithelial cells, human umbilical vein endothelial cells, red blood cells, human peripheral blood mononuclear cells, immortal human keratinocytes, liver cells, etc. AgNPs induce a dose-, size- and time-dependent cytotoxicity, particularly for those with sizes ≤10 nm. Furthermore, AgNPs can cross the brain blood barrier of mice through the circulation system on the basis of in vivo animal tests. AgNPs tend to accumulate in mice organs such as liver, spleen, kidney and brain following intravenous, intraperitoneal, and intratracheal routes of administration. In this respect, AgNPs are considered a double-edged sword that can eliminate microorganisms but induce cytotoxicity in mammalian cells. This article provides a state-of-the-art review on the synthesis of AgNPs, and their applications in antimicrobial textile fabrics, food packaging films, and wound dressings. Particular attention is paid to the bactericidal activity and cytotoxic effect in mammalian cells.

Keywords: administration route; bacteria; cell culture; cytotoxicity; food packaging; membrane; polymer nanocomposite; reactive oxygen species; silver ion; wound dressing.


Conflict of interest statement

The authors declare no conflict of interest.

Figures

Figure 1
Figure 1
Applications of AgNPs. Reproduced from [22], Springer Open.
Figure 2
Figure 2
Uptake of AgNPs by mammalian cells (A) and by bacteria (B). (A) AgNPs can cross the plasma membrane by diffusion (1), endocytotic uptake (2,3), and disruption of membrane integrity (4). (B) AgNPs permeate the cell walls of gram-negative and gram-positive bacteria. Reproduced from [36], MDPI under the Creative Commons Attribution License.
Figure 3
Figure 3
Schematic representation of size-controlled AgNPs synthesis employing the co-reduction strategy. Reproduced from [41], the Royal Society of Chemistry.
Figure 4
Figure 4
TEM images of AgNPs formed at (a) pH 6, and (b) pH 12. (c) High-resolution TEM image and (d) selected area electron diffraction pattern of AgNP. Reproduced from [82] with permission of Elsevier.
Figure 4
Figure 4
TEM images of AgNPs formed at (a) pH 6, and (b) pH 12. (c) High-resolution TEM image and (d) selected area electron diffraction pattern of AgNP. Reproduced from [82] with permission of Elsevier.
Figure 5
Figure 5
Graphical representation of AgNPs synthesis with Eucalyptus globulus leaf extract (ELE) and silver nitrate depicting scheme-I (without microwave treatment) and scheme-II with microwave irradiation. Reproduced from [106] with permission of Public Library of Science.
Figure 6
Figure 6
Dissolved Ag+ concentration vs. air exposure time for PEG-AgNPs with sizes of 5 and 11 nm under aerobic conditions. No Ag+ ions can be detected (<1 μg/L) under anaerobic conditions. Reproduced from [147] with permission of the American Chemical Society.
Figure 7
Figure 7
Bactericidal mechanisms of AgNPs due to their direct contact with the bacterial cell wall and the release of silver ions. Reproduced from [154] with permission of Elsevier.
Figure 8
Figure 8
Disk diffusion assay results for AgNPs of various sizes against E. coli. The zone of inhibition is highlighted with a dashed circle indicating a noticeable antibacterial effect. Reproduced from [41], the Royal Society of Chemistry.
Figure 9
Figure 9
Killing kinetics of K. pneumoniae AWD5 exposed to (A) spherical AgNPs at concentrations of 184–207 μg/mL and (B) rod-shaped AgNPs at 320–720 μg/mL. Results were expressed as means ± SD; n = 3. p < 0.05 was considered statistically significant. Reproduced from [161], Nature Company under the Creative Commons Attribution License.
Figure 10
Figure 10
Assessment of antibacterial activity of ELE and ELE-AgNPs by disk diffusion assay. Reproduced from [106] with permission of Public Library of Science.
Figure 11
Figure 11
(Left): Effect of AgNPs concentration on bacterial cell viability. Bacterial survival was determined at 24 h based on a colony-forming unit (CFU) count assay. (Right): Time-dependent bactericidal effect of AgNPs on P. aeruginosa and S. aureus. Results were expressed as means ± SD; n = 3. p < 0.05 was considered statistically significant. Reproduced from [107], MDPI under the Creative Commons Attribution License.
Figure 12
Figure 12
Effects of AgNPs on ROS (left panel) and MDA (right panel) levels. Results were expressed as means ± SD of n = 3; p < 0.05 was considered statistically significant as compared to control (con) groups. Reproduced from [107], MDPI under the Creative Commons Attribution License.
Figure 13
Figure 13
Anti-biofilm behavior of AgNPs on P. melaninogenica and A. pyogenes. (Left): Bacterial strains were treated with AgNPs of different concentrations. (Right): Bacterial strains were incubated with 0.8 and 1.0 μg/mL of AgNPs, respectively, for 24 h. p < 0.05 was considered statistically significant as compared to control groups. Reproduced from [38], MDPI under the Creative Commons Attribution License.
Figure 14
Figure 14
Percentage of bacterial reduction (E. coli and S. aureus) as a function of the size of AgNPs after exposure of 1 day and 30 days. Data are presented as mean values ± SD (n = 3). Reproduced from [137] with permission of the American Chemical Society.
Figure 15
Figure 15
Viable counts in the challenge test on apple peels with L. monocytogenes versus silver nitrate aqueous solution (black square), EVOH (circle), and EVOH composite films with 0.1 wt% Ag+ (diamond), 1 wt% Ag+ (square), and 10 wt% Ag+(triangle). Reproduced from [175] with permission of the American Chemical Society.
Figure 16
Figure 16
(a) Inhibition zones of all samples exposed to S. aureus, E. coli and C. albicans. There is a significant difference between the levels indicated by arrows, * p < 0.05. (b) Cell viability of mouse fibroblasts after 24 h incubation with nanocomposite hydrogels. CVDE (cell density), NR (membrane integrity assay) and XTT (mitochondrial activity). ‘Control’ is the negative control, whereas ‘latex’ is the positive control. Reproduced from [184] with permission of the Royal Society Publishing.
Figure 17
Figure 17
Proposed mechanisms of (a) AgNPs- and (b) silver ion-induced cytotoxicity. Reproduced from [190] and [192] with permission of BioMed Central Ltd and Elsevier, respectively.
Figure 18
Figure 18
(AC) Cell viability vs AgNP concentration for 16HBE, HUVECs and HepG2 cells determined from CCK-8 assay at different time points. (D) Inductively coupled plasma mass spectrometry results showing cellular uptake of AgNPs upon exposure at a dose of 2 mg/cm2 AgNPs for 24 h. Data are expressed as means ± SD, n = 5. Reproduced from [206] with permission of Elsevier.
Figure 19
Figure 19
(A) Cell viability and (B) membrane damage of HBEC5i, HUVEC and EA.hy926 cells vs AgNPs concentrations after 24 h exposure to nanoparticles. Data are presented as means ± SD. * p < 0.05; ** p < 0.01; **** p < 0.0001. Reproduced from [59] with permission of Elsevier.
Figure 20
Figure 20
Dose-and time-dependent ROS generation in HepG2 cells exposed to AgNPs in: (A) deionized water and (B) cell culture medium. Data are expressed as means ± SD. There was significant difference between the treated and control groups (* p < 0.05; ** p < 0.01), and between the 24- and 48-h groups (# p < 0.05). Reproduced from [194] with permission of Wiley.
Figure 21
Figure 21
Dose-and time-dependent MMP reduction of HepG2 cells exposed to AgNPs in (A) deionized water and (B) cell culture medium. Data are expressed as means ± SD. There was significant difference between the treated and control groups (* p < 0.05; ** p < 0.01), and between the 24- and 48-h groups (# p < 0.05). Reproduced from [194] with permission of Wiley.
Figure 22
Figure 22
(a) Schematic representation showing size-dependent hemolysis of RBCs due to AgNPs. (b) Percentage hemolysis vs AgNPs concentrations. TEM images of RBCs (c) without and (d) with AgNPs (15 nm) treatment. Individual AgNP in (d) is outlined with a red circle, while AgNPs are aggregate using black arrows. Reproduced from [213] with permission of the American Chemical Society.
Figure 22
Figure 22
(a) Schematic representation showing size-dependent hemolysis of RBCs due to AgNPs. (b) Percentage hemolysis vs AgNPs concentrations. TEM images of RBCs (c) without and (d) with AgNPs (15 nm) treatment. Individual AgNP in (d) is outlined with a red circle, while AgNPs are aggregate using black arrows. Reproduced from [213] with permission of the American Chemical Society.
Figure 23
Figure 23
Effect of AgNPs concentration on mitochondrial metabolism (MTT assay) in murine alveolar macrophages treated with AgNPs for 24 h. The data were expressed as means ± SD (n = 3). p < 0.05 was considered significant. Reproduced from [215] with permission of the American Chemical Society.
Figure 24
Figure 24
Cytotoxicity and IL-1β generation in PBMCs. (a) PBMCs were treated with AgNPs for 6 h and cell viability was determined with CCK-8 assay. (b) PBMCs were treated with AgNPs (5 nm) for 6 h and supernatant levels of IL-1β were assessed by ELISA. LPS (50 pg/mL) was pre-treated for 2 h before AgNPs exposure. Results were presented as means ± SD. One-way ANOVA analysis showed significance (p < 0.0001) (a,b), and Student’s t-test between certain pairs (b) was used for statistical analysis. Reproduced from [216] with permission of Elsevier.
Figure 25
Figure 25
Correlation between cell viability and the roughness or stiffness of (A) HS-5, (B) NIH3T3 and (C) A549 cells before and after treatment with AgNPs. NP: nanoparticles; Y. M.: Young’s modulus. Reproduced from [226] with permission of Dove Medical Press Ltd.
Figure 26
Figure 26
Histological examination of silver tissue localization by autometallography staining. Representative images of spleen, liver, kidney, and lung (scale bar = 20 μm), from AgNPs (10, 40, 100 nm) and silver acetate treated mice. In the spleen, silver was localized within the cytoplasm of macrophages especially in the spleen white pulp (WP) and red pulp (RP). Triangles indicate the accumulation of silver in organ tissues. Reproduced from [229], BioMed Central Ltd under the Creative Commons Attribution License.
Figure 27
Figure 27
Silver tissue concentration after i.v. injection of AgNPs and AgAc in mice. Data are expressed as means ± SD. The inset illustrates a magnified view showing Ag concentration in the kidney, brain, and blood. Statistical significance: a = p < 0.05; b = p < 0.01. Reproduced from [229], BioMed Central Ltd under the Creative Commons Attribution License.
Figure 28
Figure 28
Silver concentrations in major organs and plasma of (A) male and (B) female rats. Values are presented as means ± SD, n = 5. The asterisk (*) indicates significant difference between AgNPs and AgNO3 treatment groups at p < 0.05. Means with the same capital letters are not significantly different among AgNPs groups (p < 0.05) and same small letter are not statistically different among AgNO3 groups by the Tukey test (p < 0.05). Reproduced from [238] with permission of Wiley.

References

    1. Tjong S.C., Chen H. Nanocrystalline materials and coatings. Mater. Sci. Eng. R Rep. 2004;45:1–88. doi: 10.1016/j.mser.2004.07.001. - DOI
    1. He L.X., Tjong S.C. Aqueous graphene oxide-dispersed carbon nanotubes as inks for the scalable production of all-carbon transparent conductive films. J. Mater. Chem. C. 2016;4:7043–7051. doi: 10.1039/C6TC01224H. - DOI
    1. He L.X., Tjong S.C. Nanostructured transparent conductive films: Fabrication, characterization and applications. Mater. Sci. Eng. R Rep. 2016;109:1–101. doi: 10.1016/j.mser.2016.08.002. - DOI
    1. He L., Liao C., Tjong S.C. Scalable fabrication of high-performance transparent conductors using graphene oxide-stabilized single-walled carbon nanotube inks. Nanomaterials. 2018;8:224. doi: 10.3390/nano8040224. - DOI - PMC - PubMed
    1. Liu C., Shen J., Yeung K.W.K., Tjong S.C. Development and antibacterial performance of novel polylactic acid-graphene oxide-silver nanoparticle hybrid nanocomposite mats prepared by electrospinning. ACS Biomater. Sci. Eng. 2017;3:471–486. doi: 10.1021/acsbiomaterials.6b00766. - DOI - PubMed