

Low-intensity pulsed ultrasound promotes chondrogenesis of mesenchymal stem cells via regulation of autophagy
- PMID: 30670079
- PMCID: PMC6343259
- DOI: 10.1186/s13287-019-1142-z
Low-intensity pulsed ultrasound promotes chondrogenesis of mesenchymal stem cells via regulation of autophagy
Abstract
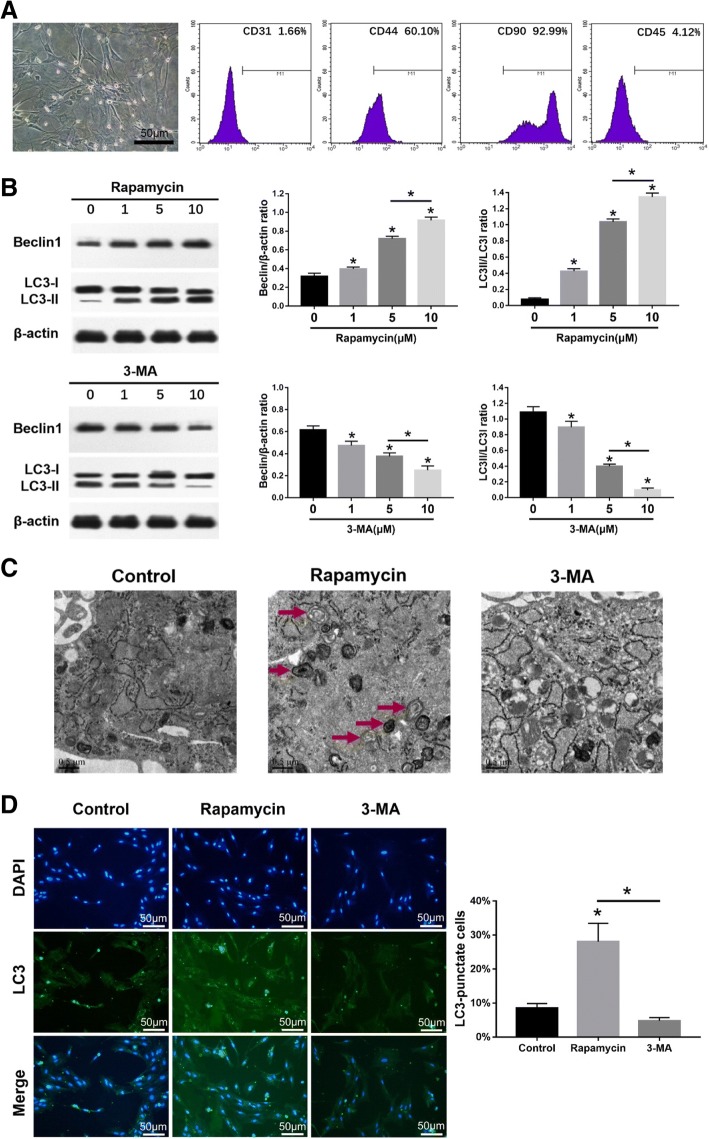
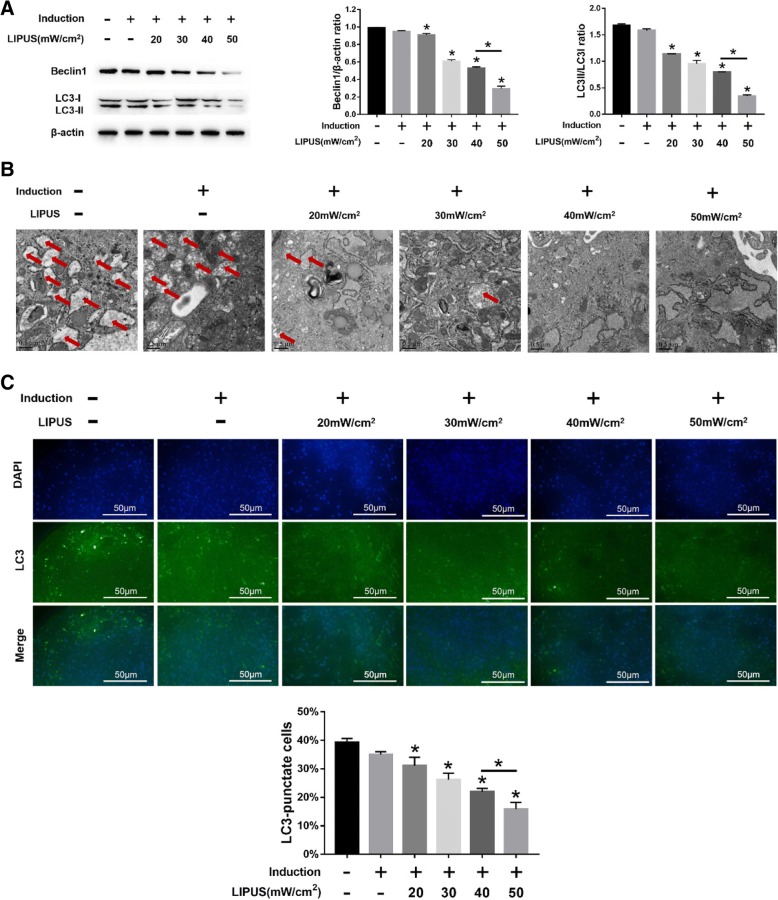
Background: Low-intensity pulsed ultrasound (LIPUS) can induce mesenchymal stem cell (MSC) differentiation, although the mechanism of its potential effects on chondrogenic differentiation is unknown. Since autophagy is known to regulate the differentiation of MSCs, the aim of our study was to determine whether LIPUS induced chondrogenesis via autophagy regulation.
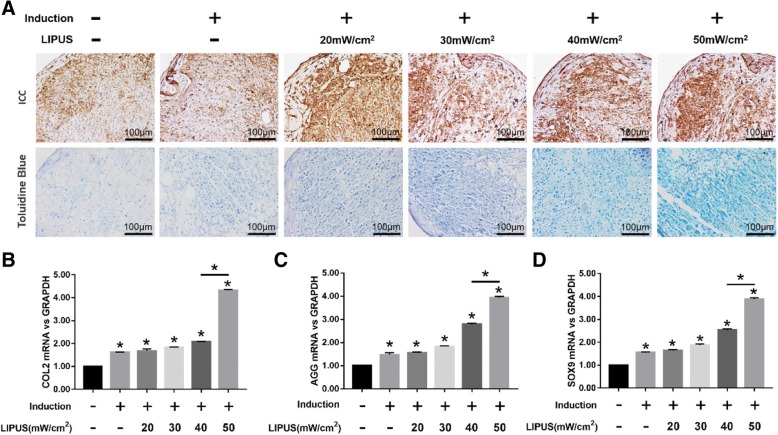
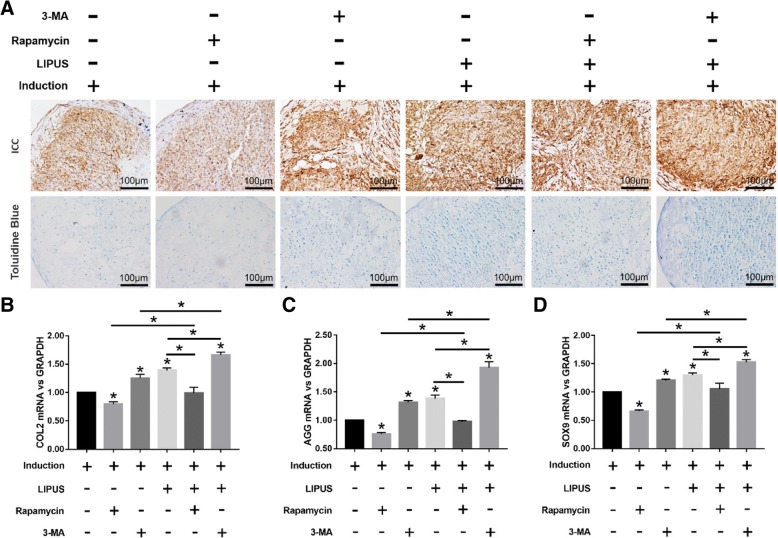
Methods: MSCs were isolated from the rat bone marrow, cultured in either standard or chondrogenic medium, and stimulated with 3 MHz of LIPUS given in 20% on-off cycles, with or without prior addition of an autophagy inhibitor or agonist. Chondrogenesis was evaluated on the basis of aggrecan (AGG) organization and the amount of type II collagen (COL2) and the mRNA expression of AGG, COL2, and SRY-related high mobility group-box gene 9 (SOX9) genes.
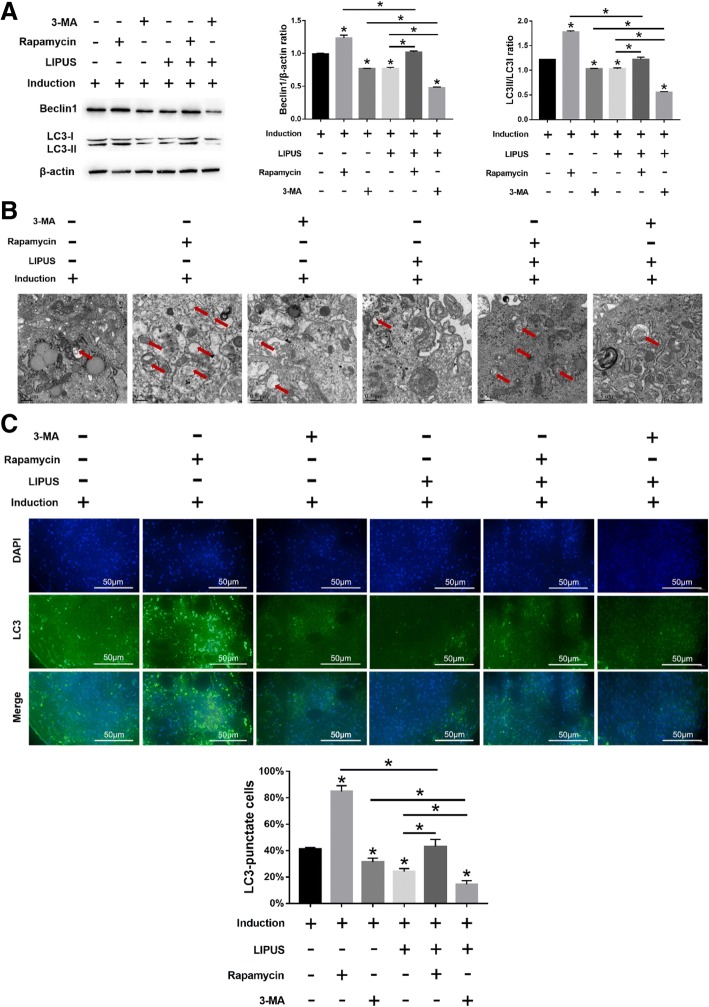
Results: LIPUS promoted the chondrogenic differentiation of MSCs, as shown by the changes in the extracellular matrix (ECM) proteins and upregulation of chondrogenic genes, and these effects were respectively augmented and inhibited by the autophagy inhibitor and agonist.
Conclusions: Taken together, these results indicate that LIPUS promotes MSC chondrogenesis by inhibiting autophagy.
Keywords: Autophagy; Chondrogenesis; Low-intensity pulsed ultrasound (LIPUS); Mesenchymal stem cells (MSCs).
Conflict of interest statement
Authors’ information
All the authors are researchers at Department of Rehabilitation Medicine, Nanjing First Hospital, Nanjing Medical University, China. Peng Xia and Xueping Li are the leaders of our research group.
Ethics approval and consent to participate
The experimental protocol relating to rats was approved by the Nanjing Medical University Ethics Committee of Nanjing Hospital (20150829).
Consent for publication
Not applicable.
Competing interests
The authors declare that they have no competing interests.
Publisher’s Note
Springer Nature remains neutral with regard to jurisdictional claims in published maps and institutional affiliations.
Figures
Similar articles
-
TGF-β1-induced chondrogenesis of bone marrow mesenchymal stem cells is promoted by low-intensity pulsed ultrasound through the integrin-mTOR signaling pathway.Stem Cell Res Ther. 2017 Dec 13;8(1):281. doi: 10.1186/s13287-017-0733-9. Stem Cell Res Ther. 2017. PMID: 29237506 Free PMC article.
-
Low-Intensity Pulsed Ultrasound Promotes Autophagy-Mediated Migration of Mesenchymal Stem Cells and Cartilage Repair.Cell Transplant. 2021 Jan-Dec;30:963689720986142. doi: 10.1177/0963689720986142. Cell Transplant. 2021. PMID: 33412895 Free PMC article.
-
Low-intensity pulsed ultrasound promotes mesenchymal stem cell transplantation-based articular cartilage regeneration via inhibiting the TNF signaling pathway.Stem Cell Res Ther. 2023 Apr 17;14(1):93. doi: 10.1186/s13287-023-03296-6. Stem Cell Res Ther. 2023. PMID: 37069673 Free PMC article.
-
Advances in the application of low-intensity pulsed ultrasound to mesenchymal stem cells.Stem Cell Res Ther. 2022 May 26;13(1):214. doi: 10.1186/s13287-022-02887-z. Stem Cell Res Ther. 2022. PMID: 35619156 Free PMC article. Review.
-
Impact of Ultrasound Therapy on Stem Cell Differentiation - A Systematic Review.Curr Stem Cell Res Ther. 2020;15(5):462-472. doi: 10.2174/1574888X15666200225124934. Curr Stem Cell Res Ther. 2020. PMID: 32096749
Cited by
-
Low-Intensity Pulsed Ultrasound Enhances the Efficacy of Bone Marrow-Derived MSCs in Osteoarthritis Cartilage Repair by Regulating Autophagy-Mediated Exosome Release.Cartilage. 2022 Apr-Jun;13(2):19476035221093060. doi: 10.1177/19476035221093060. Cartilage. 2022. PMID: 35438034 Free PMC article.
-
The Role of Extracellular Vesicles in the Pathogenesis, Diagnosis, and Treatment of Osteoarthritis.Molecules. 2021 Aug 17;26(16):4987. doi: 10.3390/molecules26164987. Molecules. 2021. PMID: 34443573 Free PMC article. Review.
-
The effect of low intensity pulsed ultrasound on mandibular condylar growth in young adult rats.Bone Rep. 2021 Sep 3;15:101122. doi: 10.1016/j.bonr.2021.101122. eCollection 2021 Dec. Bone Rep. 2021. PMID: 34527791 Free PMC article.
-
Research Progress of Osteoarthritis Treatment by Low Intensity Pulsed Ultrasound.Smart Med. 2025 May 16;4(2):e70003. doi: 10.1002/smmd.70003. eCollection 2025 Jun. Smart Med. 2025. PMID: 40390768 Free PMC article. Review.
-
Gelatin reduced Graphene Oxide Nanosheets as Kartogenin Nanocarrier Induces Rat ADSCs Chondrogenic Differentiation Combining with Autophagy Modification.Materials (Basel). 2021 Feb 24;14(5):1053. doi: 10.3390/ma14051053. Materials (Basel). 2021. PMID: 33668133 Free PMC article.
References
Publication types
MeSH terms
LinkOut - more resources
Full Text Sources
Research Materials
