. 2019 Mar 4;218(3):993-1010.
doi: 10.1083/jcb.201805099. Epub 2019 Jan 22.

Cul4 ubiquitin ligase cofactor DCAF12 promotes neurotransmitter release and homeostatic plasticity

Affiliations

Cul4 ubiquitin ligase cofactor DCAF12 promotes neurotransmitter release and homeostatic plasticity

Lilian A Patrón et al. J Cell Biol. .

Abstract

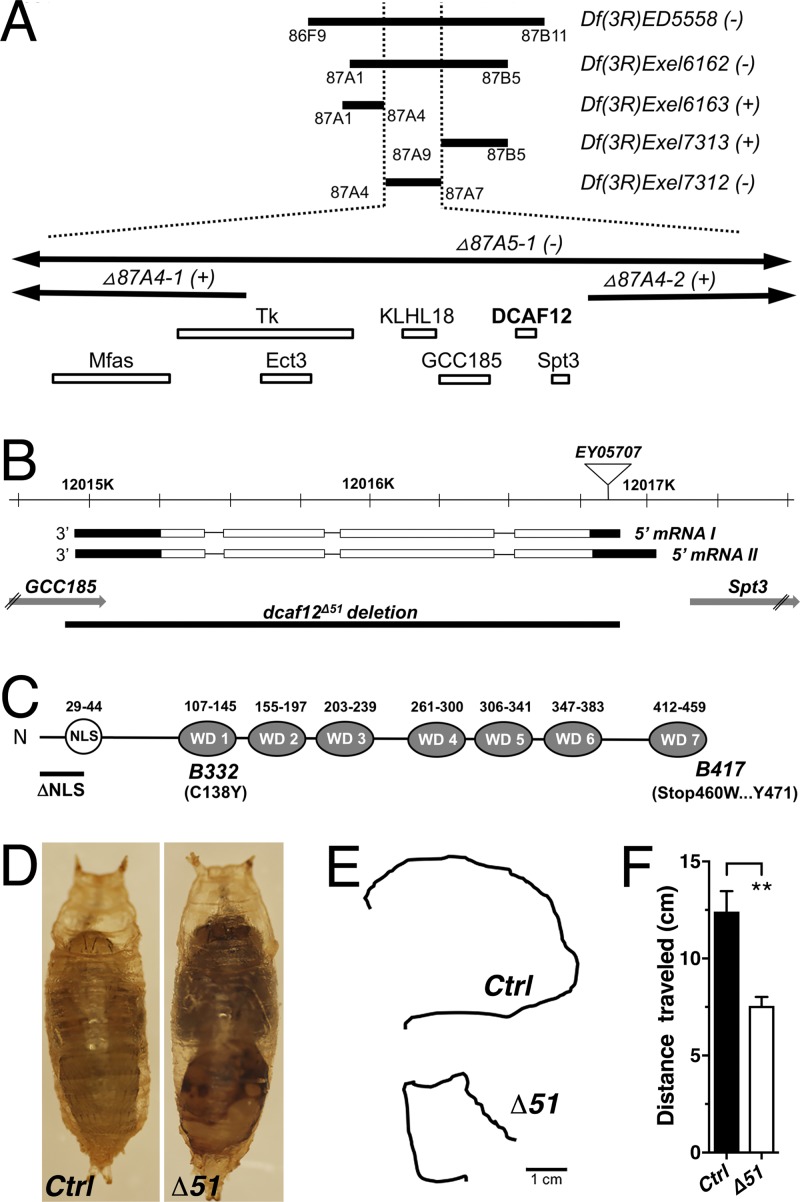
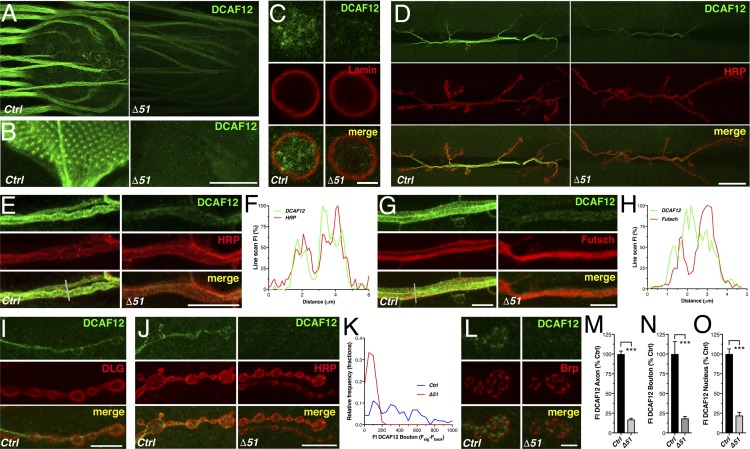
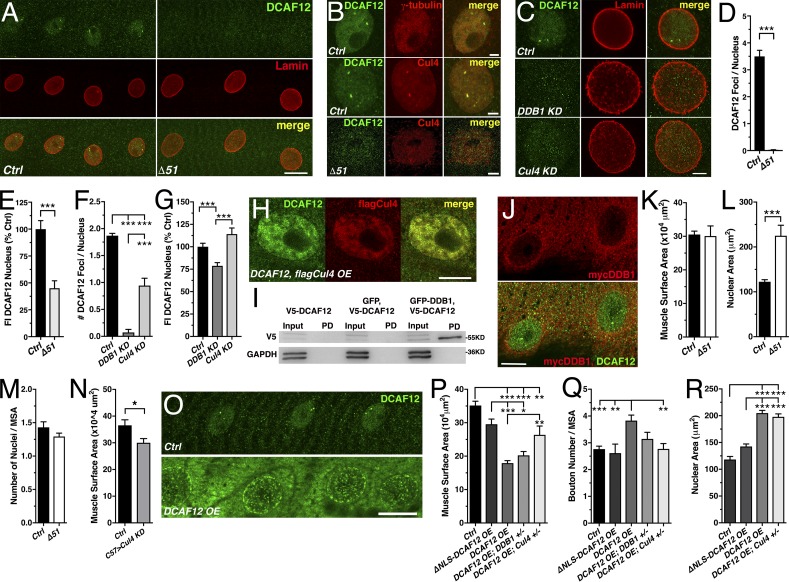
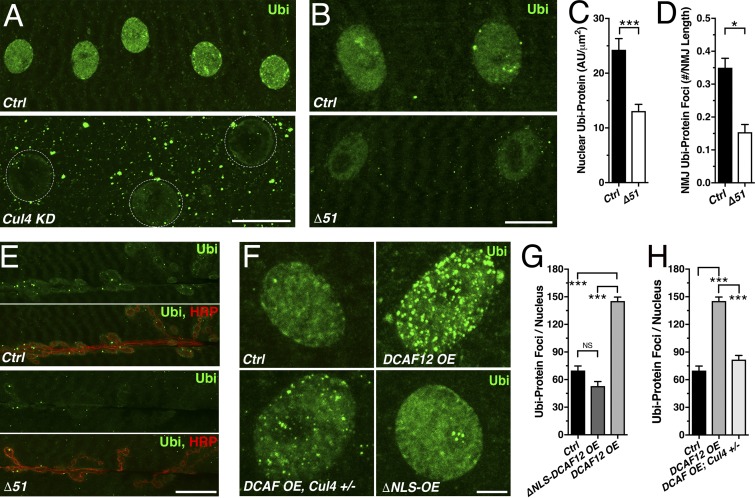
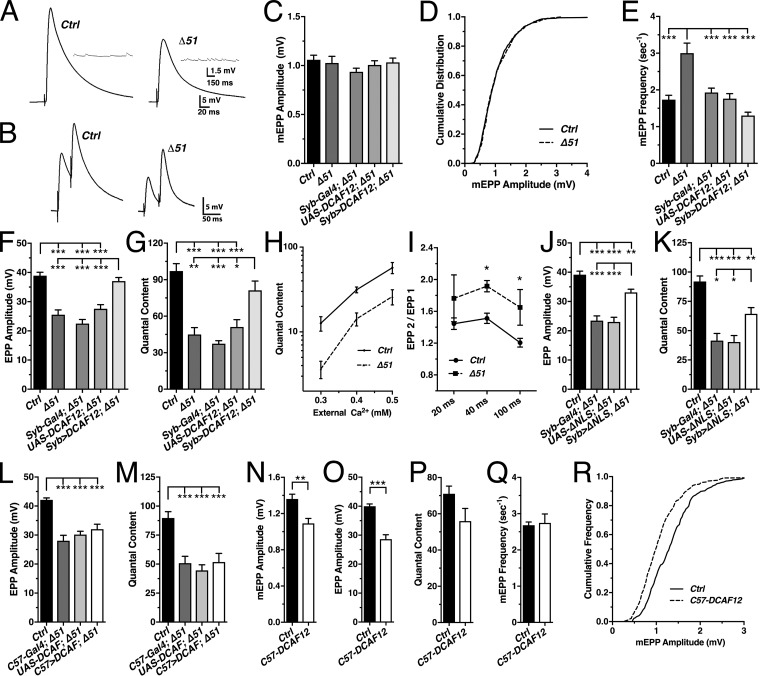
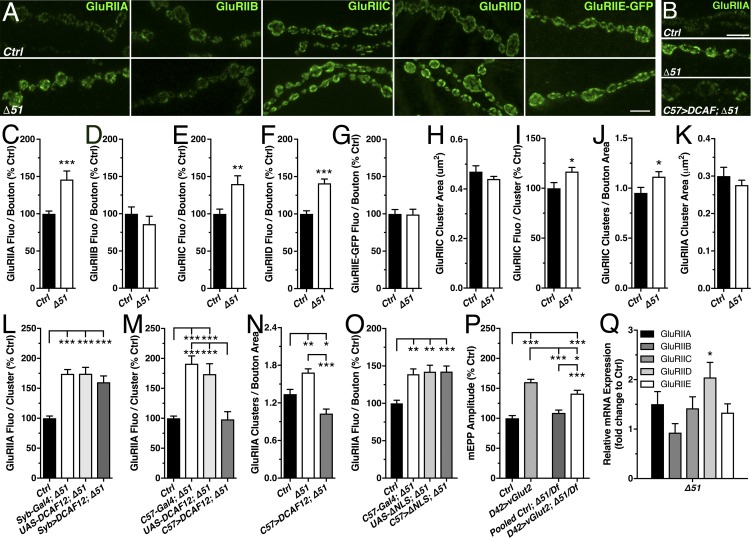
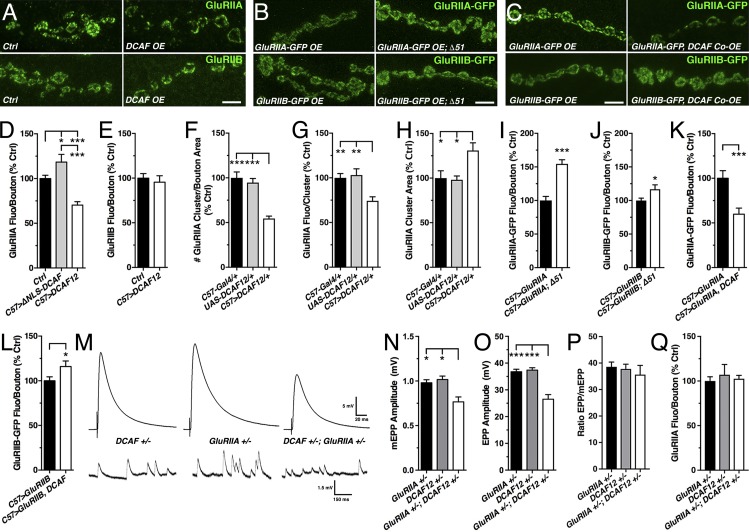
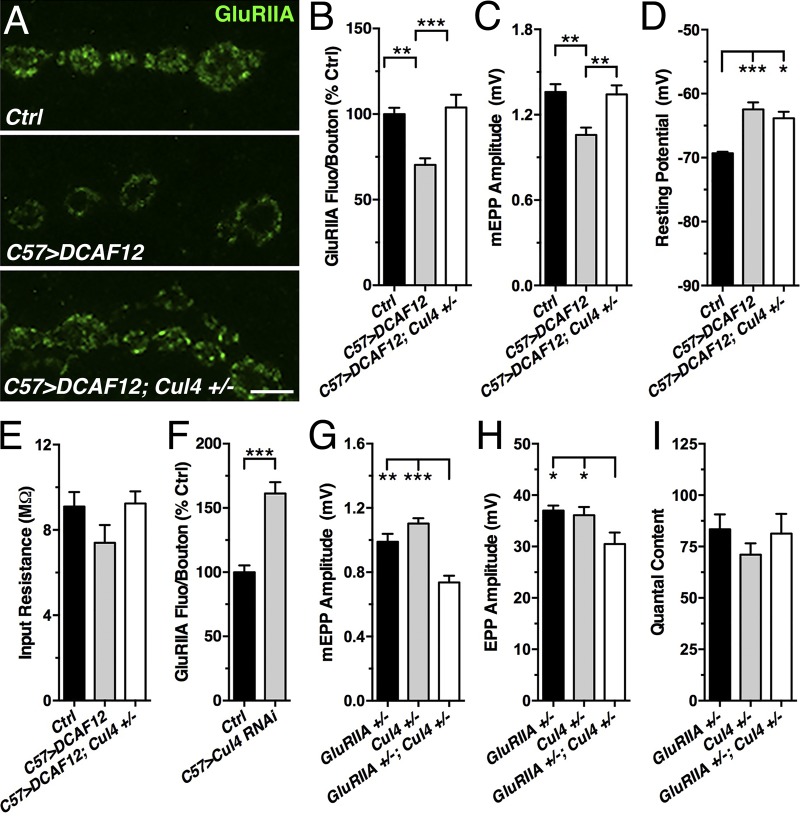
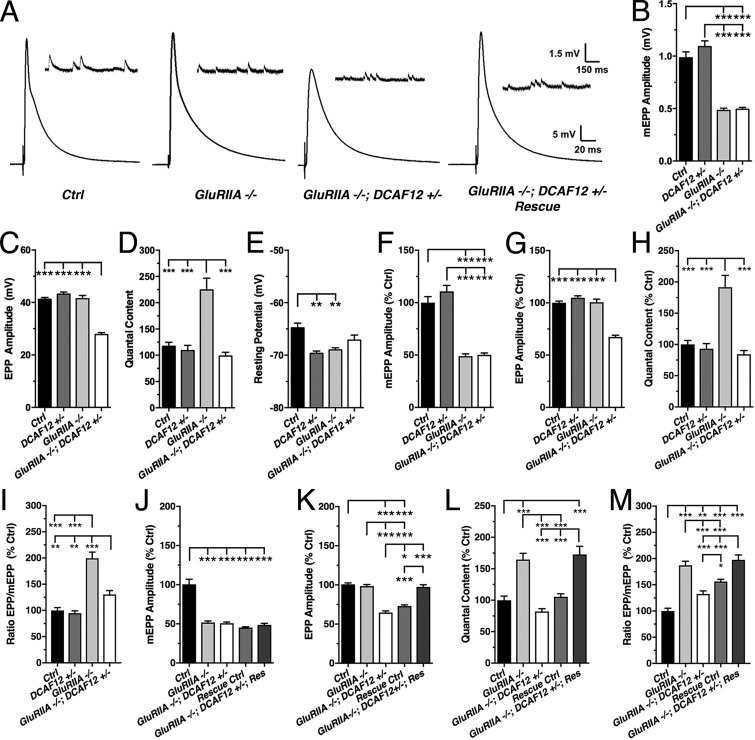
We genetically characterized the synaptic role of the Drosophila homologue of human DCAF12, a putative cofactor of Cullin4 (Cul4) ubiquitin ligase complexes. Deletion of Drosophila DCAF12 impairs larval locomotion and arrests development. At larval neuromuscular junctions (NMJs), DCAF12 is expressed presynaptically in synaptic boutons, axons, and nuclei of motor neurons. Postsynaptically, DCAF12 is expressed in muscle nuclei and facilitates Cul4-dependent ubiquitination. Genetic experiments identified several mechanistically independent functions of DCAF12 at larval NMJs. First, presynaptic DCAF12 promotes evoked neurotransmitter release. Second, postsynaptic DCAF12 negatively controls the synaptic levels of the glutamate receptor subunits GluRIIA, GluRIIC, and GluRIID. The down-regulation of synaptic GluRIIA subunits by nuclear DCAF12 requires Cul4. Third, presynaptic DCAF12 is required for the expression of synaptic homeostatic potentiation. We suggest that DCAF12 and Cul4 are critical for normal synaptic function and plasticity at larval NMJs.


Figures

Figure 1.
Figure 1.
Genetic and molecular analysis of DCAF12. (A) Deficiency (Df) mapping of alleles B332 and B417. Closed and open bars indicate deficiencies and genes, respectively. (B and C) Structure of the dcaf12 gene and DCAF12 protein. (D) 3-d-old control (w1118) and Δ51 mutant pupae. (E and F) Traces (E) and quantification (F) of crawling from control and Δ51 third-instar larvae (means ± SEM; n ≥ 6; **, P < 0.004; two-tailed unpaired t test).
Figure 2.
Figure 2.
Subcellular localization of neuronal DCAF12. (A and B) Larval ventral nerve cord and eye disc stained for DCAF12 (GP11). (C) Neuronal somata stained for DCAF12 (GP12) and Lamin-C marking the nuclear envelope. (D) Larval NMJs stained for DCAF12 (GP11) and HRP marking the neuronal membrane. (E and F) Axons of NMJ (E) stained for DCAF12 and HRP and plot (F) of a single line scan (gray line in E) of DCAF12 and HRP fluorescence (n = 1). (G and H) Axons of NMJ stained for DCAF12 and Futsch (G) and plot (H) of a single line scan (gray line in G) of DCAF12 and Futsch fluorescence (n = 1). (I and J) Synaptic boutons stained for DCAF12 and postsynaptic DLG (I) or DCAF12 and HRP (J). (K) Frequency distribution of DCAF12 fluorescence in synaptic boutons of control (n = 118; n = 3) and Δ51 (n = 72; n = 3). (L) Synaptic boutons stained for DCAF12 and Brp (AZ). (M–O) Quantification of anti-DCAF12 fluorescence intensity (FI; means ± SEM; n ≥ 8; ***, P < 0.0002; two-tailed unpaired t test). Scale bars, 50 µm (A and B), 20 µm (D), 10 µm (E, I, and J), 5 µm (C and G), and 2.5 µm (L).
Figure 3.
Figure 3.
Nuclear DCAF12 interacts with Cul4. (A) Muscle nuclei stained for DCAF12 (GP11) and Lamin-C. (B and C) Muscle nuclei stained for DCAF12 (B and C) and γ-tubulin (B), Cul4 (B), or Lamin-C (C). (D–G) Amount of DCAF12 foci (D and F) and levels (E and G) in muscle nuclei (n ≥ 35; [D and E], n ≥ 9; [F and G], n ≥ 3). (H) Muscle nuclei stained for coexpressed DCAF12 and flagCul4. (I) Western blot of GFP pull-downs (PD) probed with anti-V5 from S2 cell extracts expressing V5-DCAF12, GFP and V5-DCAF12, or V5-DCAF12 and GFP-DDB1. GAPDH was used as a loading control. (J) Muscle nuclei stained for mycDDB1 and DCAF12. (K–N) Muscle surface area (MSA [K and N]), nuclear area (L), and normalized number (M) of nuclei (n ≥ 11). (O) Muscles stained for DCAF12. (P–R) Reduced Cul4 levels suppress DCAF12 OE effects on MSA (P), normalized bouton number (Q), and size (R) of nuclei (n ≥ 6). Scale bars, 20 µm (A and O), 10 µm (H and J), and 5 µm (B and C). Graphs display means ± SEM. Statistical analysis used two-tailed unpaired t test (E and K–N), Mann–Whitney test (D), or one-way ANOVA (F, G, and P–R); *, P < 0.05; **, P < 0.01; ***, P < 0.001.
Figure 4.
Figure 4.
DCAF12 mediates Cul4-dependent protein ubiquitination. (A and B) Muscle nuclei (dashed circle) stained for ubiquitinated proteins (Ubi). (C and D) Nuclear Ubi levels in muscles (C) and number of Ubi foci (D) at NMJs (n ≥ 11). (E) Larval NMJs stained for Ubi and HRP. (F) Muscle nuclei stained for Ubi. (G and H) Number of Ubi foci per nucleus (n ≥ 23; n ≥ 7). Scale bars, 20 µm (A and E), 10 µm (B), and 5 µm (F). Graphs display means ± SEM. Statistical analysis used two-tailed unpaired t test (C and D) or one-way ANOVA (G and H); *, P < 0.05; ***, P < 0.001.
Figure 5.
Figure 5.
DCAF12 is required for evoked neurotransmitter release at larval NMJs. mEPPs and evoked EPPs were recorded from muscle 6 of the indicated genotypes in HL3 media containing 0.6 mM Ca2+. (A and B) Representative traces of mEPPs (inset) and EPPs evoked by single- (A) or paired-pulse stimulation (B). (C–G) Average mEPP amplitudes (C), their cumulative frequency distribution (D; n ≥ 270), mEPP frequency (E), EPP amplitudes (F), and quantal content (G) of control and Δ51 (n ≥ 9) and Δ51 mutants expressing DCAF12 presynaptically (n ≥ 11). (H) Plot of corrected quantal content recorded at various extracellular [Ca2+]s (n ≥ 4). (I) Paired-pulse ratio (EPP2/EPP1) for various interstimulus intervals (n ≥ 3). (J–M) EPP amplitudes and quantal content from Δ51 mutants expressing ΔNLS-DCAF12 presynaptically (J and K; n ≥ 9) or DCAF12 postsynaptically (L and M; n ≥ 5). (N–Q) Effects of postsynaptic DCAF12 OE on mEPP amplitudes (N), EPP amplitudes (O), quantal content (P), and mEPP frequency (Q; n ≥ 7). (R) Cumulative frequency distribution of mEPP amplitudes (n ≥ 266; n ≥ 5). Graphs display means ± SEM. Statistical analysis used two-tailed unpaired t test (I and N–Q) or one-way ANOVA (C, E–G, and J–M); *, P < 0.05; **, P < 0.01; ***, P < 0.001.
Figure 6.
Figure 6.
Postsynaptic DCAF12 regulates the subunit composition of GluR at larval NMJs. (A and B) Synaptic boutons of NMJs stained for endogenous GluRIIA, GluRIIB, GluRIIC, GluRIID, or overexpressed GluRIIE-GFP subunits. Scale bars, 5 µm (A) and 2.5 µm (B). (C–G) Effect of DCAF12 deletion on synaptic levels of endogenous GluRIIA (C; n ≥ 9), GluRIIB (D; n ≥ 16), GluRIIC (E; n ≥ 17), GluRIID (F; n ≥ 13), and overexpressed GluRIIE-GFP subunits (G; n ≥ 7). (H–K) Effects of DCAF12 deletion on the size of GluRIIC-positive GluR clusters (H), GluRIIC fluorescence per cluster (I), normalized number of GluRIIC clusters to bouton area (J), and size of GluRIIA clusters (K; n ≥ 9). (L–O) Effects of presynaptic (L; n ≥ 11) and postsynaptic (M–O; n ≥ 7) expression of DCAF12 or ΔNLS-DCAF12 in Δ51 mutants on normalized synaptic GluRIIA levels (L and M), number of GluRIIA-positive clusters per bouton area (N), and GluRIIA fluorescence per bouton (O). (P) Effects of vGlut OE on mEPP amplitudes (n ≥ 11). Control is w1118; pooled control includes UAS-vGlut transgene and Gal4 driver in a Δ51/Df Ex7312 background. (Q) GluRIIA, GluRIIB, GluRIIC, GluRIID, and GluRIIE mRNA levels in dcaf12Δ51 mutants normalized to control (n ≥ 5). Graphs display means ± SEM. Statistical analysis used two-tailed unpaired t test (C–K) or one-way ANOVA (L–Q); *, P < 0.05; **, P < 0.01; ***, P < 0.001.
Figure 7.
Figure 7.
Postsynaptic nuclear DCAF12 controls the synaptic ratio of GluRIIA/IIB subunits. (A–C) Larval NMJs stained for endogenous GluRIIA and GluRIIB (A) and GFP-tagged GluRIIA and GluRIIB expressed in WT or Δ51 (B) or coexpressed with DCAF12 (C). Scale bar, 5 µm. (D–H) Effects of postsynaptic DCAF12 (D–H) or ΔNLS-DCAF12 OE (D) on synaptic levels of endogenous GluRIIA subunits (D and F–H; n ≥ 7) or GluRIIB subunits (E; n ≥ 5). (I and J) Effects of DCAF12 deletion on GluRIIA-GFP (I) and GluRIIB-GFP (J) expression levels (n ≥ 9). (K and L) Effects of DCAF12 coOE on GluRIIA-GFP (C and K) and GluRIIB-GFP (C and L) expression levels (n ≥ 11). (M–Q) Traces (M) of mEPPs and EPPs and quantification of mEPP amplitudes (N), EPP amplitudes (O), mEPP/EPP ratio (P), and synaptic GluRIIA levels (Q) from controls and trans-heterozygous glurIIASP16/+; dcaf12Δ51/+ double mutants (n ≥ 7). Graphs display means ± SEM. Statistical analysis used one-way ANOVA (D, F–H, and N–Q), two-tailed unpaired t test (I and L), or a Mann–Whitney test (E, J, and K); *, P < 0.05; **, P < 0.01; ***, P < 0.001.
Figure 8.
Figure 8.
DCAF12 controls synaptic GluRIIA levels in a Cul4-dependent manner. (A–C) Effects of postsynaptic DCAF12 OE and reduced Cul4 on synaptic GluRIIA levels (A and B; n ≥ 11) and mEPP amplitudes at larval NMJs (C; n ≥ 9). Scale bar, 5 µm. (D and E) Effects on resting potential (D) and input resistance (E) of muscle (n ≥ 9). (F) Effect of muscle Cul4 KD on synaptic GluRIIA levels (n ≥ 13). (G–I) mEPP amplitudes (G), EPP amplitudes (H), and quantal content (I) of heterozygous glurIIA-cul4 double mutants (n ≥ 9). Graphs display means ± SEM. Statistical analysis used one-way ANOVA (B–E and G–I) or two-tailed unpaired t test (F); *, P < 0.05; **, P < 0.01; ***, P < 0.001.
Figure 9.
Figure 9.
Presynaptic DCAF12 is required homeostatic potentiation. mEPPs and EPPs were recorded from larval muscle 6 of indicated genotypes in HL3 media containing 0.6 mM Ca2+. (A) Representative traces of mEPPs (inset) and EPPs. (B–I) Effects of reducing DCAF12 in glurIIASP16 mutants on average and normalized mEPP amplitudes (B and F), EPP amplitudes (C and G), quantal content (D and H), EPP/mEPP ratio (I), and muscle resting potential (E; n ≥ 8). (J–M) Effects of genetic rescue of DCAF12 on normalized mEPP amplitudes (J), EPP amplitudes (K), quantal content (L), and EPP/mEPP ratio (M; n ≥ 14). Graphs display means ± SEM. Statistical analysis used one-way ANOVA (B–M); *, P < 0.05; **, P < 0.01; ***, P < 0.001.

References

    1. Abbott L.F., and Regehr W.G.. 2004. Synaptic computation. Nature. 431:796–803. 10.1038/nature03010 - DOI - PubMed
    1. Angers S., Li T., Yi X., MacCoss M.J., Moon R.T., and Zheng N.. 2006. Molecular architecture and assembly of the DDB1-CUL4A ubiquitin ligase machinery. Nature. 443:590–593. - PubMed
    1. Brand A.H., and Perrimon N.. 1993. Targeted gene expression as a means of altering cell fates and generating dominant phenotypes. Development. 118:401–415. - PubMed
    1. Brusich D.J., Spring A.M., and Frank C.A.. 2015. A single-cross, RNA interference-based genetic tool for examining the long-term maintenance of homeostatic plasticity. Front. Cell. Neurosci. 9:107 10.3389/fncel.2015.00107 - DOI - PMC - PubMed
    1. Chang H., Ciani S., and Kidokoro Y.. 1994. Ion permeation properties of the glutamate receptor channel in cultured embryonic Drosophila myotubes. J. Physiol. 476:1–16. - PMC - PubMed

Publication types