. 2019 May 1;25(9):2821-2834.
doi: 10.1158/1078-0432.CCR-18-3460. Epub 2019 Jan 22.

Unstable Genome and Transcriptome Dynamics during Tumor Metastasis Contribute to Therapeutic Heterogeneity in Colorectal Cancers

Affiliations

Unstable Genome and Transcriptome Dynamics during Tumor Metastasis Contribute to Therapeutic Heterogeneity in Colorectal Cancers

Sung-Yup Cho et al. Clin Cancer Res. .

Abstract

Purpose: Genomic and transcriptomic alterations during metastasis are considered to affect clinical outcome of colorectal cancers, but detailed clinical implications of metastatic alterations are not fully uncovered. We aimed to investigate the effect of metastatic evolution on in vivo treatment outcome, and identify genomic and transcriptomic alterations associated with drug responsiveness.

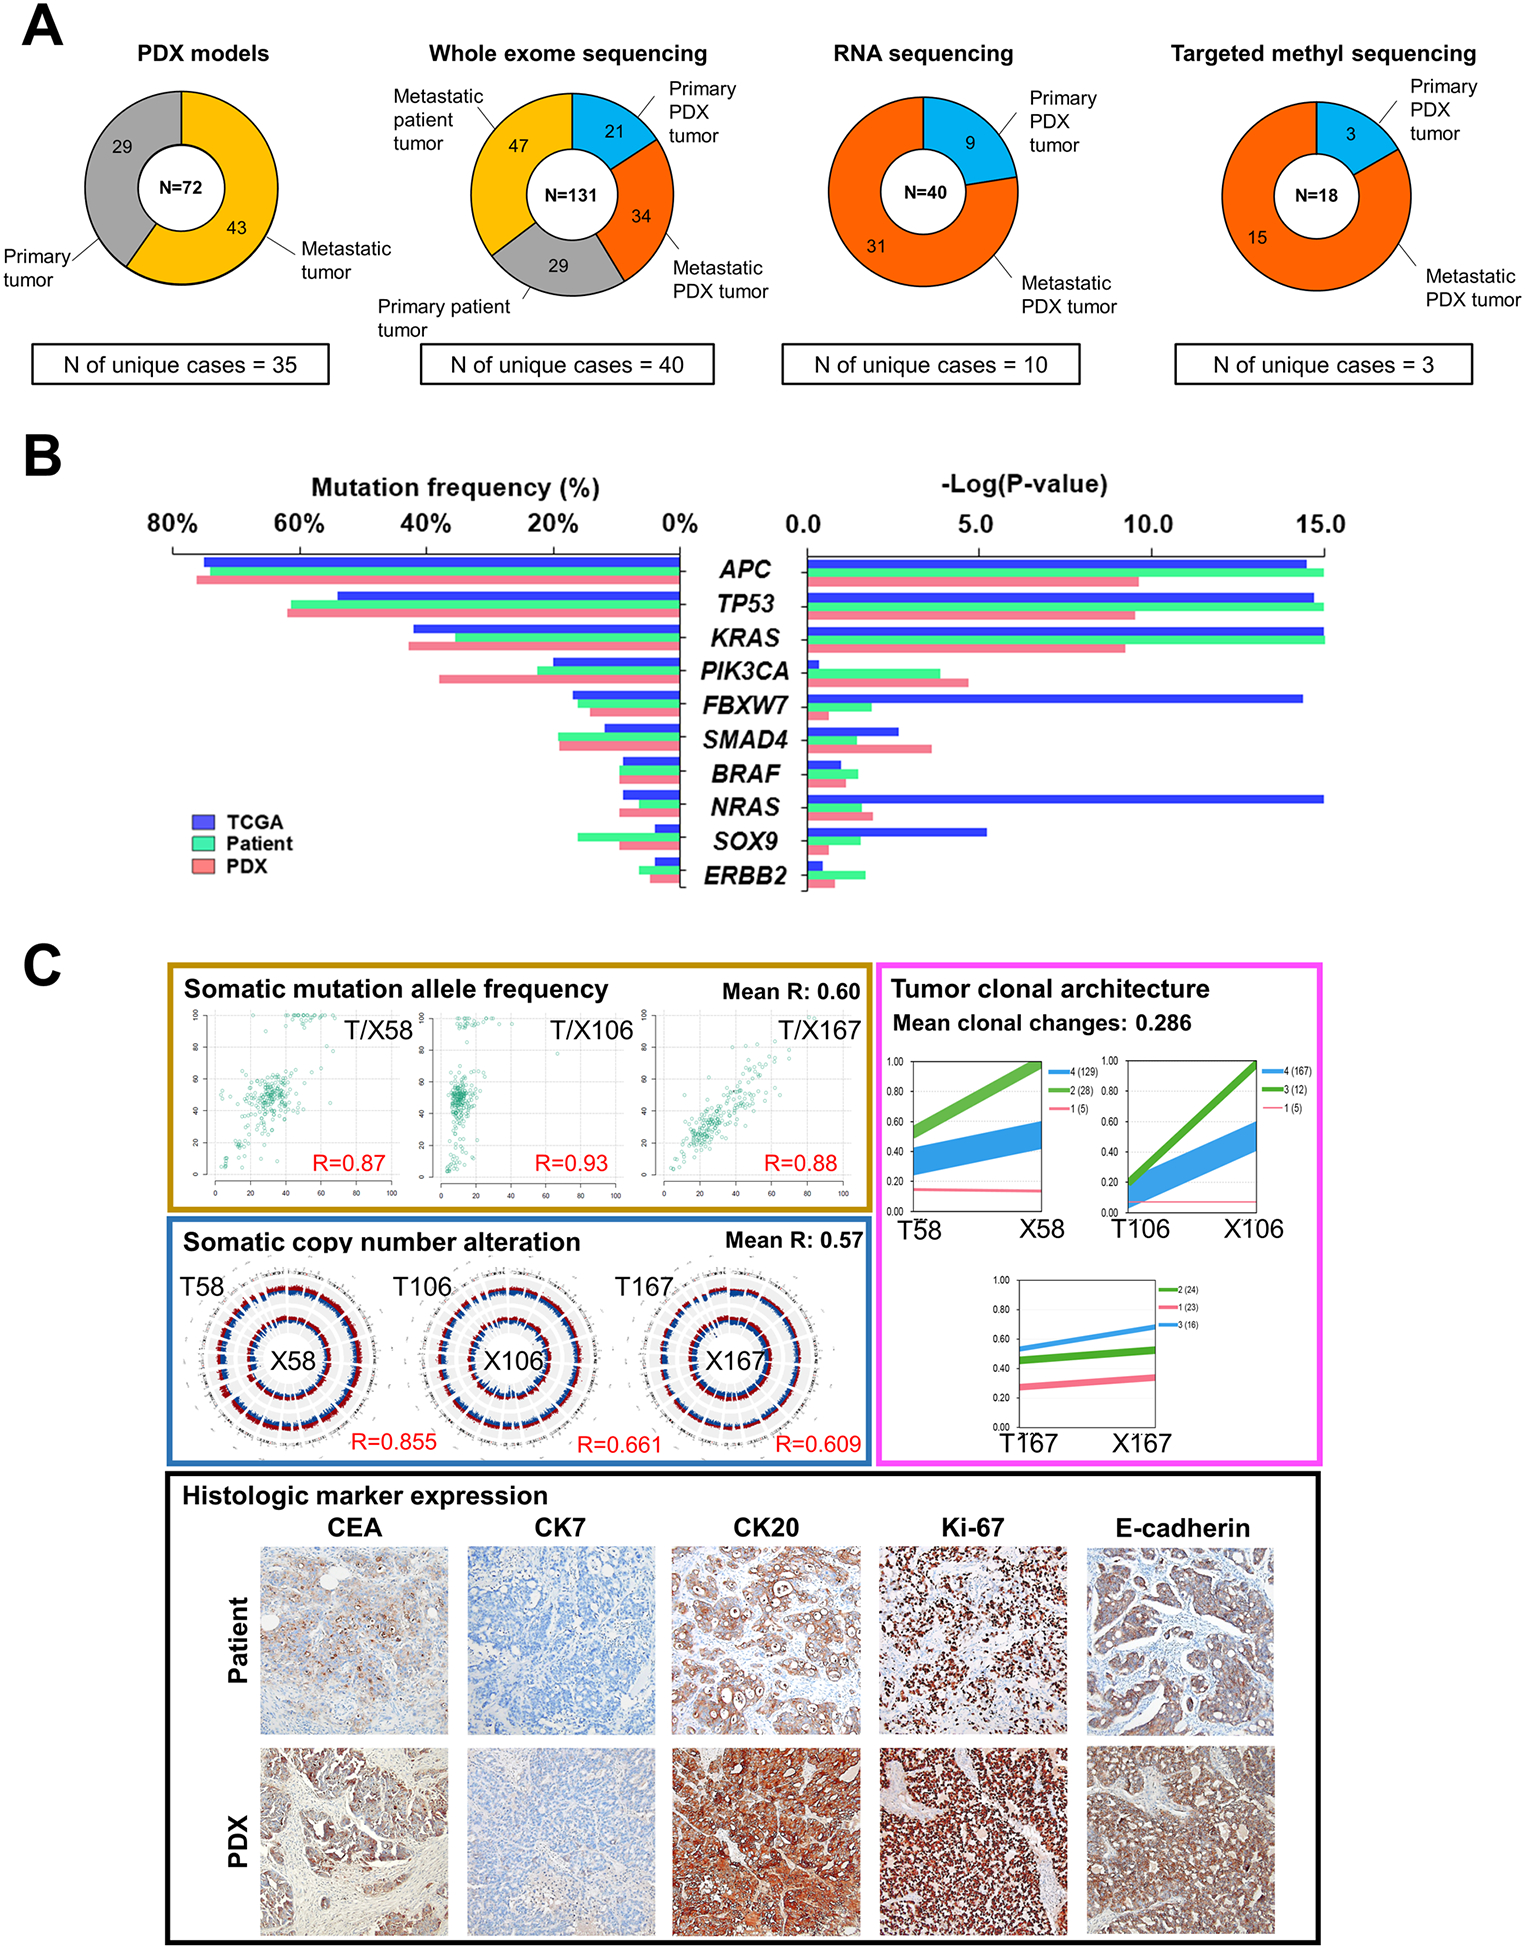
Experimental design: We developed and analyzed patient-derived xenograft (PDX) models from 35 patients with colorectal cancer including 5 patients with multiple organ metastases (MOMs). We performed whole-exome, DNA methylation, and RNA sequencing for patient and PDX tumors. With samples from patients with MOMs, we conducted phylogenetic and subclonal analysis and in vivo drug efficacy test on the corresponding PDX models.

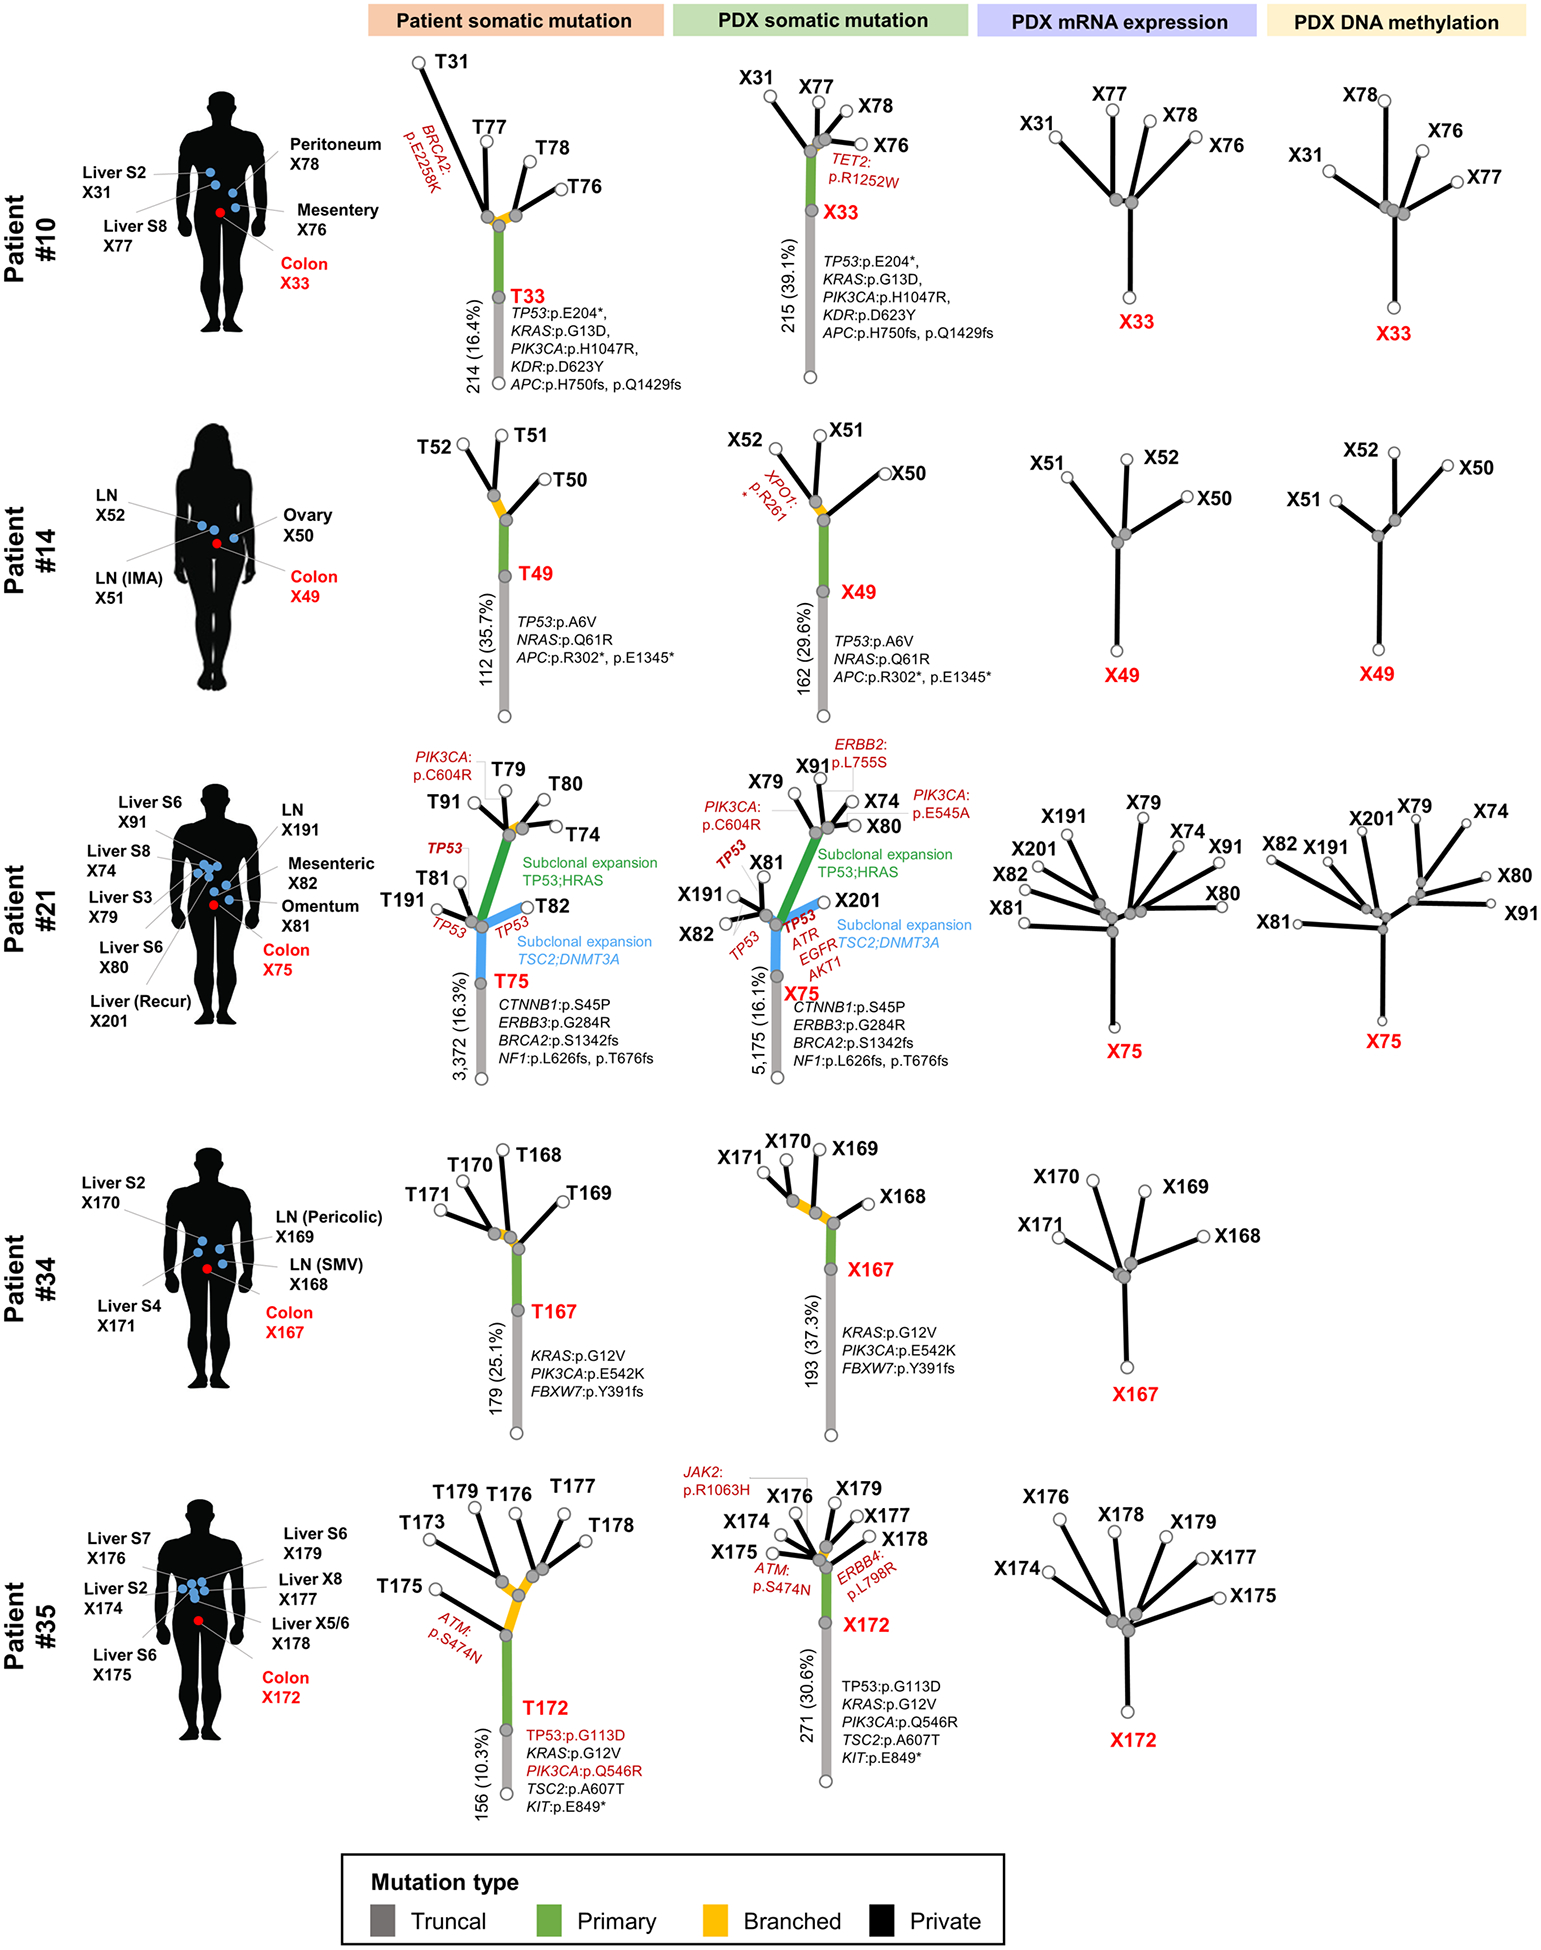
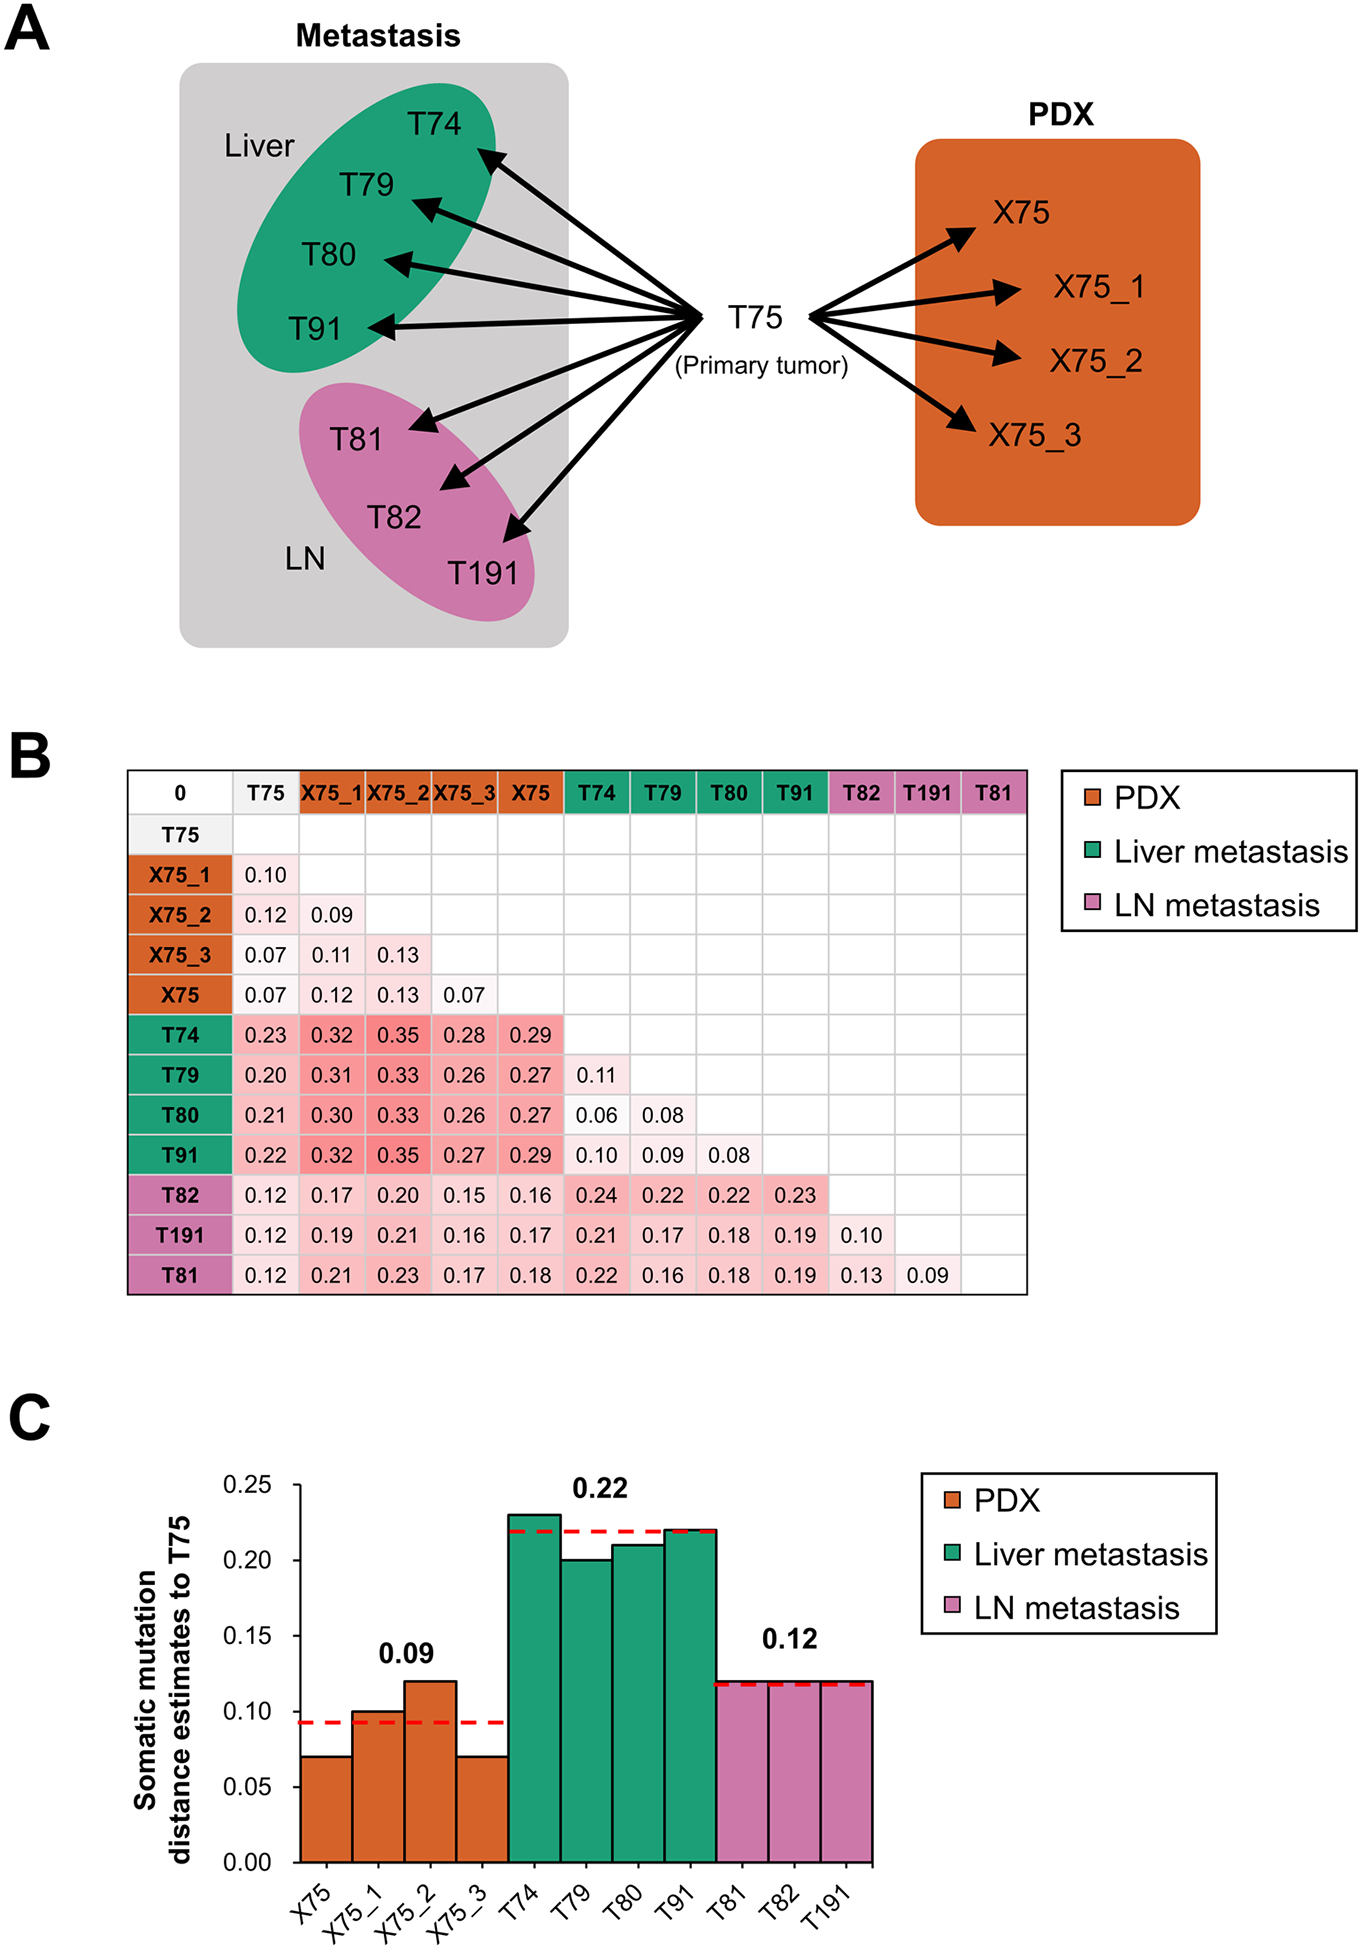
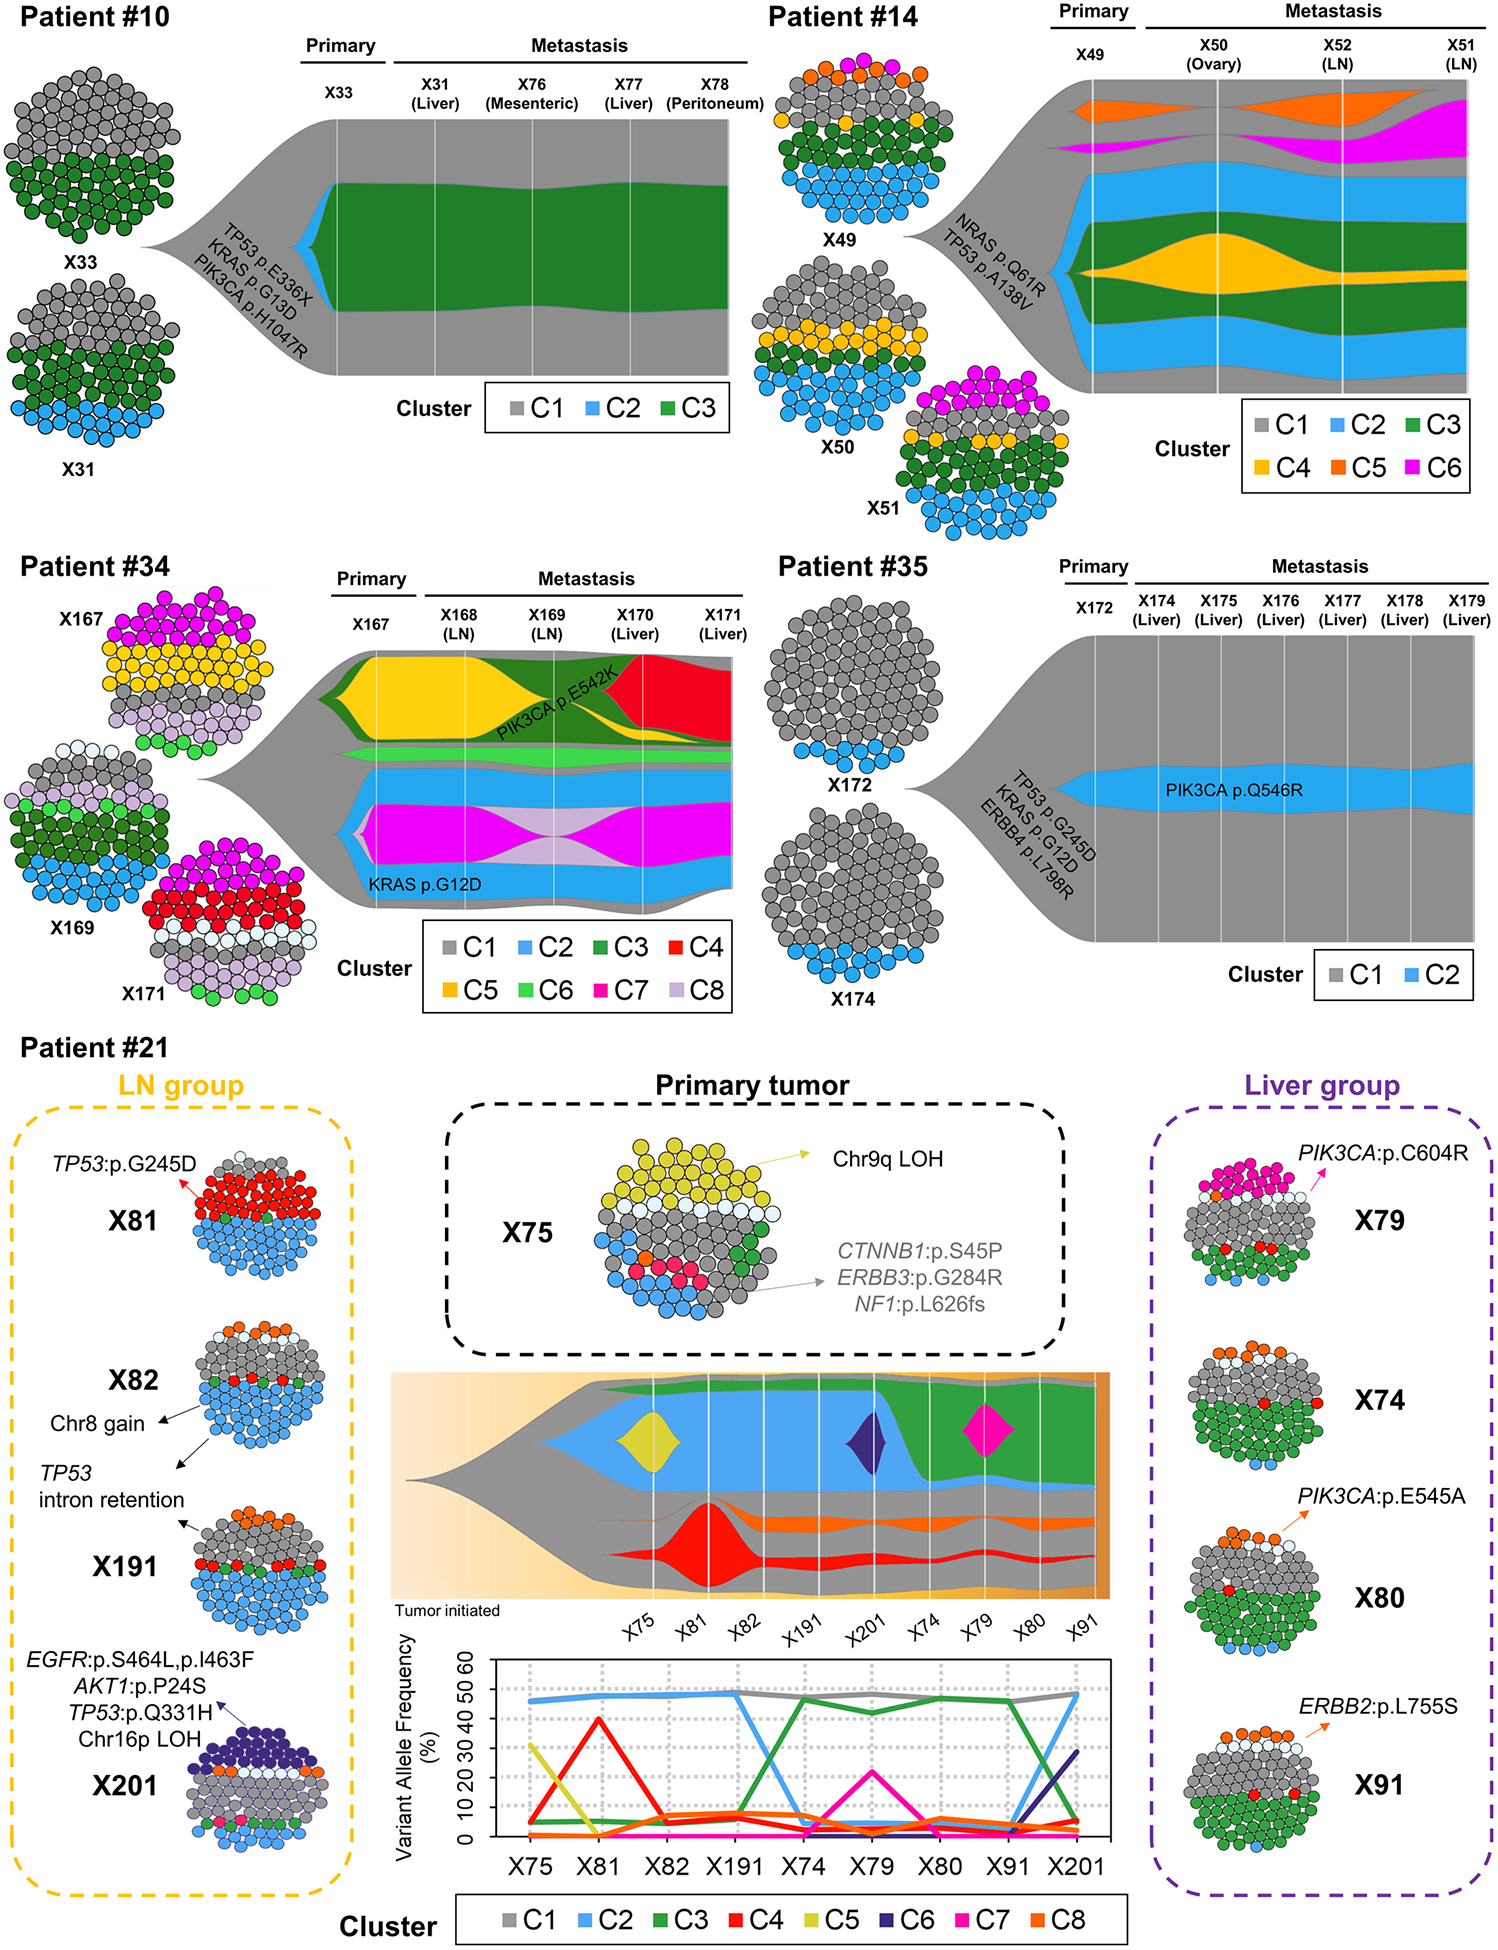
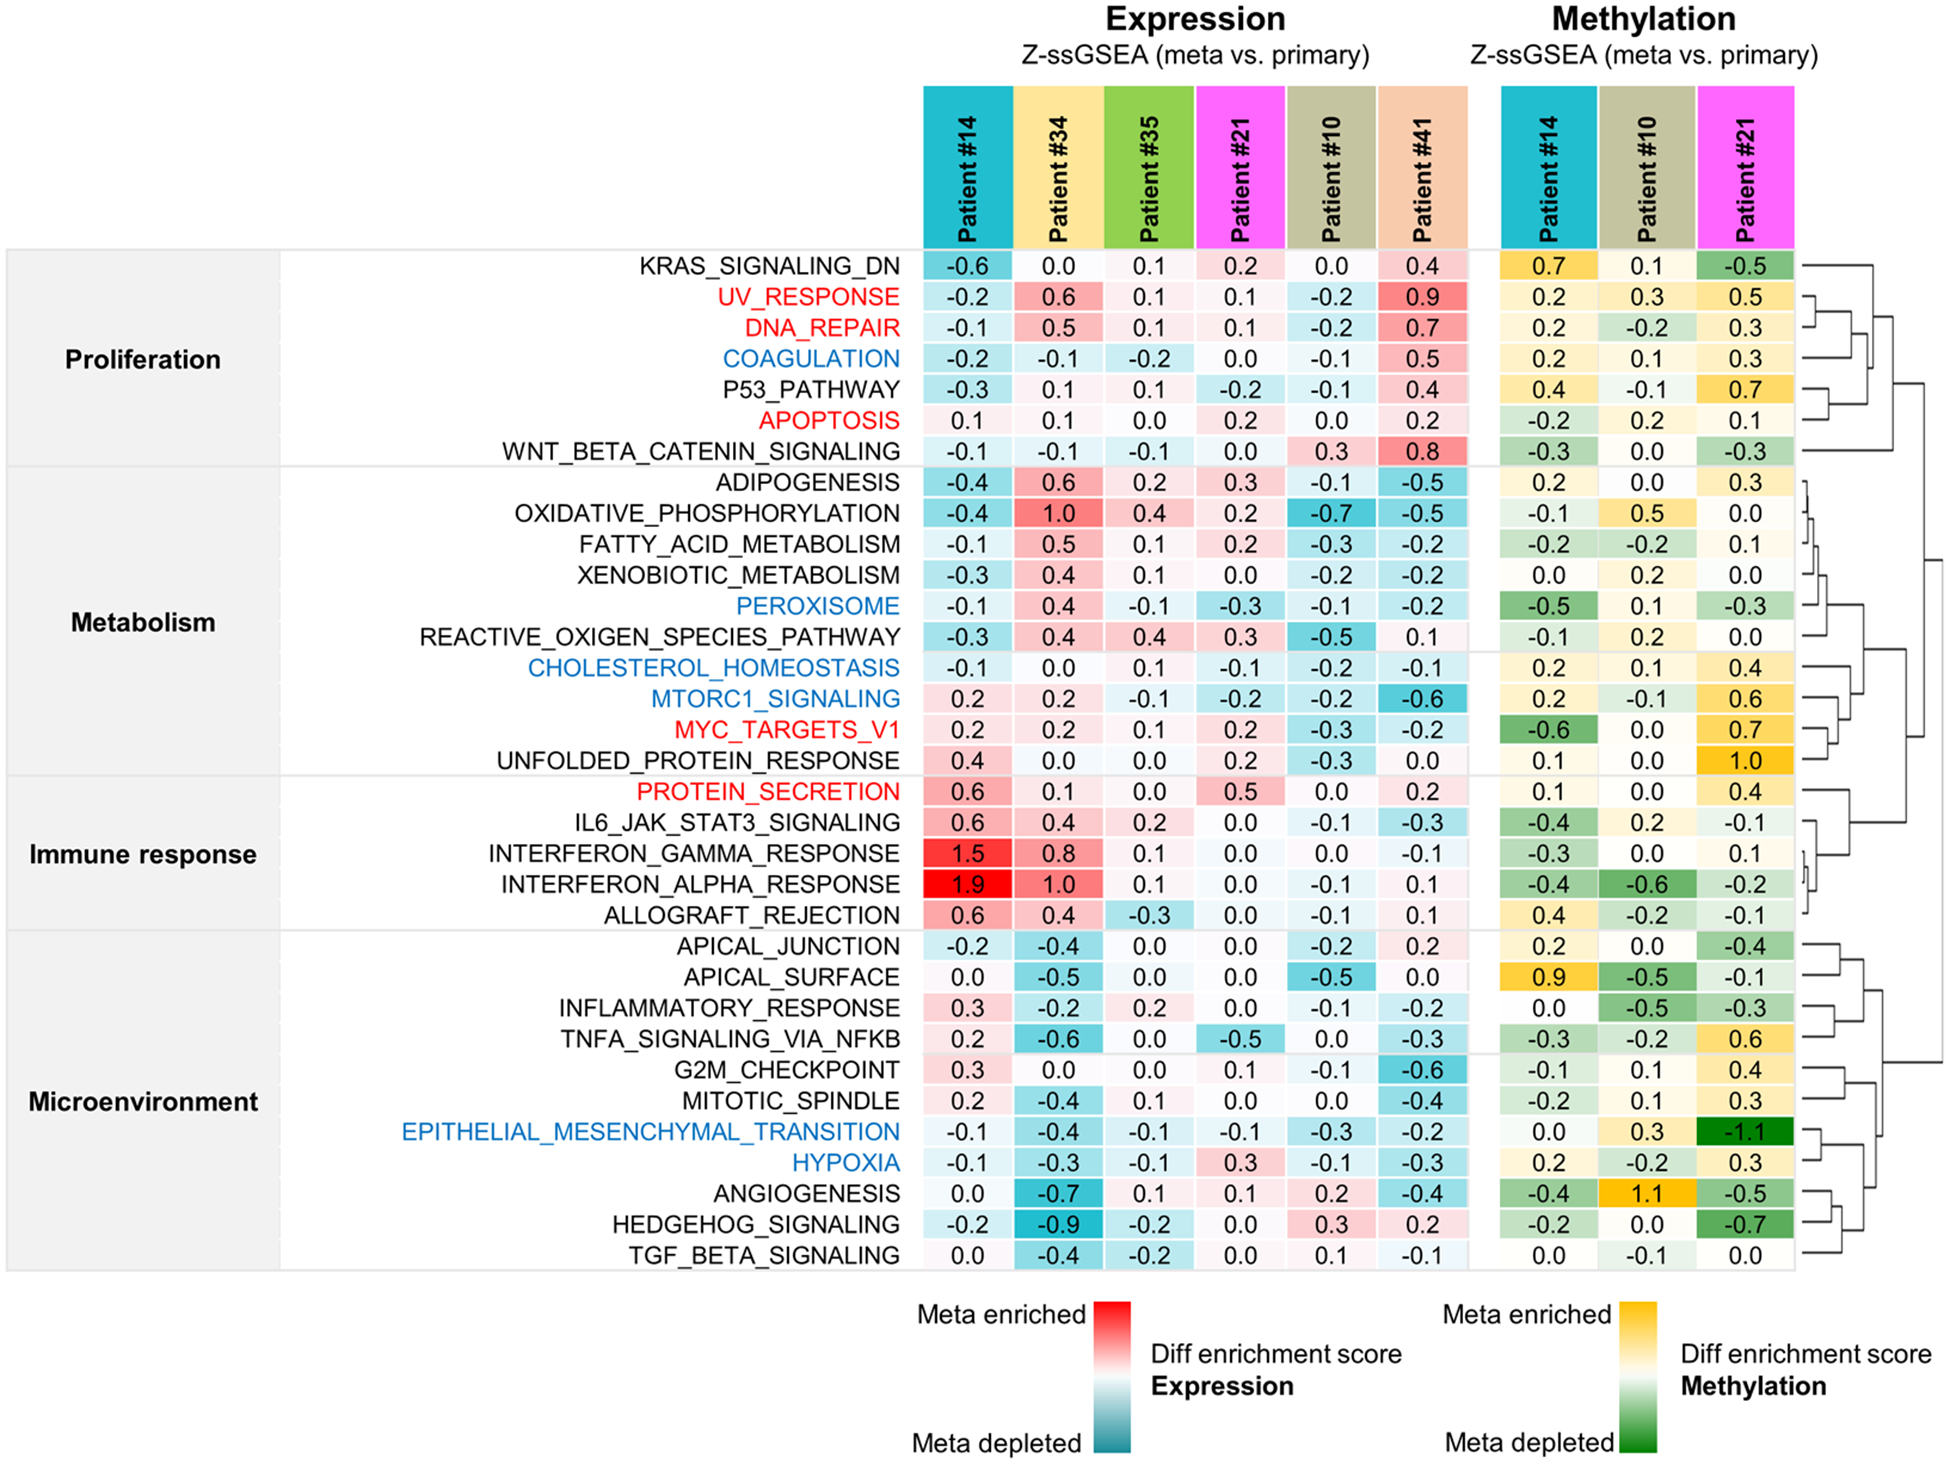
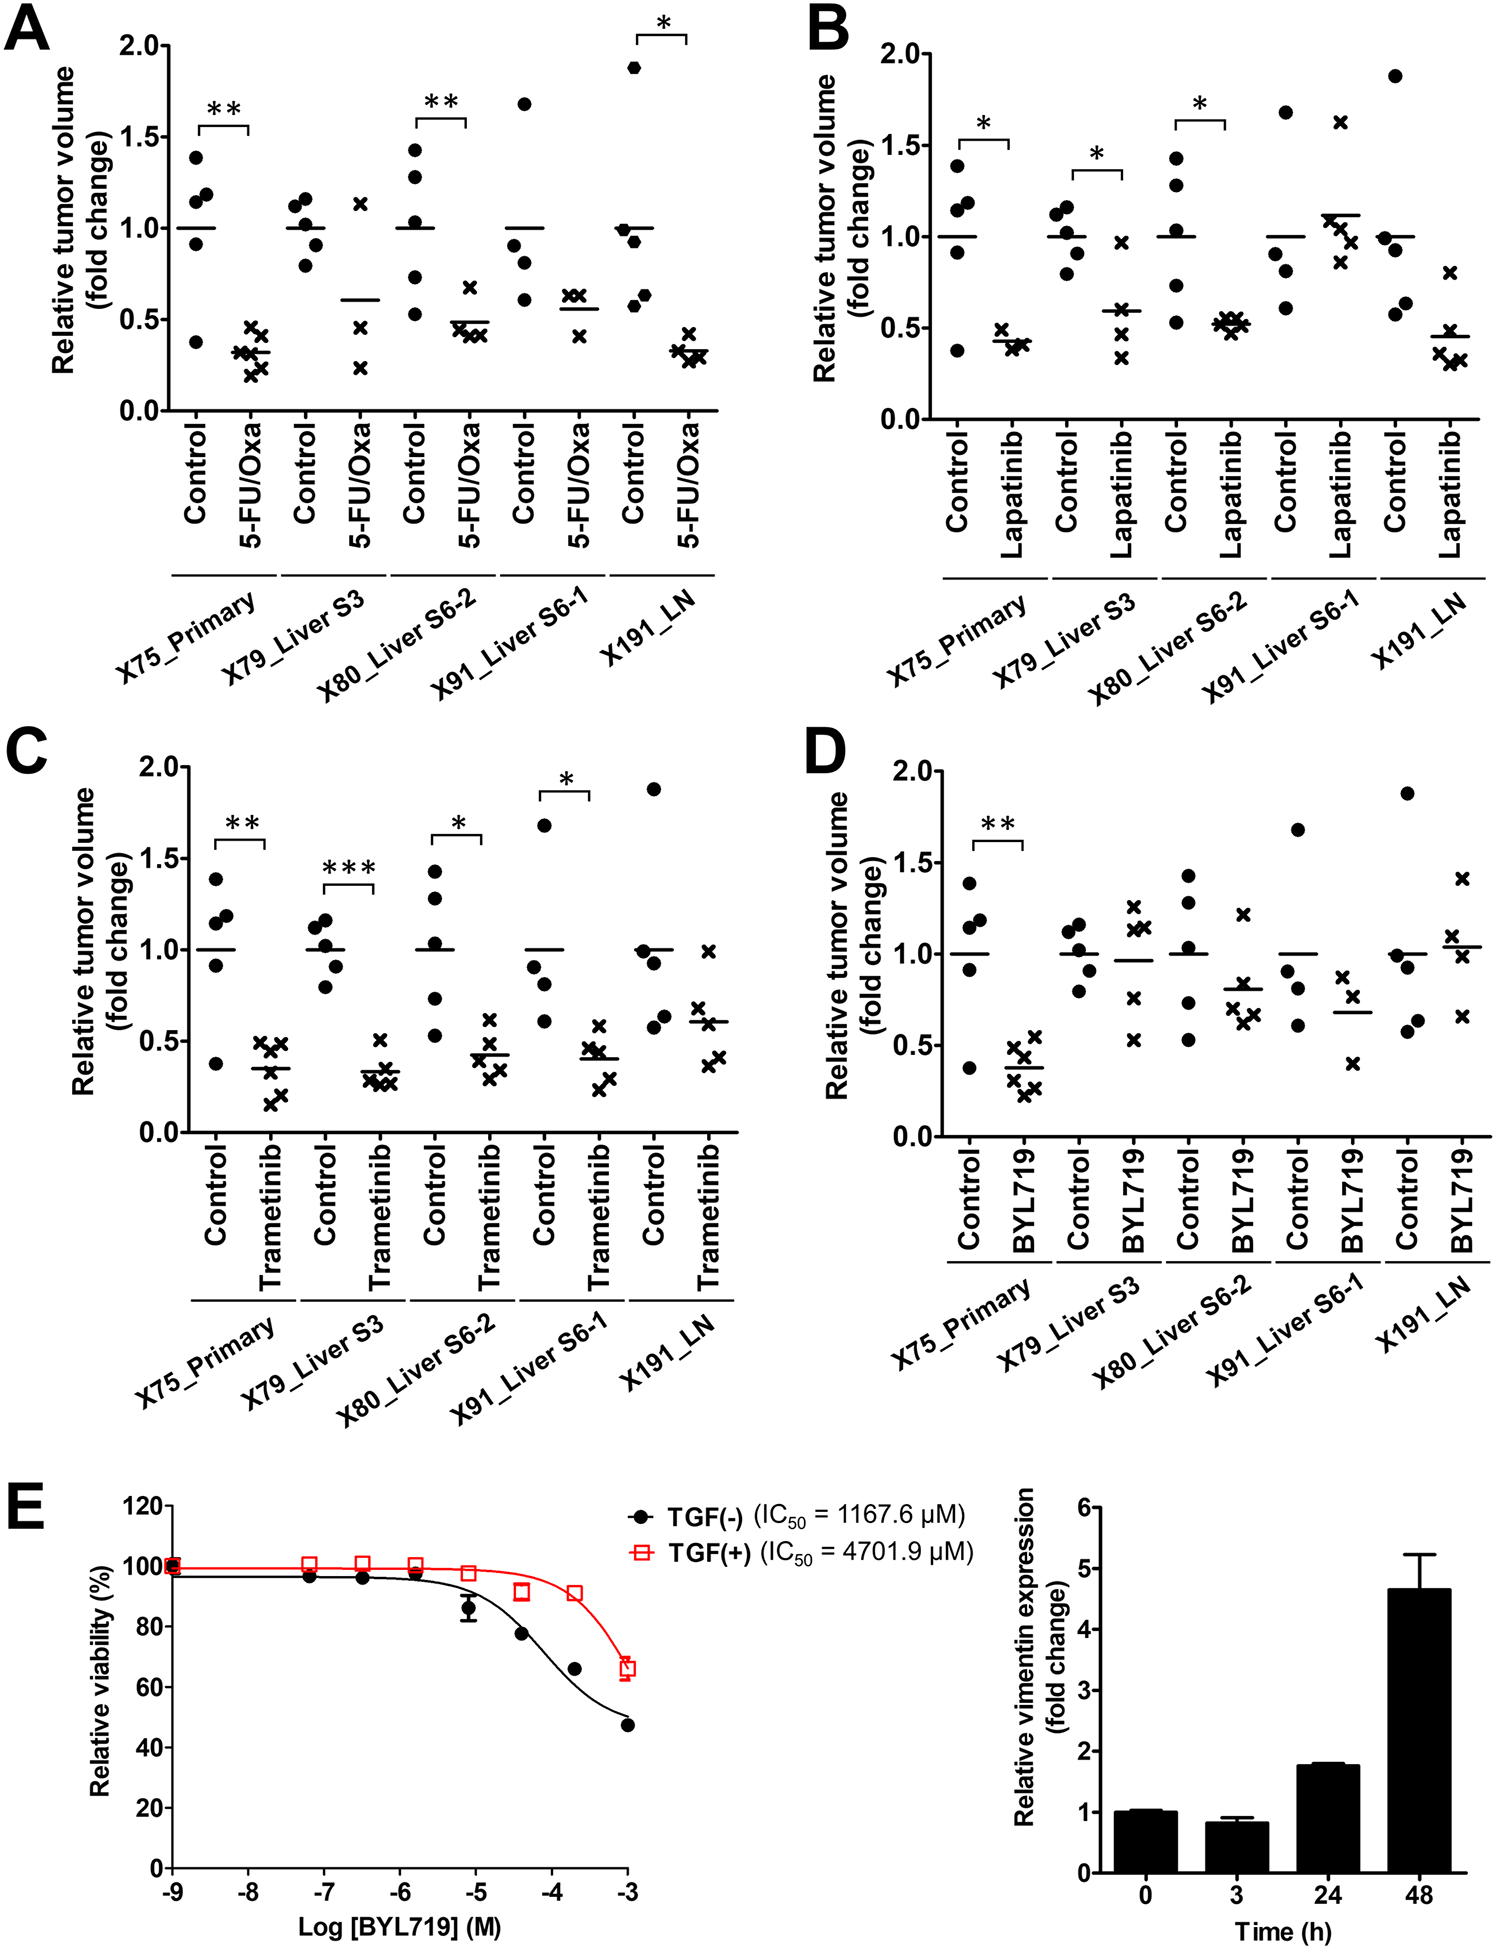
Results: Phylogenetic analysis using mutation, expression, and DNA methylation data in patients with MOMs showed that mutational alterations were closely connected with transcriptomic and epigenomic changes during the tumor evolution. Subclonal analysis revealed that initial primary tumors with larger number of subclones exhibited more dynamic changes in subclonal architecture according to metastasis, and loco-regional and distant metastases occurred in a parallel or independent fashion. The PDX models from MOMs demonstrated therapeutic heterogeneity for targeted treatment, due to subclonal acquisition of additional mutations or transcriptomic activation of bypass signaling pathway during tumor evolution.

Conclusions: This study demonstrated in vivo therapeutic heterogeneity of colorectal cancers using PDX models, and suggests that acquired subclonal alterations in mutations or gene expression profiles during tumor metastatic processes can be associated with the development of drug resistance and therapeutic heterogeneity of colorectal cancers.


Conflict of interest statement

Disclosure of Potential Conflicts of Interest

No potential conflicts of interest were disclosed.

Figures

Figure 1.
Figure 1.
Genomic characterization of PDX tumors of CRCs. A, Summary of sample composition for PDX generation, whole exome sequencing, RNA sequencing and DNA targeted methyl-capture sequencing. B, Distribution of the mutation frequencies of the top 10 significantly-mutated cancer genes from the TCGA cohort (n = 224; blue), primary tumors of our patient cohort (n = 29; green) and primary tumors of our PDX cohort (n = 18; pink). Left panel represents the frequency of mutations from three cohorts, calculated by considering only primary tumors. Right panel shows P-values of each gene estimated by the MutSig algorithm. C, Panels with individual examples for comparison between matched patient and PDX tumors. Left upper panel contains scatterplots of somatic mutation allele frequencies of matched samples, and left middle panel represents genomic distribution of somatic copy number alterations (red region, amplification; blue region, deletion) in matched patient (outer circle) and PDX (inner circle) tumors. Right upper panel shows tumor clonal architecture of matched patient and PDX tumors, estimated by PyClone algorithm. Line widths indicate the number of mutations in each cluster (numbers in brackets next to each cluster). Lower panel is the representative microscopic images of immunohistological analysis in matched patient and PDX tumors (100X). Immunohistochemical staining were performed for carcinoembryonic antigen (CEA), cytokeratin 7 (CK7), CK20, Ki-67, and E-cadherin.
Figure 2.
Figure 2.
Branched evolutionary processes of tumors from CRC patients with multiple organ metastasis. Phylogenetic trees were reconstructed by neighbor-joining method using patient somatic mutations from patient whole exome sequencing analysis (left; Patient somatic mutation), PDX somatic mutations from PDX WES analysis (middle left; PDX somatic mutation), PDX mRNA expression from RNA-seq analysis (middle right; PDX mRNA expression), and PDX DNA methylation analysis (left; PDX DNA methylation). Colors of each line indicate the truncal mutations (gray), mutations found only in primary tumors (green), branched mutations (yellow) and private mutations (black). Representative genes with mutations in each evolutionary process are indicated next to the branch where the mutation occurred. Angles between branches were chosen only for convenience of display.
Figure 3.
Figure 3.
Genomic distances compared to primary tumor in patient metastatic tumors and PDXs. A, Schematic presentation of analyzed tumors from patient #21 and primary tumor-derived PDXs. From primary tumor (T75), 4 tumors were metastasized to liver (T74, T79, T80 and T91), 3 tumors metastasized to regional lymph nodes (T81, T82 and T191), and 4 tumors were generated as PDXs. B, Estimates of evolutionary divergence in metastatic and PDX tumors revealed by maximum composite of somatic mutations. C, Somatic mutation distance estimates of patient metastatic tumors and PDXs compared to primary tumor.
Figure 4.
Figure 4.
Clonal architecture and clonal dynamics of tumors of CRC patients with multiple organ metastasis by SciClone analysis. In each patient, cell cluster figures represent inferred composition of subclone clusters in primary and metastasized tumors, and fish plots represents inferred schematic of clonal evolution, showing percentage of cells belonging to each primary or metastasized tumor. Each color depicted each subclone cluster (C1 to C8). In patient #21, middle lower graph shows variant allele frequency of each subclone cluster in each primary or metastasis tumor.
Figure 5.
Figure 5.
Metastasis-specific altered cancer hallmark gene sets from transcriptome and DNA methylation analysis in PDX tumors of CRC patients with multiple organ metastasis. Clustered heatmaps represent gene set activity scores calculated relative to primary tumors, which show a comparison of hallmark gene set activities between primary and metastasized tumors, from RNA sequencing (left panel) and DNA methylation sequencing (right panel). In expression analysis, red indicates that a hallmark is more active relative to primary tumor and blue indicates that a hallmark is less active. In methylation analysis, yellow indicates that a hallmark is more active relative to primary tumor and green indicates that a hallmark is less active.
Figure 6.
Figure 6.
Therapeutic heterogeneity of tumors from one CRC patient with multiple organ metastasis. A-D, Relative tumor volume of the primary and metastasis PDX tumors at the endpoint of drug treatment. Relative tumor volume was calculated as fold changes based on the mean of the vehicle-treated (control) groups for each PDX tumor. Mice were treated with 5-FU (50 mg/kg/week) + oxaliplatin (5 mg/kg/week) (5-FU/Oxa; A), lapatinib (30 mg/kg, twice a day; B), trametinib (2 mg/kg/day; C), and BYL719 (25 mg/kg/day; D). Asterisks indicate statistically significant differences (*, p < 0.05; **, p < 0.01; ***, p < 0.001) between control and drug-treated groups. E, TGFβ1 effect on sensitivity to a PI3K inhibitor, BYL719, in HEK293 cells. TGFβ1 (5 ng/ml) was treated 3 h before BYL719 treatment, and WST assays were used to examine the cytotoxic effect after 72 h treatment of BYL719 in each concentration. IC50 values for BYL719 are given. Right graph shows the effect of TGFβ1 treatment on the expression of vimentin, which is a known TGFβ1-responsive gene.

References

    1. Mehlen P, Puisieux A. Metastasis: a question of life or death. Nat Rev Cancer 2006;6:449–58. - PubMed
    1. Steeg PS. Targeting metastasis. Nat Rev Cancer 2016;16:201–18. - PMC - PubMed
    1. McGranahan N, Swanton C. Biological and therapeutic impact of intratumor heterogeneity in cancer evolution. Cancer Cell 2015;27:15–26. - PubMed
    1. Jamal-Hanjani M, Hackshaw A, Ngai Y, Shaw J, Dive C, Quezada S, et al. Tracking genomic cancer evolution for precision medicine: the lung TRACERx study. PLoS Biol 2014;12:e1001906. - PMC - PubMed
    1. Lee AJX, Endesfelder D, Rowan AJ, Walther A, Birkbak NJ, Futreal PA, et al. Chromosomal instability confers intrinsic multidrug resistance. Cancer Res 2011;71:1858–70. - PMC - PubMed

Publication types

MeSH terms