

Trace amine-associated receptor 1 (TAAR1) promotes anti-diabetic signaling in insulin-secreting cells
- PMID: 30670596
- PMCID: PMC6433058
- DOI: 10.1074/jbc.RA118.005464
Trace amine-associated receptor 1 (TAAR1) promotes anti-diabetic signaling in insulin-secreting cells
Abstract
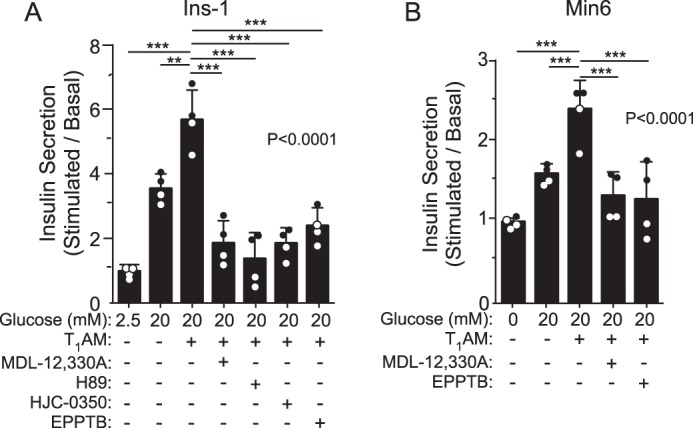
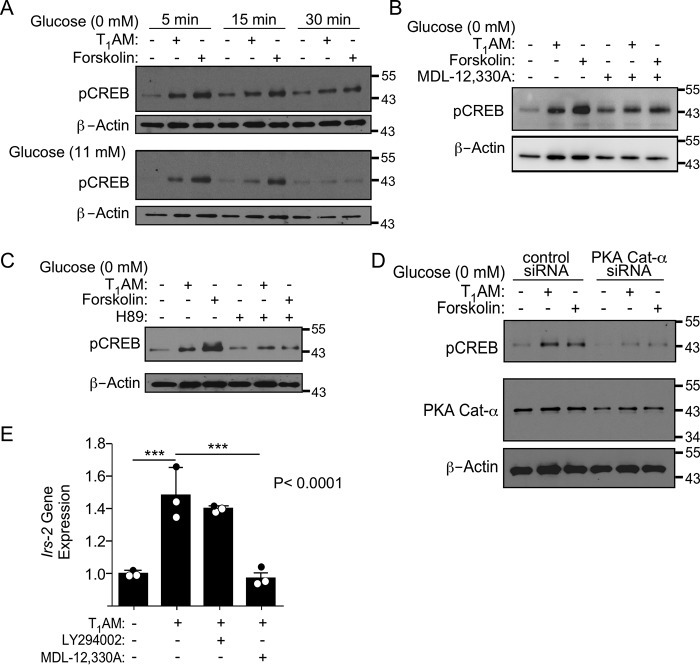
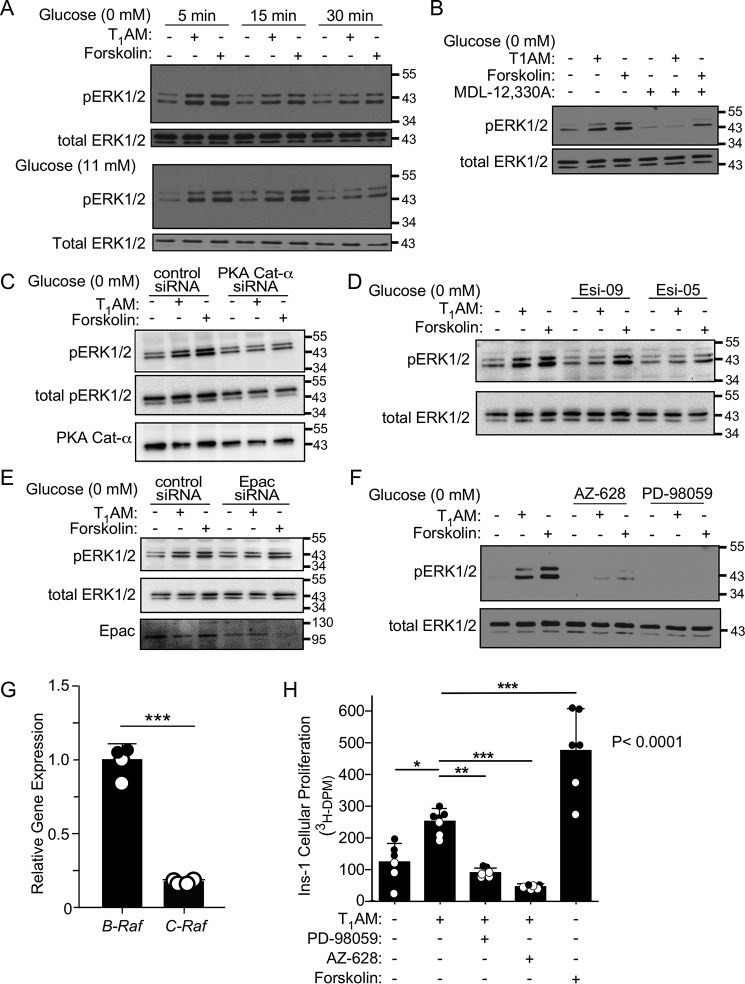
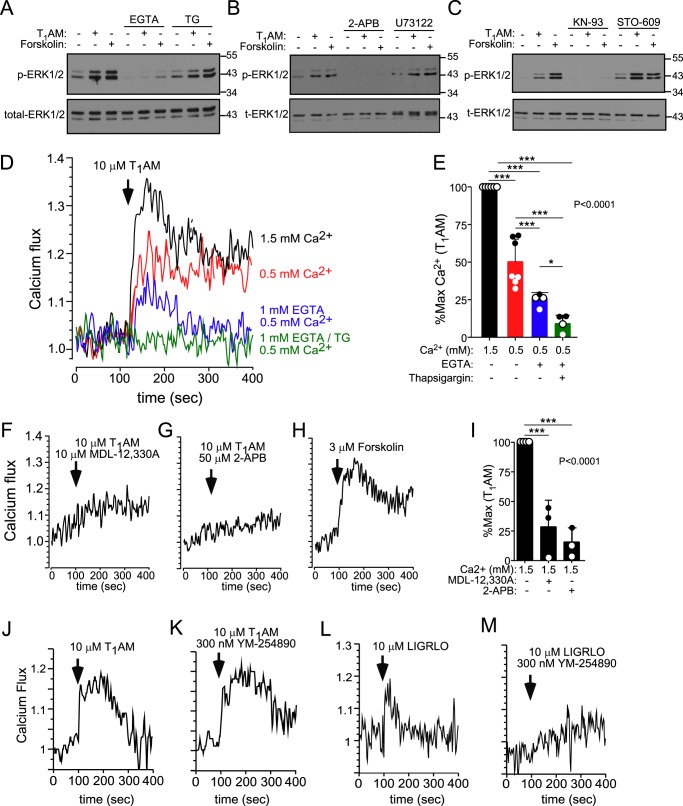
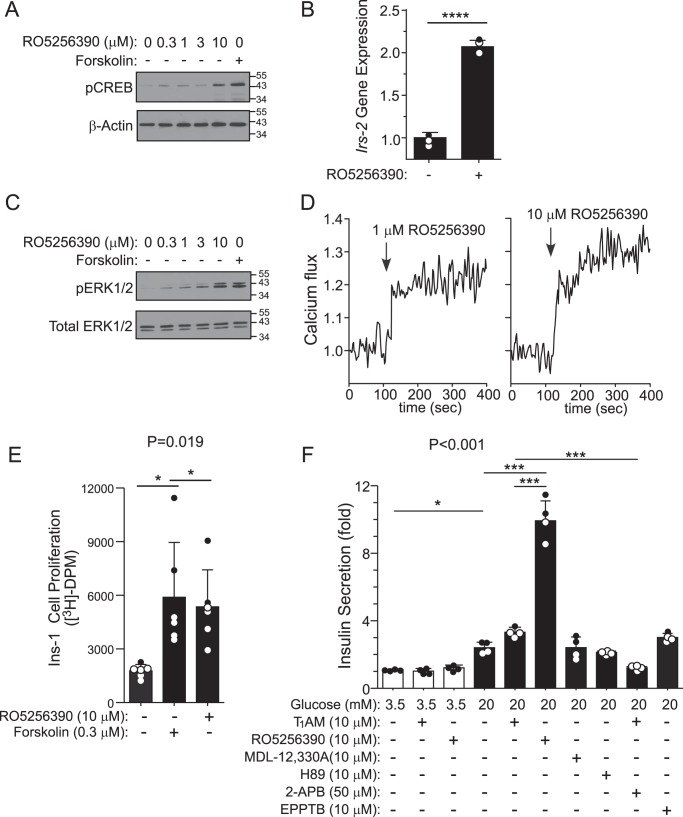
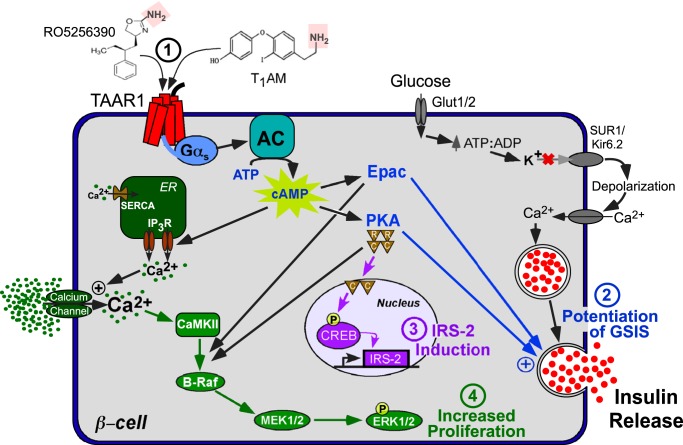
Pancreatic β-cell failure in type 2 diabetes mellitus is a serious challenge that results in an inability of the pancreas to produce sufficient insulin to properly regulate blood glucose levels. Trace amine-associated receptor 1 (TAAR1) is a G protein-coupled receptor expressed by β-cells that has recently been proposed as a potential target for improving glycemic control and suppressing binge eating behaviors. We discovered that TAAR1 is coupled to Gαs-signaling pathways in insulin-secreting β-cells to cause protein kinase A (PKA)/exchange protein activated by cAMP (Epac)-dependent release of insulin, activation of RAF proto-oncogene, Ser/Thr kinase (Raf)-mitogen-activated protein kinase (MAPK) signaling, induction of cAMP response element-binding protein (CREB)-insulin receptor substrate 2 (Irs-2), and increased β-cell proliferation. Interestingly, TAAR1 triggered cAMP-mediated calcium influx and release from internal stores, both of which were required for activation of a MAPK cascade utilizing calmodulin-dependent protein kinase II (CaMKII), Raf, and MAPK/ERK kinase 1/2 (MEK1/2). Together, these data identify TAAR1/Gαs-mediated signaling pathways that promote insulin secretion, improved β-cell function and proliferation, and highlight TAAR1 as a promising new target for improving β-cell health in type 2 diabetes mellitus.
Keywords: G protein–coupled receptor (GPCR); calcium; diabetes; insulin secretion; pancreas.
© 2019 Michael et al.
Conflict of interest statement
Dr. Kuliopulos and Dr. Covic serve as scientific founders of Oasis Pharmaceuticals. The content is solely the responsibility of the authors and does not necessarily represent the official views of the National Institutes of Health
Figures
Similar articles
-
cAMP signalling in insulin and glucagon secretion.Diabetes Obes Metab. 2017 Sep;19 Suppl 1:42-53. doi: 10.1111/dom.12993. Diabetes Obes Metab. 2017. PMID: 28466587 Review.
-
Apolipoprotein A-I increases insulin secretion and production from pancreatic β-cells via a G-protein-cAMP-PKA-FoxO1-dependent mechanism.Arterioscler Thromb Vasc Biol. 2014 Oct;34(10):2261-7. doi: 10.1161/ATVBAHA.114.304131. Epub 2014 Aug 21. Arterioscler Thromb Vasc Biol. 2014. PMID: 25147338
-
Activation of Transmembrane Bile Acid Receptor TGR5 Modulates Pancreatic Islet α Cells to Promote Glucose Homeostasis.J Biol Chem. 2016 Mar 25;291(13):6626-40. doi: 10.1074/jbc.M115.699504. Epub 2016 Jan 12. J Biol Chem. 2016. PMID: 26757816 Free PMC article.
-
PPAR-γ activation increases insulin secretion through the up-regulation of the free fatty acid receptor GPR40 in pancreatic β-cells.PLoS One. 2013;8(1):e50128. doi: 10.1371/journal.pone.0050128. Epub 2013 Jan 23. PLoS One. 2013. PMID: 23372643 Free PMC article.
-
Cooperation between cAMP signalling and sulfonylurea in insulin secretion.Diabetes Obes Metab. 2014 Sep;16 Suppl 1:118-25. doi: 10.1111/dom.12343. Diabetes Obes Metab. 2014. PMID: 25200305 Review.
Cited by
-
Urine metabolomics reveals biomarkers and the underlying pathogenesis of diabetic kidney disease.Int Urol Nephrol. 2023 Apr;55(4):1001-1013. doi: 10.1007/s11255-022-03326-x. Epub 2022 Oct 18. Int Urol Nephrol. 2023. PMID: 36255506
-
Increased Metabolic Potential, Efficacy, and Safety of Emerging Treatments in Schizophrenia.CNS Drugs. 2023 Jul;37(7):545-570. doi: 10.1007/s40263-023-01022-7. Epub 2023 Jul 20. CNS Drugs. 2023. PMID: 37470979 Free PMC article. Review.
-
Trace Amine-Associated Receptors and Monoamine-Mediated Regulation of Insulin Secretion in Pancreatic Islets.Biomolecules. 2023 Nov 5;13(11):1618. doi: 10.3390/biom13111618. Biomolecules. 2023. PMID: 38002300 Free PMC article. Review.
-
Novel 1-Amidino-4-Phenylpiperazines as Potent Agonists at Human TAAR1 Receptor: Rational Design, Synthesis, Biological Evaluation and Molecular Docking Studies.Pharmaceuticals (Basel). 2020 Nov 14;13(11):391. doi: 10.3390/ph13110391. Pharmaceuticals (Basel). 2020. PMID: 33202687 Free PMC article.
-
Modelling of p-tyramine transport across human intestinal epithelial cells predicts the presence of additional transporters.Front Physiol. 2022 Nov 10;13:1009320. doi: 10.3389/fphys.2022.1009320. eCollection 2022. Front Physiol. 2022. PMID: 36505075 Free PMC article.
References
-
- Alberti K. G., and Zimmet P. Z. (1998) Definition, diagnosis and classification of diabetes mellitus and its complications. Part 1: diagnosis and classification of diabetes mellitus provisional report of a WHO consultation. Diabet. Med. 15, 539–553 10.1002/(SICI)1096-9136(199807)15:7<539::AID-DIA668>3.0.CO;2-S - DOI - PubMed
-
- Waugh N., Cummins E., Royle P., Clar C., Marien M., Richter B., and Philip S. (2010) Newer agents for blood glucose control in type 2 diabetes: systematic review and economic evaluation. Health Technol. Assess. 14, 1–248 - PubMed
Publication types
MeSH terms
Substances
Grants and funding
LinkOut - more resources
Full Text Sources
Medical
Research Materials
Miscellaneous
