. 2019 Jan 22;10(1):e02578-18.
doi: 10.1128/mBio.02578-18.

Effects of Friend Virus Infection and Regulatory T Cells on the Antigen Presentation Function of B Cells

Affiliations

Effects of Friend Virus Infection and Regulatory T Cells on the Antigen Presentation Function of B Cells

Tyler C Moore et al. mBio. .

Abstract

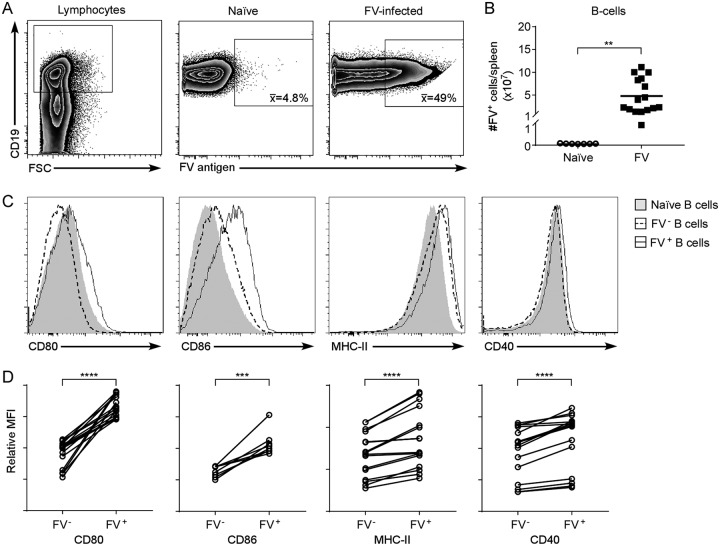
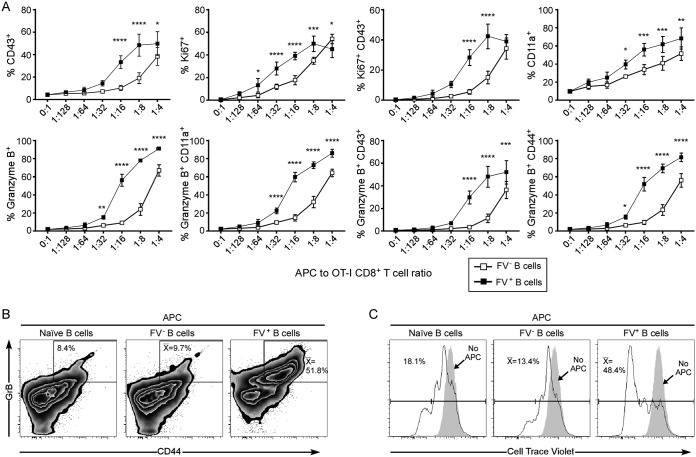
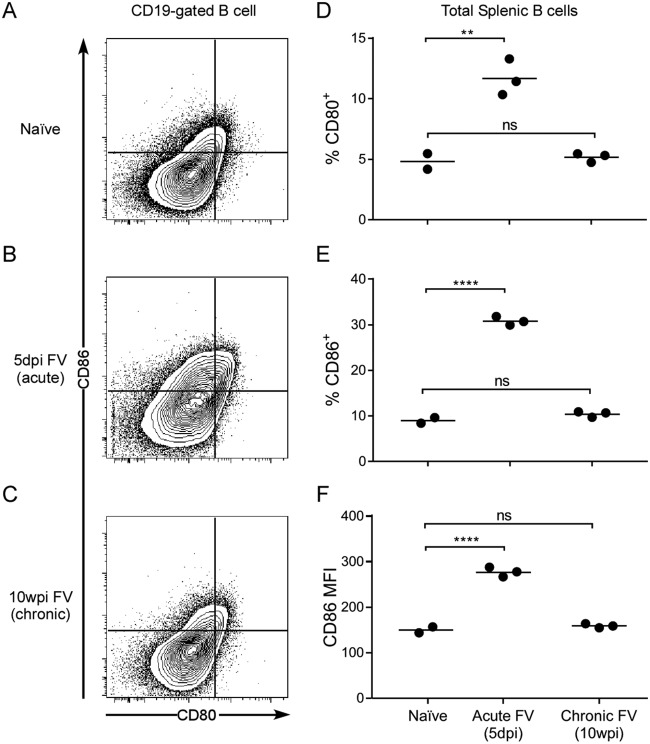
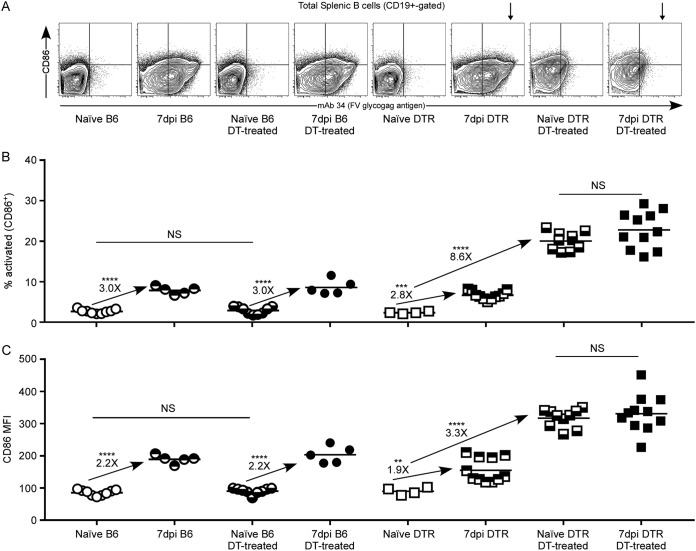
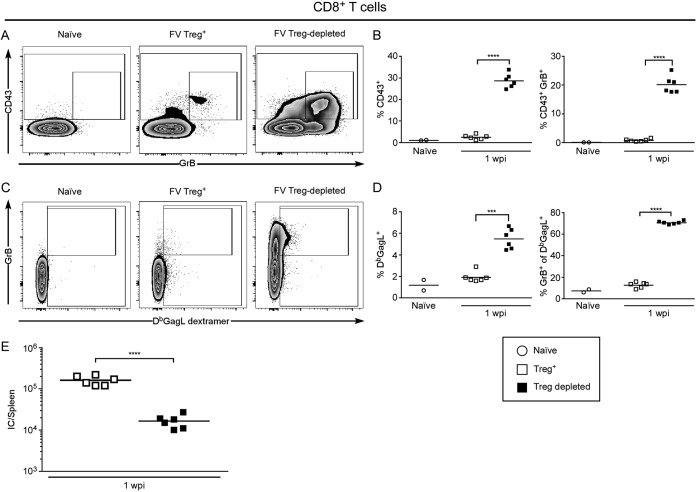
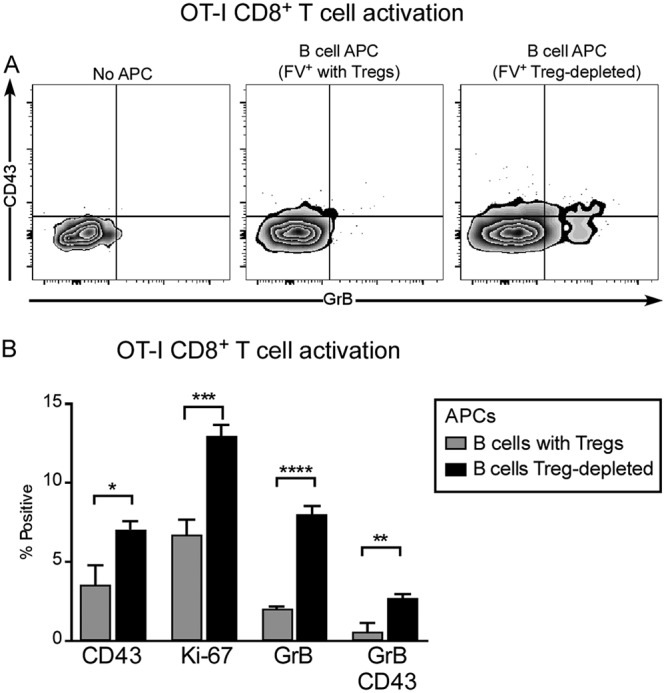
Friend virus (FV) is a naturally occurring mouse retrovirus that infects dividing cells of the hematopoietic lineage, including antigen-presenting cells (APCs). The infection of APCs by viruses often induces their dysfunction, and it has been shown that FV infection reduces the ability of dendritic cells (DCs) to prime critical CD8+ T cell responses. Nonetheless, mice mount vigorous CD8+ T cell responses, so we investigated whether B cells might serve as alternative APCs during FV infection. Direct ex vivo analysis of B cells from FV-infected mice revealed that infected but not uninfected B cells upregulated expression of the costimulatory molecules CD80, CD86, and CD40, as well as major histocompatibility complex class II (MHC-II) molecules. Furthermore, in vitro studies showed that, compared to uninfected B cells from the same mice, the FV-infected B cells had significantly enhanced APC function, as measured by their capacity to prime CD8+ T cell activation and proliferation. Thus, in contrast to DCs, infection of B cells with FV enhanced their APC capacity and ability to stimulate the CD8+ T cell responses essential for virus control. FV infections also induce the activation and expansion of regulatory T cells (Tregs), so it was of interest to determine the impact of Tregs on B cell activation. The upregulation of costimulatory molecule expression and APC function of B cells was even more strongly enhanced by in vivo depletion of regulatory T cells than infection. Thus, Tregs exert potent homeostatic suppression of B cell activation that is partially overcome by FV infection.IMPORTANCE The primary role of B cells in immunity is considered the production of pathogen-specific antibodies, but another, less-well-studied, function of B cells is to present foreign antigens to T cells to stimulate their activation and proliferation. Dendritic cells (DCs) are considered the most important antigen-presenting cells (APCs) for CD8+ T cells, but DCs lose APC function when infected with Friend virus (FV), a model retrovirus of mice. Interestingly, B cells were better able to stimulate CD8+ T cell responses when they were infected with FV. We also found that the activation status of B cells under homeostatic conditions was potently modulated by regulatory T cells. This study illustrates an important link between B cell and T cell responses and illustrates an additional mechanism by which regulatory T cells suppress critical T cell responses during viral infections.

Keywords: B-cell responses; CD8+ T cells; antigen presentation; regulatory T cells; retroviruses.


Figures

FIG 1
FIG 1
Infected B cells upregulate CD80, CD86, MHC class II, and CD40 during infection with Friend virus. Y10 mice were infected with FV, and at 5 dpi, splenocytes were processed, stained, and analyzed by flow cytometry. (A) Representative FACS plots of FV antigen (FV glycogag; MAb 34 staining) on B cells. Live splenic lymphocytes were gated on forward scatter by CD19. The mean percentage of FV+ B cells among B cells from naive or FV infected mice at 5 dpi is shown. The slight background level of FV+ B cells in the naive mice is an artifact of the two-step staining procedure requiring an anti-mouse IgG2b secondary stain. (B) Absolute numbers of B cells per spleen that stained positive for surface expression of FV glycogag in naive and FV-infected mice at 5 dpi. n = 7 and 16, respectively, for two separate experiments. Horizontal lines indicate the mean of each group. **, P < 0.01 by unpaired t test. (C) Representative histograms of CD80, CD86, MHC class II, and CD40 expression on B cells from naive mice, or FV or FV+ B cells from FV-infected mice. (D) Comparisons of relative CD80, CD86, MHC class II, and CD40 median fluorescence intensities (MFI) on uninfected (FV) and infected (FV+) B cells from FV-infected mice. The cells from individual mice are connected with a line. Each pair of connected dots represents an individual mouse. Data are from two or four pooled experiments. ***, P < 0.001, and ****, P < 0.0001, as determined by paired t test.
FIG 2
FIG 2
FV-infected B cells are better at priming naive CD8+ T cells in vitro. (A to C) Y10 mice were infected intravenously with 6,000 spleen focus-forming units of FV. At 5 dpi, spleens were harvested and FV antigen (MAb 34)-positive (FV+) or antigen-negative (FV) B cells were sorted by FACS to greater than 90% purity, incubated with OVA peptide, and used as APCs for priming of naive OT-I CD8+ T cells (as described in Materials and Methods). (A) CD43, CD11a, CD44, Ki-67, and GrB expression on OT-I CD8+ T cells was examined following priming with either no APCs (0:1), uninfected (FV) B cells, or infected (FV+) B cells from FV-infected mice at APC/OT-I CD8+ T cell ratios from 1:128 to 1:4, as indicated. (B) Representative FACS plot of GrB and CD44 expression on OT-I CD8+ T cells activated by naive B cell APCs, uninfected B cells from FV-infected mice (FV B cells), or infected B cells from FV-infected mice (FV+ B cells). The numbers in the upper-right corners represent the mean percentages of GrB and CD44 double-positive cells at a 1:16 APC/T cell ratio. (C) Representative FACS histograms showing proliferation of OT-I CD8+ T cells based on loss of CellTrace Violet stain (as described in Materials and Methods) following activation by naive B cell APCs, uninfected B cells from FV-infected mice (FV B cells), or infected B cells from FV-infected mice (FV+ B cells). The numbers are mean percentages of cells to the left of the vertical bar in the graph. The shaded histogram represents CellTrace Violet staining of OT-I CD8+ T cells cultured without any APCs as a no-priming control. The data shown are from one experiment representative of 3 independent experiments with at least 4 mice per group per experiment. In panel A, *, P < 0.05, **, P < 0.01, ***, P < 0.001, and ****, P < 0.0001, as determined by ordinary one-way analysis of variance (ANOVA) with Tukey’s posttest for multiple comparisons. In addition, two-way ANOVA showed statistically significant differences between the curves from infected versus uninfected B cell APCs (P < 0.0001).
FIG 3
FIG 3
B cell activation during chronic infection. Y10 mice were intravenously infected with ∼6,000 SFFU of FV, and spleens were harvested for examination of B cell activation by flow cytometric analysis of CD80 and CD86 on total CD19+ cells at 7 days postinfection and 10 weeks postinfection as indicated. Statistical analysis was done by one-way ANOVA with Tukey’s posttest for multiple comparisons. **, P < 0.01; ****, P < 0.0001; ns, not significant. Panels A to C show representative flow plots for each group, and panels D to F show the cumulative results.
FIG 4
FIG 4
Treg depletion enhances CD86 expression on B cells. (A to C) B6 and B6.FOXP3-DTR-GFP (DTR) mice were left uninfected or were infected with a high dose (∼20,000 SFFU) of FV and either treated with DT on days 0, 3, and 6 to deplete Tregs or left untreated. On day 7 postinfection, spleens were harvested and B cells were analyzed by flow cytometry. (A) Representative FACS plots showing CD86 expression versus FV glycogag levels on B cells from uninfected (Naive) or FV-infected (7dpi) B6 or DTR mice, either untreated or Treg depleted (DT-treated). (B and C) The percentage of (B) CD86+ and (C) CD86 MFI on B cells from the specified groups of mice. In panels B and C, each symbol represents an individual mouse. Numbers above arrows indicate fold differences between indicated groups. Results are compiled from 3 separate experiments. Lines indicate the mean from each group. **, P < 0.01, ***, P < 0.001, and ****, P < 0.0001, as determined by one-way ANOVA with Tukey’s posttest for multiple comparisons. NS, not significant.
FIG 5
FIG 5
Treg depletion during FV infection enhances CD8+ T cell activation. (A to E) B6.FOXP3-DTR-GFP mice were infected with FV and treated with DT on days 0, 3, and 6 (Treg-depleted), or left untreated (Treg+). At 1 week postinfection (wpi), spleens were harvested, CD8+ T cells were analyzed by flow cytometry, and FV infectious centers (IC) were determined. (A and B) CD8+ T cell activation as measured by expression of the activation-induced isoform of CD43 and granzyme B (GrB) expression. (C and D) Analysis of CD8+ T cells specific for FV Db-GagL peptides as measured by dextramer binding and activation as measured by GrB expression. The cells in panels B and D, left, were gated on live CD8+ T cells. The cells in panel D, right, were gated on live dextramer-positive CD8+ T cells. (A and C) Representative FACS plots. (B and D) Quantification of pooled data. In panels B and D, each dot represents an individual mouse from one of two separate experiments. (E) The numbers of FV infectious centers per spleen were determined at 1 wpi in mice left untreated or depleted of Tregs by treatment with DT on days 0, 3, and 6. Each dot represents an individual mouse. Lines indicate the mean of each group. ***, P < 0.001, and ****, P < 0.0001, as determined by Student's t test.
FIG 6
FIG 6
B cells from Treg-depleted mice more potently prime naive CD8+ T cells. (A and B) Naïve or FV-infected B6.FOXP3-DTR-GFP mice were treated with DT (Treg-depleted) or left untreated (Treg+). At 7 dpi, spleens were harvested, and CD19+ B cells were bead purified, incubated with OVA peptide, and used as APCs for naive OT-I CD8+ T cells as described in Materials and Methods. (A) Representative FACS plots for CD43 and GrB expression by OT-I CD8+ T cells following priming with B cell APCs from FV-infected, or FV-infected DT-treated mice at a 1:8 APC/T cell ratio. The leftmost panel of OT-I CD8+ T cells without APCs was used as a no-priming control. (B) Summary of OT-I CD8+ T cell activation based on percentage of CD43+, Ki-67+, GrB+, or CD43+ GrB+. Bars represent the mean ± standard error of the mean (SEM) from 3 to 8 independent APC/T cell replicates from 5 to 10 pooled mice for APCs or 5 mice for OT-I CD8+ T cells. In panel B, *, P < 0.05, **, P < 0.01, ***, P < 0.001, and ****, P < 0.0001, between indicated groups as determined by Student's t test.

Similar articles

Cited by

References

    1. Sevilla N, Kunz S, Holz A, Lewicki H, Homann D, Yamada H, Campbell KP, de La Torre JC, Oldstone MB. 2000. Immunosuppression and resultant viral persistence by specific viral targeting of dendritic cells. J Exp Med 192:1249–1260. doi:10.1084/jem.192.9.1249. - DOI - PMC - PubMed
    1. Sevilla N, Kunz S, McGavern D, Oldstone MB. 2003. Infection of dendritic cells by lymphocytic choriomeningitis virus. Curr Top Microbiol Immunol 276:125–144. - PMC - PubMed
    1. Sevilla N, McGavern DB, Teng C, Kunz S, Oldstone MB. 2004. Viral targeting of hematopoietic progenitors and inhibition of DC maturation as a dual strategy for immune subversion. J Clin Invest 113:737–745. doi:10.1172/JCI20243. - DOI - PMC - PubMed
    1. Ng CT, Sullivan BM, Oldstone MB. 2011. The role of dendritic cells in viral persistence. Curr Opin Virol 1:160–166. doi:10.1016/j.coviro.2011.05.006. - DOI - PMC - PubMed
    1. Li P, Wang N, Zhou D, Yee CS, Chang CH, Brutkiewicz RR, Blum JS. 2005. Disruption of MHC class II-restricted antigen presentation by vaccinia virus. J Immunol 175:6481–6488. doi:10.4049/jimmunol.175.10.6481. - DOI - PubMed

Publication types

MeSH terms