. 2019 Jan 22;12(565):eaan8680.
doi: 10.1126/scisignal.aan8680.

Transcriptional repressor REST drives lineage stage-specific chromatin compaction at Ptch1 and increases AKT activation in a mouse model of medulloblastoma

Affiliations

Transcriptional repressor REST drives lineage stage-specific chromatin compaction at Ptch1 and increases AKT activation in a mouse model of medulloblastoma

Tara H W Dobson et al. Sci Signal. .

Abstract

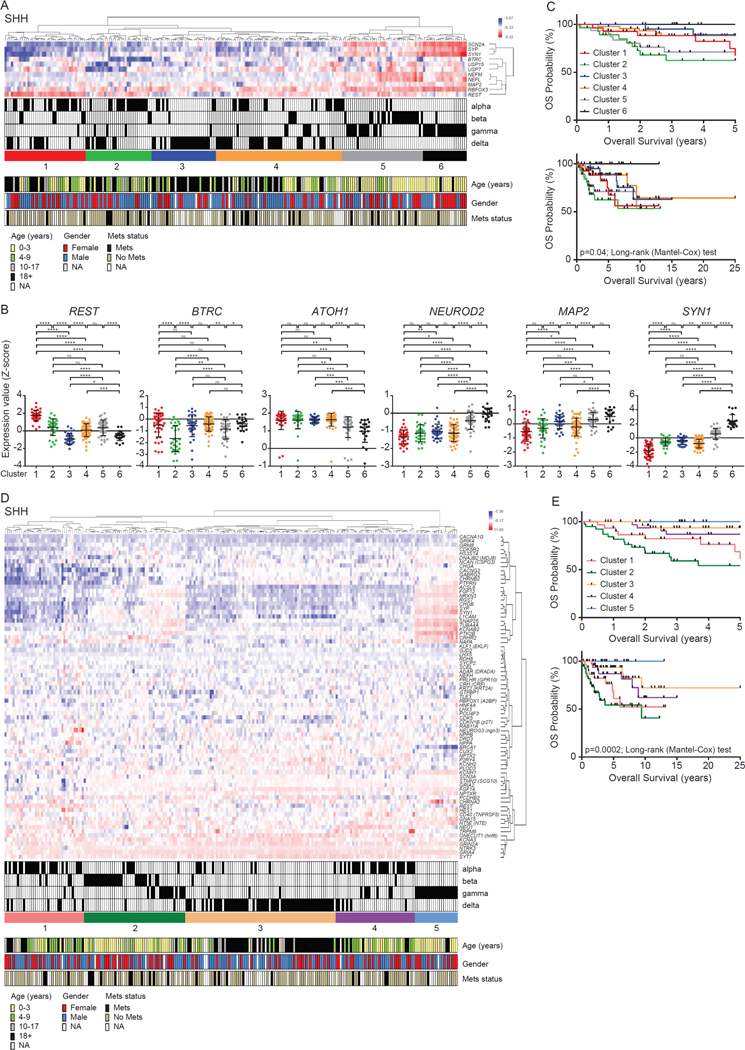
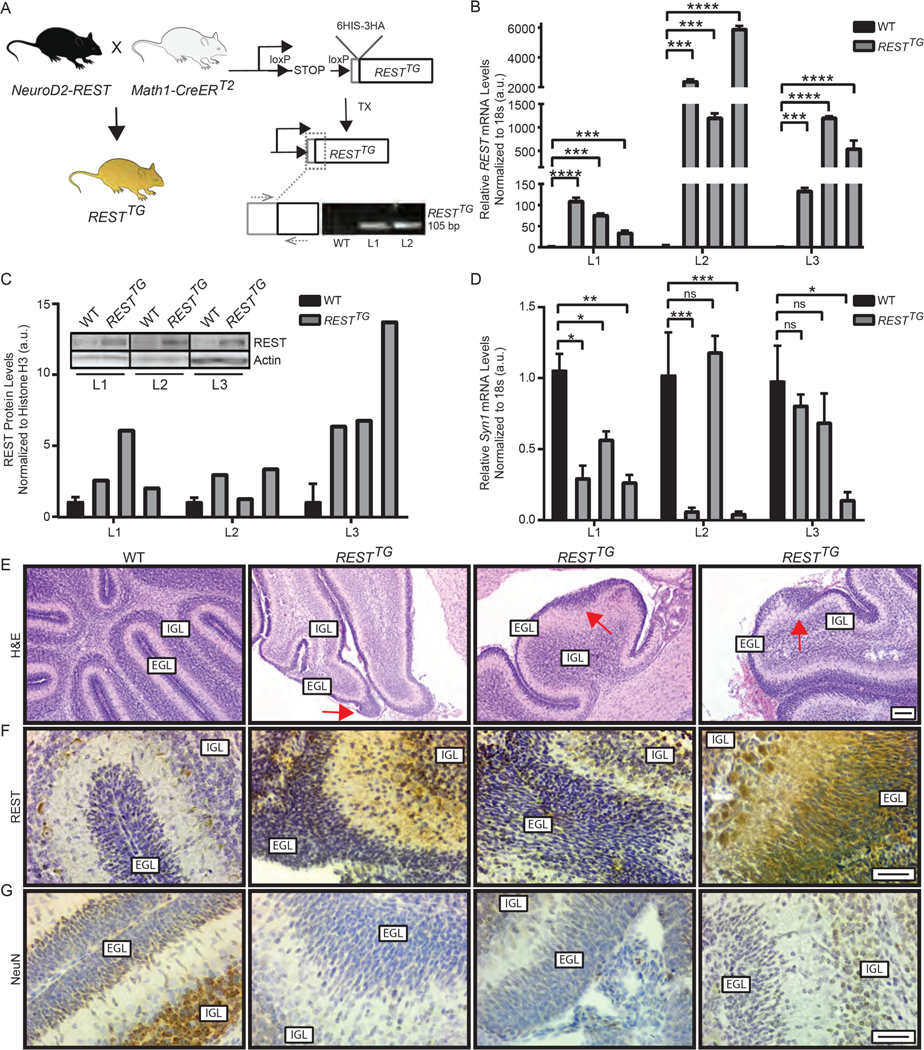
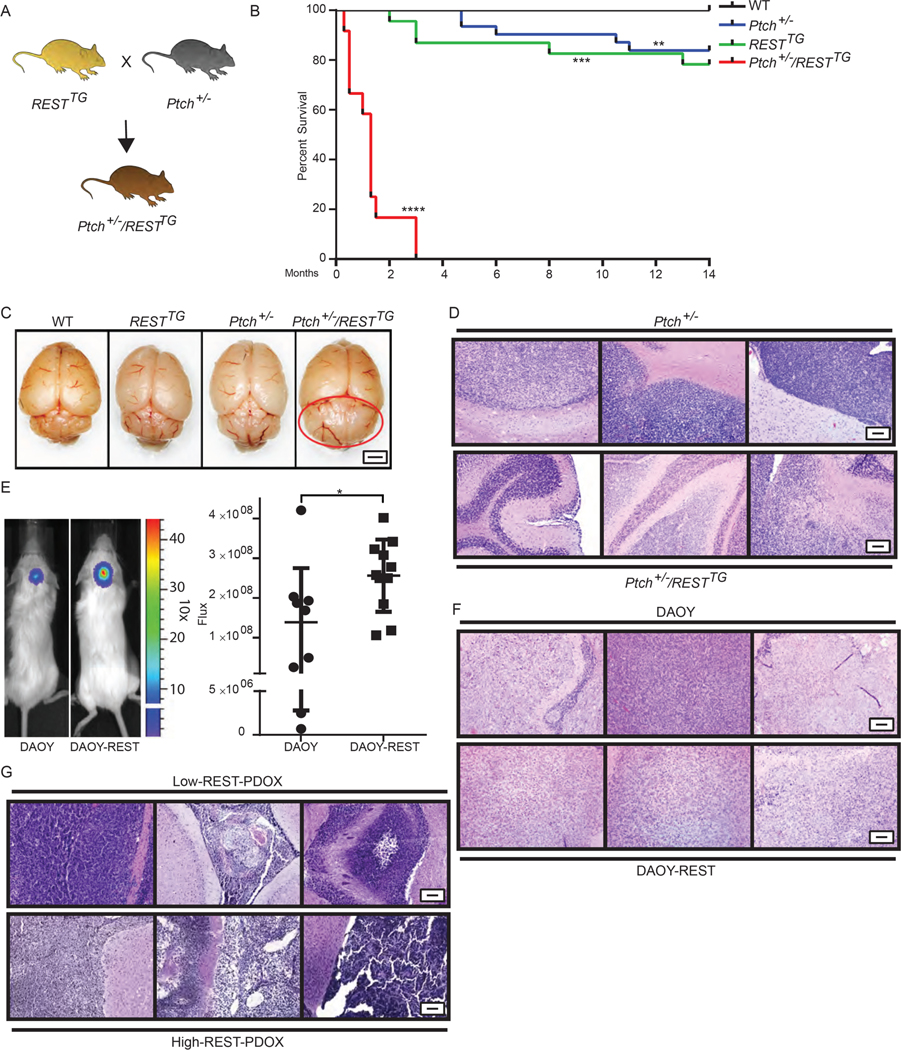
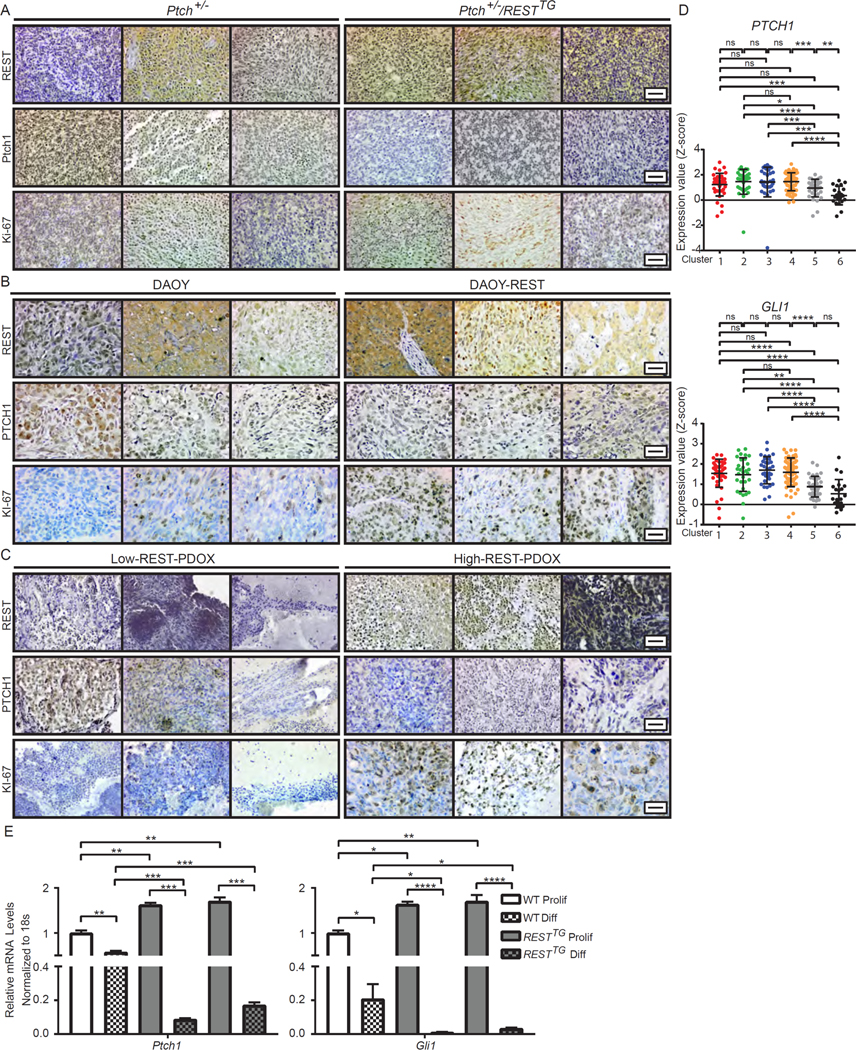
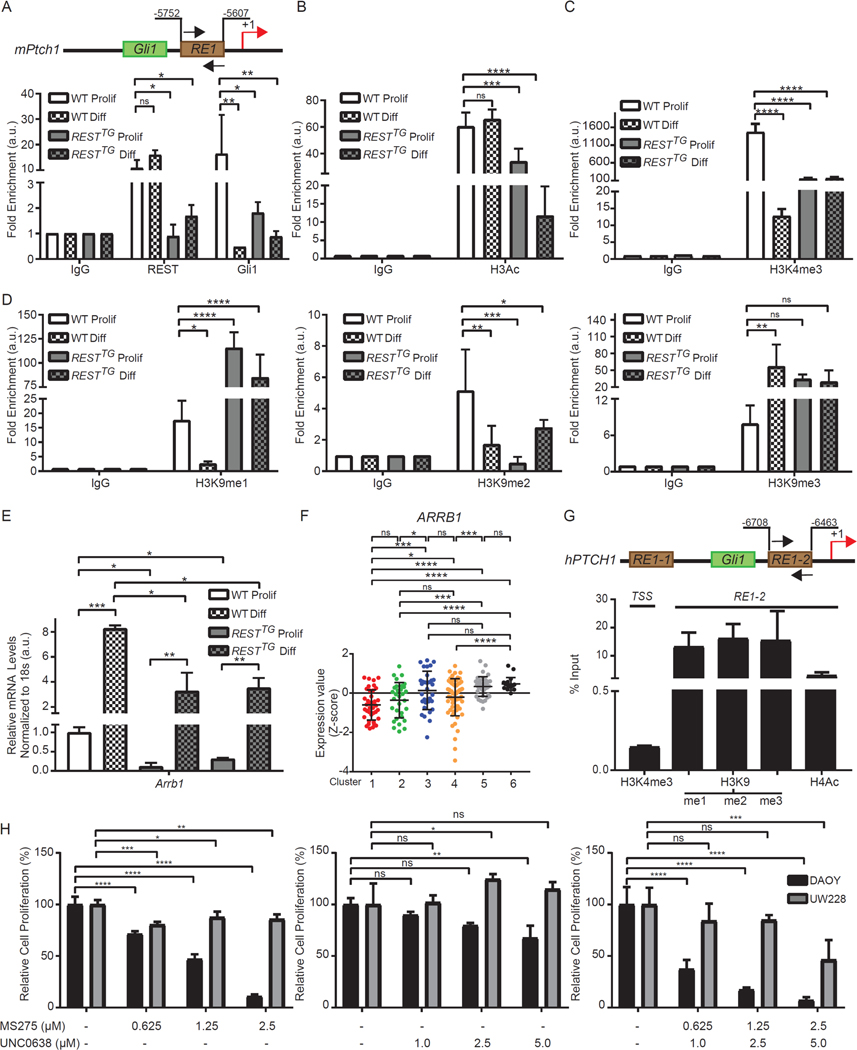
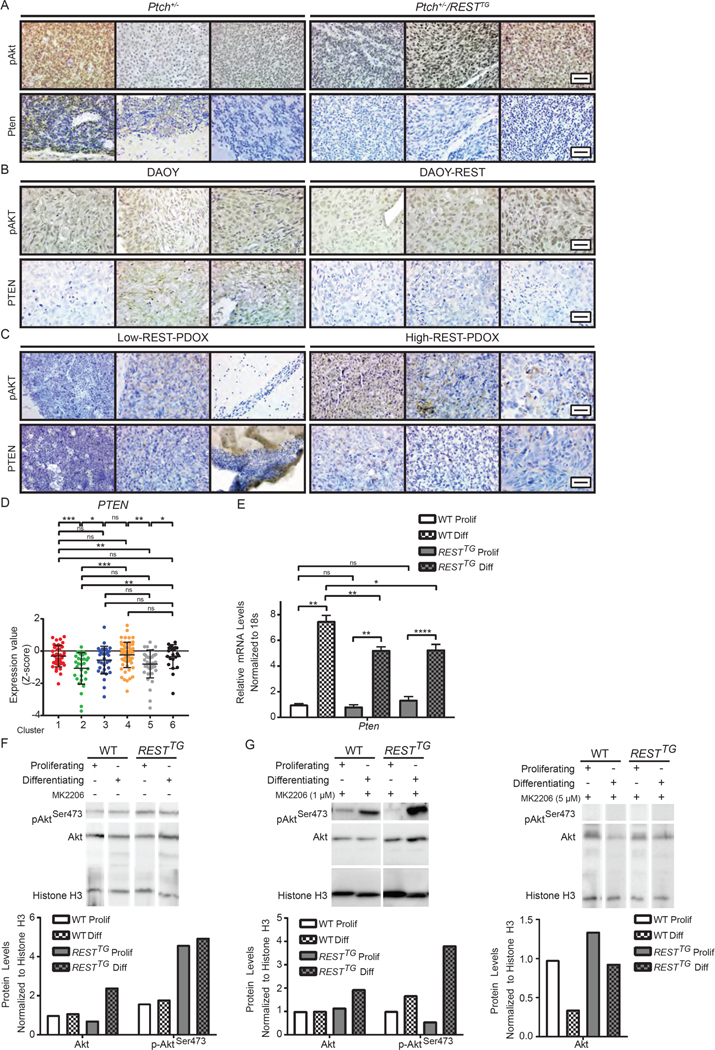
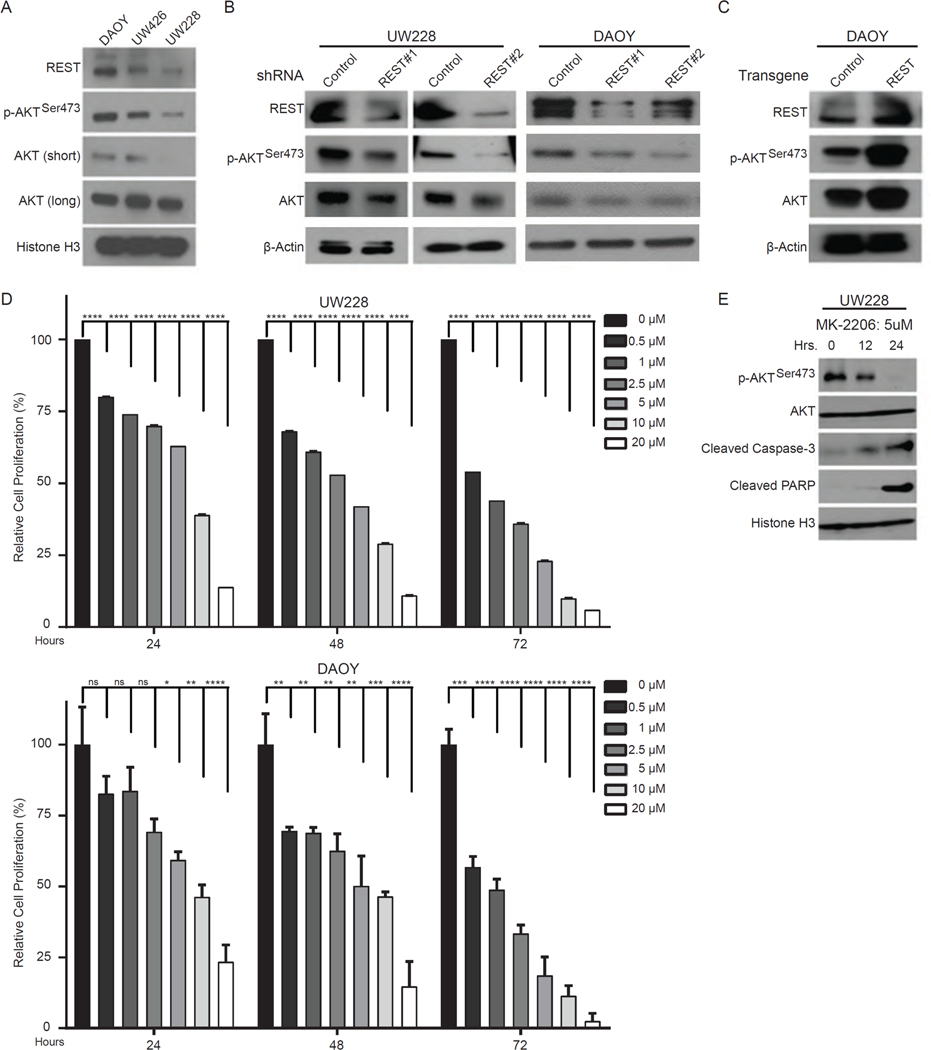
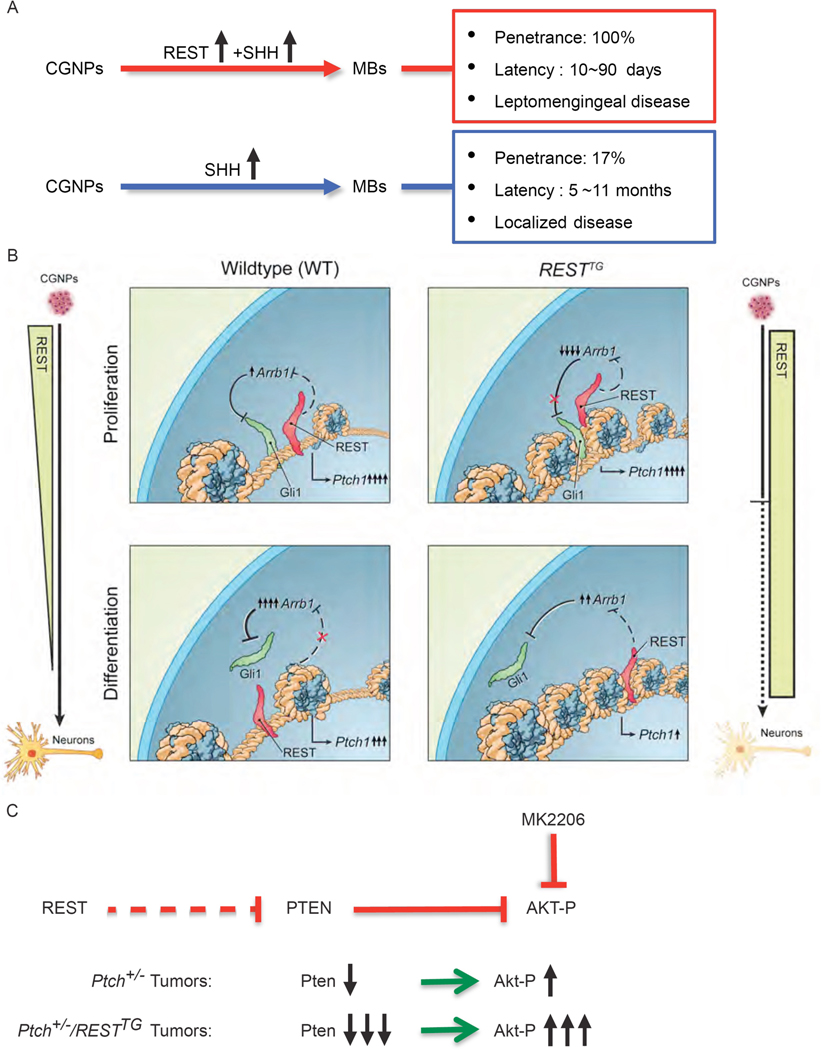
In medulloblastomas (MBs), the expression and activity of RE1-silencing transcription factor (REST) is increased in tumors driven by the sonic hedgehog (SHH) pathway, specifically the SHH-α (children 3 to 16 years) and SHH-β (infants) subgroups. Neuronal maturation is greater in SHH-β than SHH-α tumors, but both correlate with poor overall patient survival. We studied the contribution of REST to MB using a transgenic mouse model (RESTTG ) wherein conditional NeuroD2-controlled REST transgene expression in lineage-committed Ptch1 +/- cerebellar granule neuron progenitors (CGNPs) accelerated tumorigenesis and increased penetrance and infiltrative disease. This model revealed a neuronal maturation context-specific antagonistic interplay between the transcriptional repressor REST and the activator GLI1 at Ptch1 Expression of Arrb1, which encodes β-arrestin1 (a GLI1 inhibitor), was substantially reduced in proliferating and, to a lesser extent, lineage-committed RESTTG cells compared with wild-type proliferating CGNPs. Lineage-committed RESTTG cells also had decreased GLI1 activity and increased histone H3K9 methylation at the Ptch1 locus, which correlated with premature silencing of Ptch1 These cells also had decreased expression of Pten, which encodes a negative regulator of the kinase AKT. Expression of PTCH1 and GLI1 were less, and ARRB1 was somewhat greater, in patient SHH-β than SHH-α MBs, whereas that of PTEN was similarly lower in both subtypes than in others. Inhibition of histone modifiers or AKT reduced proliferation and induced apoptosis, respectively, in cultured REST-high MB cells. Our findings linking REST to differentiation-specific chromatin remodeling, PTCH1 silencing, and AKT activation in MB tissues reveal potential subgroup-specific therapeutic targets for MB patients.


Figures

Figure 1:
Figure 1:. Clinical characteristics based on gene expression profiles.
(A) Hierarchical clustering analysis of SHH MB patient samples using gene expression. Hierarchical clustering assay identified six distinct clusters based on expression profiles of neuronal differentiation markers (www.ncbi.nlm.nih.gov/geo; dataset GSE85217). The blue to red color scale indicates the expression level (Z-score). The key, clinical information (subtype, age, gender and metastasis status) regarding patient samples, is provided beneath. (B) Gene expression profiles measured by microarray in six clusters. Each dot corresponds to one individual patient. Data show individual variability and means with S.D. ns; not significant, *; p<0.05, **; p<0.01, ***; p<0.001, ****; p<0.0001. (C) Overall survival of six clusters in SHH MB patients (p-value; log rank Mantel-Cox test). (D) Hierarchical clustering analysis of SHH MB patient samples using gene expression. Hierarchical clustering assay identified five distinct clusters based on expression profiles of REST target genes. The blue to red color scale indicates the expression level based on Z-score. The clinical information (subtype, age, gender and metastasis status) regarding patient samples was shown in the bottom panel. (E) Overall survival of five clusters in SHH MB patients (p-value; log rank Mantel-Cox test).
Figure 2:
Figure 2:. Generation and characterization of a novel genetically engineered mouse model with increased REST expression in CGNPs.
(A) Schema to describe generation of a conditional RESTTG mouse model. Primers targeting the 6HIS-3HA tag and 5’end of the hREST cDNA were used for genotyping. Agarose gel of PCR product from WT, line 1 (L1) and line 2 (L2), is shown. (B and C) CGNPs harvested from postnatal day 8 (p8) pups that received TX injections on p2, p3 and p4 were cultured for up to 15 days. Cells were collected and analyzed for (B) REST Tg mRNA expression by qRT-PCR analyses and (C) REST protein abundance by Western blotting. Data are mean ± S.D. of 3 individual pups. Representative Westerns are shown. (D) Neuronal differentiation in CGNPs was evaluated by qRT-PCR measurement of Syn1 mRNA expression. Data are mean ± S.D. of 3 individual pups. (E) H&E staining of brain tissue from p8 WT (n=3) or RESTTG (n=3) pups injected with tamoxifen (TX). (F and G) Sections were analyzed by IHC for (F) REST and (G) NeuN expression using specific antibodies to assess protein expression in CGNPs in the external granule layer (EGL) and granule neurons of the internal granule layer (IGL) (n=3). For (B-C), Bars represent mean with standard deviations of fold changes relative to WT controls. p values for qRT-PCR were calculated by paired two-tailed t test of ΔCp values: significance is indicated as not significant (ns), p<0.05 (*), p<0.01 (**), p<0.001 (***), or p<0.0001 (****). Densitometry was obtained using Image Lab software (Bio-Rad). For (E), scale bar = 50 μm (10X). For (F, and G), scale bars = 20 μm (40X).
Figure 3:
Figure 3:. REST elevation alters kinetics and penetrance of Shh-driven MB development.
(A) Schema to describe generation of Ptch+/−/RESTTG mice. (B) Survival of WT (n=45), RESTTG (n=23), Ptch+/− (n=31), and Ptch+/−/RESTTG (n=13) mice following TX administration to induce REST Tg expression in RESTTG and Ptch+/−/RESTTG mice was assessed by Kaplan Meier analysis. (C) Representative gross images of brains from p40 WT, RESTTG, Ptch+/− and Ptch+/−/RESTTG mice are shown (n=3). Red circle indicates cerebellar tumor in p40 Ptch+/−/RESTTG mice. Scale bar = 2 mm. (D) H&E staining of brain tissue from Ptch+/− and Ptch+/−/RESTTG animals (n=3) are shown. (E) Immunodeficient mice bearing cerebellar xenografts of human DAOY cells expressing endogenous REST (n=9) or hREST (DAOY-REST (n=11) were monitored for tumor growth by BLI. Images of representative mice and relative flux for the entire cohort are shown prior to euthanasia on day 47 due to tumor burden. P values were obtained using Student t test. H&E staining of brain tissue from (F) DAOY and DAOY-REST xenografts (n=3), and (G) Low REST and High REST patient derived MB xenografts (PDOX) (n=3) are shown. For (D, F, and G), scale bars = 50 μm (10X).
Figure 4:
Figure 4:. REST downregulates PTCH1 expression.
(A to C) Cerebellar sections of (A) Tumor-bearing Ptch+/− and Ptch+/−/RESTTG mice (n=3) and (B) DAOY and DAOY-REST xenografts (n=3) and (C) human SHH subgroup patient derived xenografts (n=3) were analyzed by IHC for REST, PTCH1, and KI-67 expression using specific antibodies. (D) PTCH1 and GLI1 mRNA expression profiles measured by microarray. Hierarchical clustering based on expression levels of neuronal differentiation markers divided the SHH MB patient samples into six distinct clusters. Each dot corresponds to one individual patient. (E) Ptch1 and Gli1 mRNA expression was measured in WT (white bars) and RESTTG (gray bars) CGNPs after culturing with proliferation or differentiation media. WT data represents the mean ± S.D. from triplicate samples, RESTTG data represents two individual pups. Graph represents fold change compared to WT proliferating controls. For (A, B, and C), scale bars = 20 μm (40X). For (E), p values were calculated by paired two-tailed t test of ΔCp values: significance is indicated as not significant (ns), p<0.05 (*), p<0.01 (**), p<0.001 (***), or p<0.0001 (****).
Figure 5:
Figure 5:. Transcription factor binding and resulting histone modification changes leads to Ptch1 loss of heterozygosity.
(A) Schematic representation of mPtch1 promoter with RE1 site and adjacent Gli1 binding site are shown. REST and Gli1 binding to RE1 site on mPtch1 promoter measured by ChIP-qPCR in WT and RESTTG proliferating and differentiating CGNPs. Data are represented as fold change over IgG (n=3 for WT and n=6 for RESTTG ). (B) Enrichment of H3Ac over IgG at mPtch1 promoter in proliferating and differentiating CGNPs. Bars represent fold change of H3Ac over IgG in the samples (n=3 for WT and n=6 for RESTTG ).(C) Enrichment of trimethylation at Histone H3 lysine 4 (H3K4me3) evaluated by ChIP-qPCR at the mPtch1 TSS site in WT and RESTTG proliferating and differentiating CGNPs (n=3). (D) Enrichment of mono, di and trimethylation at Histone H3 lysine 9 (H3K9me1, 2 and 3) evaluated by ChIP-qPCR at the mPtch1 RE1 site in WT and RESTTG proliferating and differentiating CGNPs (n=3). (E) Arrb1 mRNA expression was measured in WT and RESTTG CGNPs after culturing with proliferation or differentiation media. WT data represents the mean ± S.D. from triplicate samples, RESTTG data represents two individual pups.Graph represents fold change compared to WT proliferating controls. (F) ARRB1 mRNA expression profile measured by microarray. Hierarchical clustering based on expression levels of neuronal differentiation markers divided the SHH MB patient samples into six distinct clusters. Each dot corresponds to one individual patient. (G) Enrichment of H3K4me3 at hPTCH1 TSS and enrichment of other histone modifications at hPTCH1 RE1 site using ChIP-qPCR from a High-REST PDOX sample. (H) DAOY MB cell line treated with either HDAC inhibitor MS275 (0.625 μM to 5 μM) or G9a inhibitor UNC0638 (0.5 μM to 5 μM), or a combination of both, and MTT assay was performed at 48 hours post treatment to measure cell viability. Bars represent mean with S.D. of triplicate. For (A –D), statistical significance was obtained using two-way ANOVA in the Graphpad software and p values calculated using Dunnett’s method for multiple comparisons. For (E), p values were calculated by paired two-tailed t test of ΔCp values: significance is indicated as not significant (ns), p<0.05 (*), p<0.01 (**), p<0.001 (***), or p<0.0001 (****). For (H), statistical significance was calculated using two-way ANOVA in the Graphpad software and p values were measured by multiple comparisons using either Sidak or Tukey’s test (Graphpad 7.0).
Figure 6:
Figure 6:. REST elevation in the context of constitutive SHH signaling results in AKT hyperactivation.
(A to C) IHC was performed with p-AKTSer473 or PTEN specific antibodies in (A) Ptch+/− and Ptch+/−/RESTTG tumors (n=3) (B) DAOY and DAOY-REST xenografts (n=3) and (C) human SHH- subgroup patient derived xenografts (n=3). (D) PTEN mRNA expression profile was measured by microarray. Hierarchical clustering based on expression levels of neuronal differentiation markers divided the SHH MB patient samples into six distinct clusters. Each dot corresponds to one individual patient. (E) Pten mRNA expression was measured in WT and\RESTTG CGNPs after culturing with proliferation or differentiation media. Graph represents fold change compared to WT proliferating controls. WT data represents the mean ± S.D. from triplicate samples, RESTTG data represents two individual pups. (F) Western blot analysis was used to measure p-AktSer473 and total Akt protein expression in WT (n=2) and RESTTG (n=2) CGNPs after culturing with proliferation or differentiation media. Representative Western images of p-AktSer473, Akt, and input control histone H3 are shown. (G) p-AktSer473 and total Akt protein expression were measured after 5 hours of treatment of proliferating and differentiating WT and RESTTG CGNPs with MK2206 (1 or 5μM) (n=2). Representative Western images of p-AktSer473, Akt and histone H3 (control) are shown. For (A, B, and C), scale bars = 20 μm (40X). For (E), p values for qRT-PCR were calculated by paired two-tailed t test of ΔCp values: significance is indicated as not significant (ns), p<0.05 (*), p<0.01 (**), p<0.001 (***), or p<0.0001 (****).
Figure 7:
Figure 7:. REST-dependent AKT phosphorylation in MB cell lines.
(A) Western blotting for basal protein abundance of REST, p-AKTSer473, total AKT, and histone H3 (control) in DAOY, UW426 and UW228 cells. Representative blots are shown; long/short indicate exposure times. (B and C) Western blotting for total and phosphorylated (p-AKTSer473) protein abundance after either (B) shRNA-mediated REST knockdown in UW228 and DAOY cells or (C) REST overexpression in DAOY cells. Blots are representative images of 3 experiments. (D) MTT assay-derived proliferation of UW228 and DAOY cells treated with various doses of MK2206 for 24, 48 or 72 hours. Data are means ± S.D. of 3 independent assays. (E) Western blotting for abundance of p-AKTSer473, total AKT, cleaved Caspase-3, cleaved PARP and histone H3 (control) to assess induction of apoptosis following treatment of UW228 cells with MK2206 (5 μM) for 12 or 24 hours. Representative blots are shown (n=3).
Figure 8:
Figure 8:. Increased REST expression drives progression of SHH-driven MBs.
(A) Schematic representation of tumor characteristics obtained from CGNPs with perturbed SHH signaling in the presence of absence of increased REST expression. (B) Graphical representation of REST-dependent chromatin remodeling of the Ptch1 gene in WT or RESTTG CGNPs during proliferation and differentiation. (C) Model depicting REST regulation of AKT signaling in SHH-driven MBs.

References

    1. Coluccia D, Figuereido C, Isik S, Smith C, Rutka JT, Medulloblastoma: Tumor Biology and Relevance to Treatment and Prognosis Paradigm. Current neurology and neuroscience reports 16, 43 (2016). - PubMed
    1. Kool M, Korshunov A, Remke M, Jones DT, Schlanstein M, Northcott PA, Cho YJ, Koster J, Schouten-van Meeteren A, van Vuurden D, Clifford SC, Pietsch T, von Bueren AO, Rutkowski S, McCabe M, Collins VP, Backlund ML, Haberler C, Bourdeaut F, Delattre O, Doz F, Ellison DW, Gilbertson RJ, Pomeroy SL, Taylor MD, Lichter P, Pfister SM, Molecular subgroups of medulloblastoma: an international meta-analysis of transcriptome, genetic aberrations, and clinical data of WNT, SHH, Group 3, and Group 4 medulloblastomas. Acta Neuropathol 123, 473–484 (2012). - PMC - PubMed
    1. Rusert JM, Wu X, Eberhart CG, Taylor MD, Wechsler-Reya RJ, SnapShot: Medulloblastoma. Cancer cell 26, 940–940 e941 (2014). - PMC - PubMed
    1. Taylor MD, Northcott PA, Korshunov A, Remke M, Cho YJ, Clifford SC, Eberhart CG, Parsons DW, Rutkowski S, Gajjar A, Ellison DW, Lichter P, Gilbertson RJ, Pomeroy SL, Kool M, Pfister SM, Molecular subgroups of medulloblastoma: the current consensus. Acta Neuropathol 123, 465–472 (2012). - PMC - PubMed
    1. Koestner A, Swenberg JA, Wechsler W, Transplacental production with ethylnitrosourea of neoplasms of the nervous system in Sprague-Dawley rats. Am J Pathol 63, 37–56 (1971). - PMC - PubMed

Publication types

MeSH terms