. 2019 Feb 5;116(6):1934-1939.
doi: 10.1073/pnas.1806562116. Epub 2019 Jan 22.

Accelerating changes in ice mass within Greenland, and the ice sheet's sensitivity to atmospheric forcing

Affiliations

Accelerating changes in ice mass within Greenland, and the ice sheet's sensitivity to atmospheric forcing

Michael Bevis et al. Proc Natl Acad Sci U S A. .

Abstract

From early 2003 to mid-2013, the total mass of ice in Greenland declined at a progressively increasing rate. In mid-2013, an abrupt reversal occurred, and very little net ice loss occurred in the next 12-18 months. Gravity Recovery and Climate Experiment (GRACE) and global positioning system (GPS) observations reveal that the spatial patterns of the sustained acceleration and the abrupt deceleration in mass loss are similar. The strongest accelerations tracked the phase of the North Atlantic Oscillation (NAO). The negative phase of the NAO enhances summertime warming and insolation while reducing snowfall, especially in west Greenland, driving surface mass balance (SMB) more negative, as illustrated using the regional climate model MAR. The spatial pattern of accelerating mass changes reflects the geography of NAO-driven shifts in atmospheric forcing and the ice sheet's sensitivity to that forcing. We infer that southwest Greenland will become a major future contributor to sea level rise.

Keywords: GNET; GRACE; NAO; SMB; mass acceleration.


Conflict of interest statement

The authors declare no conflict of interest.

Figures

Fig. 1.
Fig. 1.
(A) The GRACE mass change solution integrated over Greenland (blue circles) and the mass trajectory model (MTM) fit to these data during the reference period, 2003.0–2013.4, and extrapolated to the end of the time series (solid red curve). The dashed red curve is the quadratic trend component of the MTM. The cyclical component of the MTM (shown in C) was removed from the data and the model in A to produce the blue dots and the red curve in B. The extrapolated portion of this curve is dashed. The residuals (data, MTM) in D constitute mass anomalies. That portion of B comprising the 2013–2014 Pause is shown in more detail in E. (F) Interannual variations in summertime SMB (JJAS) from the climate models MAR and RACMO2 compared with the summertime NAO index (JJAS). (G) The distribution of all interannual changes in NAO JJAS between 1950 and 2015. NF, # frequencies; NP=2, quadratic trend; MAX, maximum; MIN, minimum; SLTM, standard linear trajectory model.
Fig. 2.
Fig. 2.
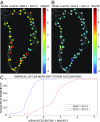
Mean station accelerations in uplift for two overlapping 5-y time periods. (A) Mean accelerations in the period that began in 2008.4, or when each GNET GPS station was established (if afterward), and ended in 2013.4. (B) The mean accelerations in the time interval 2010.4–2015.4. (C) Empirical cumulative distribution functions (CDFs) for the accelerations in each time period. U-Accel, vertical acceleration.
Fig. 3.
Fig. 3.
The combined daily uplift anomalies for 46 GNET stations, and the traveling 25th, 50th, and 75th percentiles of this data cloud. The uplift anomaly is defined as the difference between the observed uplift and a trajectory model consisting of a quadratic trend and a four-term Fourier series fit to all data in a reference period ending in 2013.4. The median anomaly displaces sharply downward at 2013.4 and never returns to zero. NF, # frequencies; NP=2, quadratic trend; SLTM, standard linear trajectory model.
Fig. 4.
Fig. 4.
(AC) Cumulative mass loss since 2003.12, after the mean seasonal cycle is removed, in millimeters of water equivalent (w.e.), or kilograms per square meter. (D–F) Instantaneous mass rates implied by the quadratic trend model, that is, decycled mass rate, in millimeters per year of water equivalent.
Fig. 5.
Fig. 5.
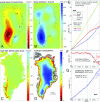
(A) The seasonally adjusted mean mass acceleration field for the time period 2003.12–2013.46, in millimeters per square year of water equivalent. (B) The spatial structure of the “2013–2014 mass anomaly” defined as the mass residual field at epoch 2014.45. Note the negative correlation of A and B. (C) The temporal trend in SMB estimated using MAR during the years 2004–2012. The units, millimeters per square year, match those of subplot A. (D) Surface elevation of the GrIS. The 1,750-m above sea level (ASL) contour (black curve) was added to emphasize lateral variability of the mean topographic slope near the ice margin, and changes in the margin-perpendicular width of the zones in which the ice surface lies below some reference height such as 500, 1,000, or 1,750 m ASL. (E) Precipitation, runoff, and SMB for Greenland as a whole, from MAR. (F) Greenland’s cumulative (CUM) SMB anomaly relative to 1980–2002. (G) Cumulative runoff in southwest Greenland from MAR.

References

    1. Velicogna I, Wahr J. Acceleration of Greenland ice mass loss in spring 2004. Nature. 2006;443:329–331. - PubMed
    1. Khan SA, Wahr J, Bevis M, Velicogna I, Kendrick E. Spread of ice mass loss into northwest Greenland observed by GRACE and GPS. Geophys Res Lett. 2010;37:L06501.
    1. Harig C, Simons FJ. Mapping Greenland’s mass loss in space and time. Proc Natl Acad Sci USA. 2012;109:19934–19937. - PMC - PubMed
    1. Wouters B, et al. GRACE, time-varying gravity, Earth system dynamics and climate change. Rep Prog Phys. 2014;77:116801. - PubMed
    1. Van den Broeke MR, et al. On the recent contribution of the Greenland ice sheet to sea level change. Cryosphere. 2016;10:1933–1946.

Publication types