. 2019 Feb 5;116(6):2354-2363.
doi: 10.1073/pnas.1819971116. Epub 2019 Jan 22.

Phosphoproteomics of Arabidopsis Highly ABA-Induced1 identifies AT-Hook-Like10 phosphorylation required for stress growth regulation

Affiliations

Phosphoproteomics of Arabidopsis Highly ABA-Induced1 identifies AT-Hook-Like10 phosphorylation required for stress growth regulation

Min May Wong et al. Proc Natl Acad Sci U S A. .

Abstract

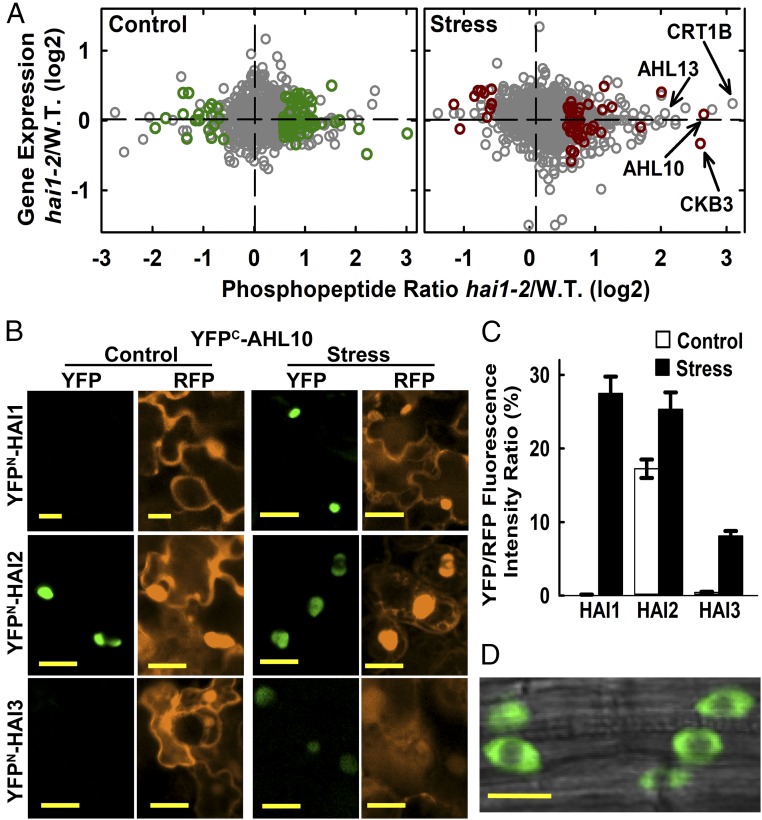
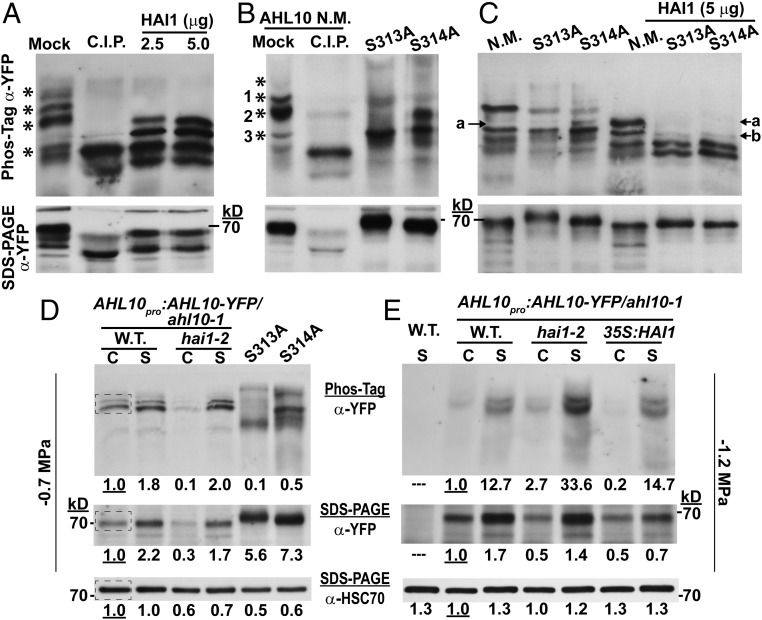
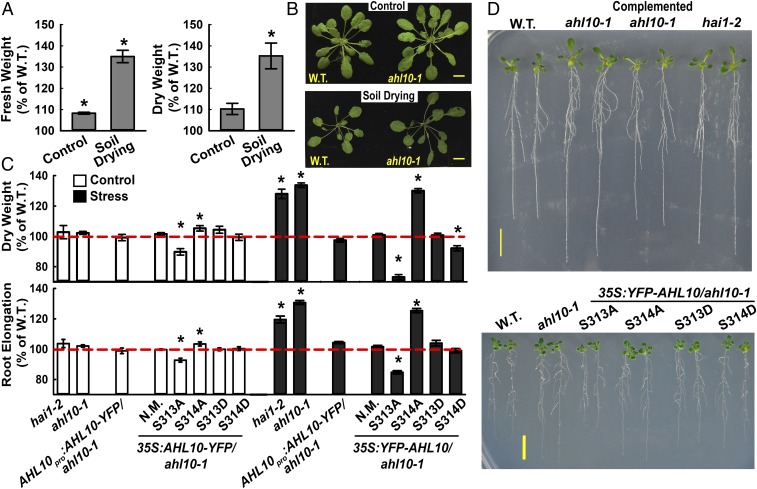
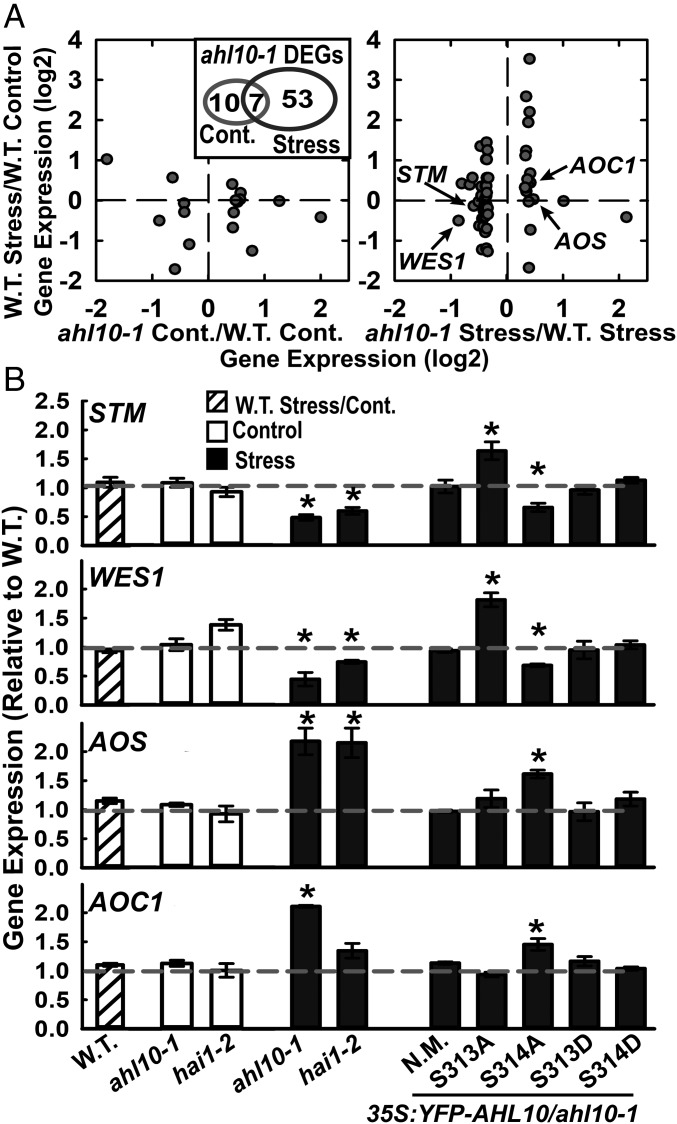
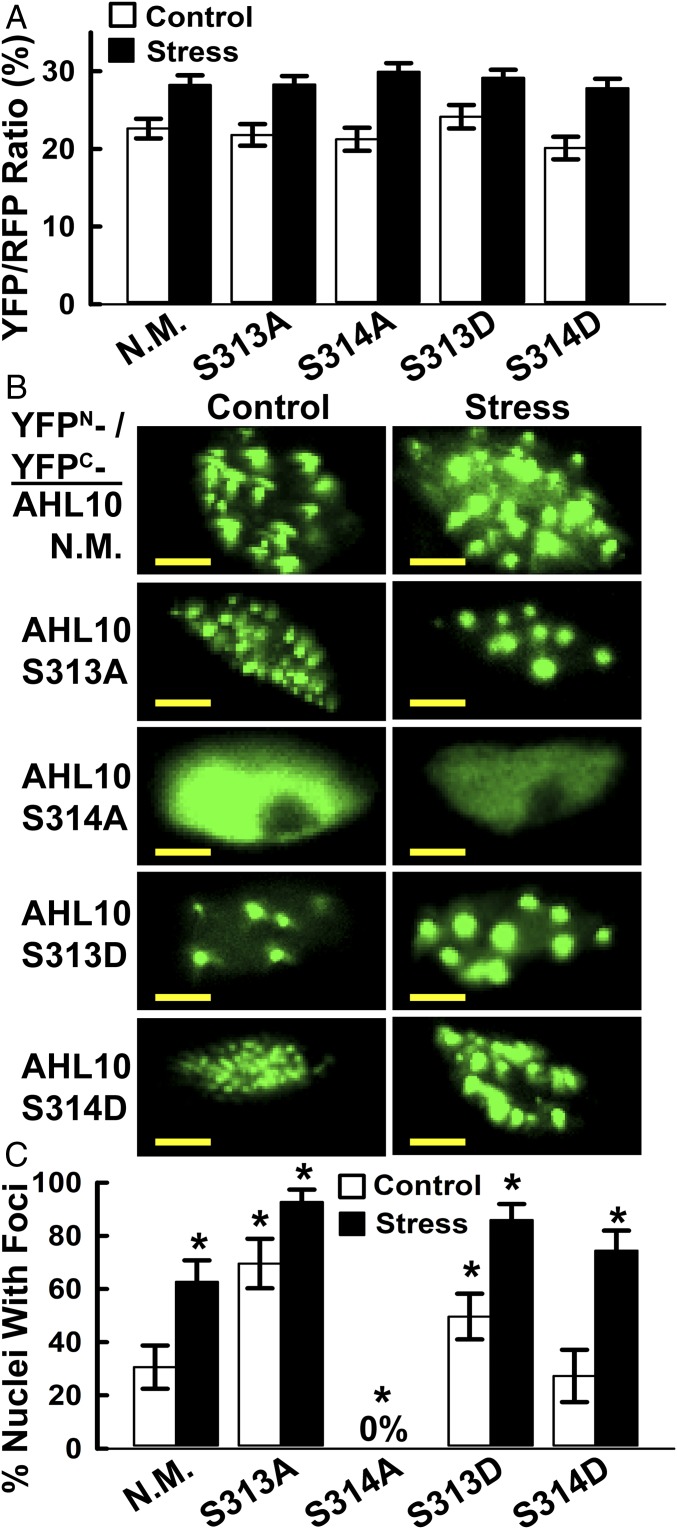
The clade A protein phosphatase 2C Highly ABA-Induced 1 (HAI1) plays an important role in stress signaling, yet little information is available on HAI1-regulated phosphoproteins. Quantitative phosphoproteomics identified phosphopeptides of increased abundance in hai1-2 in unstressed plants and in plants exposed to low-water potential (drought) stress. The identity and localization of the phosphoproteins as well as enrichment of specific phosphorylation motifs indicated that these phosphorylation sites may be regulated directly by HAI1 or by HAI1-regulated kinases including mitogen-activated protein kinases, sucrose non-fermenting-related kinase 2, or casein kinases. One of the phosphosites putatively regulated by HAI1 was S313/S314 of AT-Hook-Like10 (AHL10), a DNA-binding protein of unclear function. HAI1 could directly dephosphorylate AHL10 in vitro, and the level of HAI1 expression affected the abundance of phosphorylated AHL10 in vivo. AHL10 S314 phosphorylation was critical for restriction of plant growth under low-water potential stress and for regulation of jasmonic acid and auxin-related gene expression as well as expression of developmental regulators including Shootmeristemless These genes were also misregulated in hai1-2 AHL10 S314 phosphorylation was required for AHL10 complexes to form foci within the nucleoplasm, suggesting that S314 phosphorylation may control AHL10 association with the nuclear matrix or with other transcriptional regulators. These data identify a set of HAI1-affected phosphorylation sites, show that HAI1-regulated phosphorylation of AHL10 S314 controls AHL10 function and localization, and indicate that HAI1-AHL10 signaling coordinates growth with stress and defense responses.

Keywords: AT-hook; drought; phosphoproteomics; phosphorylation; protein phosphatase.


Conflict of interest statement

The authors declare no conflict of interest.

Figures

Fig. 1.
Fig. 1.
Phosphoproteomics of hai1-2 identifies a set of HAI1-affected phosphoproteins, including AHL10. (A) Phosphopeptide abundance versus gene expression for hai1-2 compared with wild type. Dark green or red symbols indicate phosphopeptides with significantly increased or decreased abundance (unadjusted P ≤ 0.05 by one sample t-test and fold change ≥1.5) in hai1-2 compared with wild type for control and stress (−1.2 MPa, 96 h) treatments (Datasets S2 and S3). Other phosphopeptide data are plotted using gray symbols (Dataset S1). Transcriptome analysis of hai1-2 has been previously described (15). (B) rBiFC assays of HAI PP2C interaction with AHL10. Interactions were tested by transient expression in Arabidopsis seedlings under unstressed control conditions or after transfer to −1.2 MPa for 48 h before imaging. Red fluorescent protein (RFP) panels show fluorescence of the constitutively expressed RFP reporter used to normalize the YFP fluorescence. (Scale bars, 20 μm.) (C) Relative quantification of rBiFC interactions shown in B. The mean fluorescence intensity was measured for individual cells, and the ratio of YFP to RFP intensity was calculated. Data are ±SE (n = 20–25) combined from two independent experiments. (D) AHL10 localization in plants expressing AHL10promoter:AHL10-YFP in the ahl10-1 mutant background. Cells in the root tip of unstressed seedlings are shown. An essentially identical localization pattern was observed in stress-treated seedlings. (Scale bar, 10 μm.)
Fig. 2.
Fig. 2.
Phosphorylated AHL10 increases under stress and can be directly dephosphorylated by HAI1. (A) AHL10-YFP immunoprecipitated from AHL10promoter:AHL10-YFP/ahl10-1hai1-2 plants after exposure to −1.2-MPa stress was dephosphorylated using recombinant HAI1 or C.I.P. Aliquots of the same samples were run on Phos-tag gel or SDS/PAGE. Asterisks (*) along the Phos-tag blot indicate phosphorylated forms of AHL10 that were dephosphorylated (shifted down in the Phos-tag gel) by C.I.P. treatment. The expected molecular weight of AHL10-YFP is 69 kDa. The experiment was repeated with consistent results. (B) Phos-tag gel analysis of N.M. AHL10 as well phospho-null AHL10 (AHL10S313A, AHL10S314A) immunoprecipitated from plants expressing 35S:YFP-AHL10 in the ahl10-1 mutant background. Experimental conditions were the same as for A, and asterisks mark bands of phosphorylated AHL10 present in the N.M. lane that are eliminated by C.I.P. treatment. The expected molecular weight of YFP-AHL10 is 70 kDa. (C) In vitro dephosphorylation of N.M. and phospho-null AHL10 (AHL10S313A, AHL10S314A) immunoprecipitated from plants expressing 35S:YFP-AHL10 in the ahl10-1 mutant background. Experimental conditions were the same as in A except that less starting protein was used for the AHL10S313A and AHL10S314A immunoprecipitation compared with N.M. AHL10 (75 vs. 100 μg, respectively) to ensure that a similar amount of all AHL10 isoforms was used in the dephosphorylation assay. (D) Phos-tag gel analysis of AHL10promoter:AHL10-YFP/ahl10-1 and AHL10promoter:AHL10-YFP/ahl10-1hai1-2 total protein extracted from seedlings in the control (C) and −0.7-MPa stress (S) treatments. Aliquots of the same samples were run on Phos-tag (Top) and SDS/PAGE (Middle) gels, and band intensities of AHL10-YFP were quantified. For comparison total protein extract from 35S:YFP-AHL10 S313A or S314A (in the ahl10-1 mutant background) in the −0.7 MPa treatment was also analyzed. Each lane was loaded with 25 μg of protein. Blots from the SDS/PAGE separation were first probed with anti-YFP to detect AHL10 and then stripped and reprobed with anti-HSC70 as a loading control. The dashed box in the wild-type control lanes indicates the region selected from each lane for quantification of band intensities. Band intensities relative to the wild-type unstressed control are indicated by the numbers below each lane. Note that unphosphorylated AHL10 could not be resolved on these Phos-tag gels because of the relatively low protein loading and long run time needed to resolve phosphorylated AHL10 in total protein extracts. (E) Effect of HAI1 on in vivo phosphorylation status of AHL10 in the −1.2-MPa treatment analyzed by introducing AHL10promoter:AHL10-YFP/ahl10-1 into hai1-2 and 35S:FLAG-HAI1 backgrounds. Aliquots of the same samples were run on Phos-tag (Top) and SDS/PAGE (Middle) gels, and band intensities of AHL10-YFP were quantified (25 µg protein loaded per lane for both gels). The SDS/PAGE blot was stripped and reprobed to detect HSC70 as a loading control. “C” indicates samples from the unstressed control while “S” indicates stress treatment (−1.2 MPa, 96 h). The experiment was repeated with consistent results. Numbers below each lane indicate relative quantitation of band intensities from the same regions of interest indicated in D.
Fig. 3.
Fig. 3.
AHL10 phosphorylation at S314 is critical for growth suppression during low ψw stress. (A) Relative Rosette fresh weight and dry weight of ahl10-1 compared with Col-0 wild type in control or soil-drying treatments (mean ± SE, n = 14–16 combined from three independent experiments). Asterisks (*) indicate significant difference (P ≤ 0.05) compared with wild type (100%) by one-sample t test. Wild-type mean rosette fresh weight across all three experiments was 256.2 ± 23.8 mg and 72.3 ± 4.2 mg in the well-watered control and soil-drying treatments, respectively. Wild-type mean dry weight was 18.3 ± 1.8 mg and 7.4 ± 0.4 mg in the control and soil-drying treatments, respectively. (B) Representative rosettes of the wild type and ahl10-1 in control and soil-drying treatments. (Scale bars, 1 cm.) (C) Root elongation and dry weight of seedlings under control and low ψw stress (−0.7 MPa) conditions. Data are relative to the Col-0 wild type (mean ± SE, n = 30–45, combined from three independent experiments). Asterisks (*) indicate significant difference compared with the wild type by one-sample t-test (P ≤ 0.05). Dashed red line indicates the wild-type level (100%). Seedling weights and root elongation of Col-0 wild type used for normalization are shown in SI Appendix, Fig. S9. The mean dry weight of wild-type seedlings was 0.64 ± 0.01 mg and 0.67 ± 0.02 mg in the control and −0.7-MPa stress treatment, respectively. The mean root elongation of wild type was 63.9 ± 0.26 mm and 22.5 ± 0.3 mm in the control and −0.7-MPa treatments, respectively (these data are also shown in SI Appendix, Fig. S9D). Note that three independent transgenic lines were analyzed for each construct, and the combined data of all three are shown. For the 35S:YFP-AHL10/ahl10, N.M. indicates nonmutated (i.e., wild type) AHL10. (D) Representative seedlings of Col-0 wild type (W.T.), ahl10-1, AHL10promoter:AHL10-YFP/ahl10-1 (Complemented ahl10-1), and hai1-2 as well as ahl10-1 complemented with phospho-null AHL10 (S313A, S314A) or phosphomimic AHL10 (S313D, S314D) were all expressed under control of the 35S promoter (35S:YFP-AHL10/ahl10-1). Five-day-old seedlings were transferred to −0.7 MPa, and pictures were taken 10 d after transfer when the quantitation of root elongation and seedling weight was performed. (Scale bars, 1 cm.)
Fig. 4.
Fig. 4.
AHL10 regulation of development and hormone-related genes during low ψw stress also depends upon S314 phosphorylation. (A) Differentially expressed genes (DEGs) in ahl10-1 discovered by RNAseq. Genes with differential expression in ahl10-1 under either control or stress (−0.7 MPa, 96 h) plotted versus their expression in wild-type stress versus wild-type control. Inset shows the overlap between genes with differential expression in ahl10-1 in control or stress treatments. (B) qPCR assay of selected genes in stress (−0.7 MPa, 96 h) versus control for wild type as well as assay of ahl10-1, hai1-2, and AHL10 phosphomimic and null complementation lines. Data are shown as expression relative to wild type and are means ± SE (n = 3) combined from three independent experiments. Asterisks (*) indicate significant difference compared with wild type in the same treatment (or wild-type stress versus control) by one-sample t-test (P ≤ 0.05). Gray dashed line indicates the wild-type level (set to 1).
Fig. 5.
Fig. 5.
rBiFC analysis of self-interaction and nuclear foci localization of phosphomimic and phospho-null AHL10. (A) Quantification of relative self-interaction intensity for phosphomimic and phospho-null AHL10. Data are means ± SE (n = 10–20) combined from two independent experiments. None of the phosphomimic or phospho-null constructs differed significantly from wild type (N.M) AHL10 in either stress or control treatments (t-test P ≤ 0.05). Images of AHL10 self-interaction rBiFC assays are shown in SI Appendix, Fig. S13. (B) Representative images of nuclear foci localization of AHL10 self-interaction complexes observed in rBiFC assays. For N.M. wild-type AHL10 and phosphomimic AHL10S313D and AHL10S314D, representative images of nuclei without foci are shown in SI Appendix, Fig. S13B. Note that nuclei with foci were never observed for AHL10S314A. (Scale bars, 5 μm.) (C) Portion of nuclei with AHL10 foci. Individual nuclei (80–130 for each construct and treatment, combined from two independent experiments) were counted. Error bars indicate 95% confidence intervals, and asterisks indicate significant difference compared with wild type in the same treatment (or difference of wild-type stress versus control) based on Fisher’s exact test (P ≤ 0.05).

References

    1. Finkelstein R. Abscisic acid synthesis and response. Arabidopsis Book. 2013;11:e0166. - PMC - PubMed
    1. Verslues PE. ABA and cytokinins: Challenge and opportunity for plant stress research. Plant Mol Biol. 2016;91:629–640. - PubMed
    1. Cutler SR, Rodriguez PL, Finkelstein RR, Abrams SR. Abscisic acid: Emergence of a core signaling network. Annu Rev Plant Biol. 2010;61:651–679. - PubMed
    1. Raghavendra AS, Gonugunta VK, Christmann A, Grill E. ABA perception and signalling. Trends Plant Sci. 2010;15:395–401. - PubMed
    1. de Zelicourt A, Colcombet J, Hirt H. The role of MAPK modules and ABA during abiotic stress signaling. Trends Plant Sci. 2016;21:677–685. - PubMed

Publication types

LinkOut - more resources