. 2019 Feb 5;116(6):1958-1967.
doi: 10.1073/pnas.1800853116. Epub 2019 Jan 22.

Microbe-focused glycan array screening platform

Affiliations

Microbe-focused glycan array screening platform

Andreas Geissner et al. Proc Natl Acad Sci U S A. .

Abstract

Interactions between glycans and glycan binding proteins are essential for numerous processes in all kingdoms of life. Glycan microarrays are an excellent tool to examine protein-glycan interactions. Here, we present a microbe-focused glycan microarray platform based on oligosaccharides obtained by chemical synthesis. Glycans were generated by combining different carbohydrate synthesis approaches including automated glycan assembly, solution-phase synthesis, and chemoenzymatic methods. The current library of more than 300 glycans is as diverse as the mammalian glycan array from the Consortium for Functional Glycomics and, due to its microbial focus, highly complementary. This glycan platform is essential for the characterization of various classes of glycan binding proteins. Applications of this glycan array platform are highlighted by the characterization of innate immune receptors and bacterial virulence factors as well as the analysis of human humoral immunity to pathogenic glycans.

Keywords: antiglycan antibodies; bacterial lectins; glycan arrays; immune receptors; microbial antigens.


Figures

Fig. 1.
Fig. 1.
Strategies to procure glycans for microarray experiments. The library contains synthetic, structurally well-defined glycans rather than carbohydrates isolated from natural sources. Automated glycan assembly allows for high diversity while reducing workload. Highly complex glycans containing difficult linkages or rare monosaccharides are accessed via complementary methods.
Fig. 2.
Fig. 2.
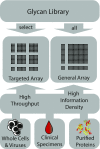
Glycan selection for microarray printing. Based on the experimental design, different glycans are printed onto standard microarray slides. Special targeted arrays are designed to contain glycan subsets for high-throughput screening of various sample types. The influenza hemagglutinin structure used for illustration in the figure is based on data from ref. .
Fig. 3.
Fig. 3.
Analysis of the MPS glycan library (version 2015) for glycan array surface immobilization. (A) Distribution of organisms from which the glycans originate, number of glycans equipped with thiol- or aminolinker, and size distribution of glycans. (B) Clustering of compounds of the MPS library and the set immobilized on the CFG mammalian array according to glycan similarity (45). Each line terminus represents one glycan with MPS glycans colored in orange, CFG in blue, and structures contained in both sets as well as inner branches leading to structures of both sets colored in green.
Fig. 4.
Fig. 4.
Quality control of printed glycan arrays with known GBPs and analysis of healthy human sera. (AC) Binding pattern of plant lectins Con A (ConA, A), soybean agglutinin (SBA, B), and WGA (C) on a glycan array printed with 140 amino-linked glycans. Compounds are arranged to separate expected binders (left, orange and blue background) from glycans with no known specificity for the respective lectin. Each data point is the mean of four spots from two independent experiments normalized to the strongest bound glycan with error bars representing the SD. Groups of theoretical binders are presented with differently colored background (see SI Appendix for details). The same graphs with additional peak annotations as well as binding data from additional plant lectins are depicted in SI Appendix, Fig. S2. (D) Compounds on the same glycan array that had the highest median signals for IgG binding from n = 15 sera of healthy human subjects at a 1:100 dilution. Each data point is the mean of four spots from two independent experiments normalized to the mean binding signal of each experiment. The black bar indicates the median, the red bar the mean intensity, the boxes and whiskers contain the values between the 25th and 75th (boxes) and 10th and 90th percentile (whiskers), and the black dots represent values outside the whisker range. The whole glycan panel is shown in SI Appendix, Fig. S4. Graphical representations of glycan structures follow the guidelines of the third edition of Essentials of Glycobiology (89).
Fig. 5.
Fig. 5.
Analysis of binding specificities of immune lectin receptor DC-SIGN-T on a 140-compound glycan array. Recombinant DC-SIGN-T was screened at the indicated concentrations. Binding toward selected glycan groups, normalized to the signal of LeY antigen 157 at a concentration of 25 μg/mL, is shown. Error bars represent SD of four spots derived from two glycan array experiments. The remaining glycan panel is shown in SI Appendix, Figs. S6–S8.
Fig. 6.
Fig. 6.
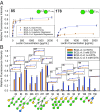
Analysis of binding specificities of lectins A and C from B. cenocepacia. (A) Concentration-dependent binding curves of lectins BC2L-A and BC2L-C-ct for a dimannoside and a diheptoside. (B) Signal intensities for both lectins at a protein concentration of 1 mg/mL toward all aminopentanol-linked mannosides and heptosides on the array, as well as LeA trisaccharide 158 as the glycan yielding the greatest intensity for BC2L-C-ct, for comparison. The Insets represent concentration-dependent binding curves for all compounds with the same scale as shown in A. All values are the mean of six spots from three glycan array experiments and normalized to the signal of the respective lectin toward arabinomannan hexasaccharide 257 at a lectin concentration of 1 mg/mL. Error bars represent SD. The whole glycan panel and representative field images are shown in SI Appendix, Fig. S13.

References

    1. Benoff S. Carbohydrates and fertilization: An overview. Mol Hum Reprod. 1997;3:599–637. - PubMed
    1. Regina Todeschini A, Hakomori SI. Functional role of glycosphingolipids and gangliosides in control of cell adhesion, motility, and growth, through glycosynaptic microdomains. Biochim Biophys Acta. 2008;1780:421–433. - PMC - PubMed
    1. van Kooyk Y, Rabinovich GA. Protein-glycan interactions in the control of innate and adaptive immune responses. Nat Immunol. 2008;9:593–601. - PubMed
    1. Rillahan CD, Paulson JC. Glycan microarrays for decoding the glycome. Annu Rev Biochem. 2011;80:797–823. - PMC - PubMed
    1. Park S, Gildersleeve JC, Blixt O, Shin I. Carbohydrate microarrays. Chem Soc Rev. 2013;42:4310–4326. - PMC - PubMed

Publication types

LinkOut - more resources