. 2019 Jan 22;11(2):423-447.
doi: 10.18632/aging.101749.

Expression and gene regulation network of RBM8A in hepatocellular carcinoma based on data mining

Affiliations

Expression and gene regulation network of RBM8A in hepatocellular carcinoma based on data mining

Yan Lin et al. Aging (Albany NY). .

Abstract

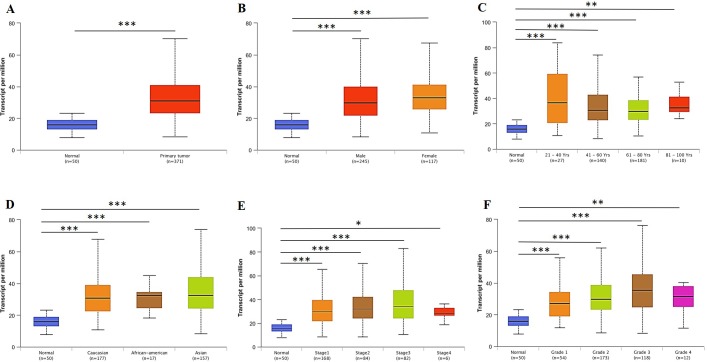
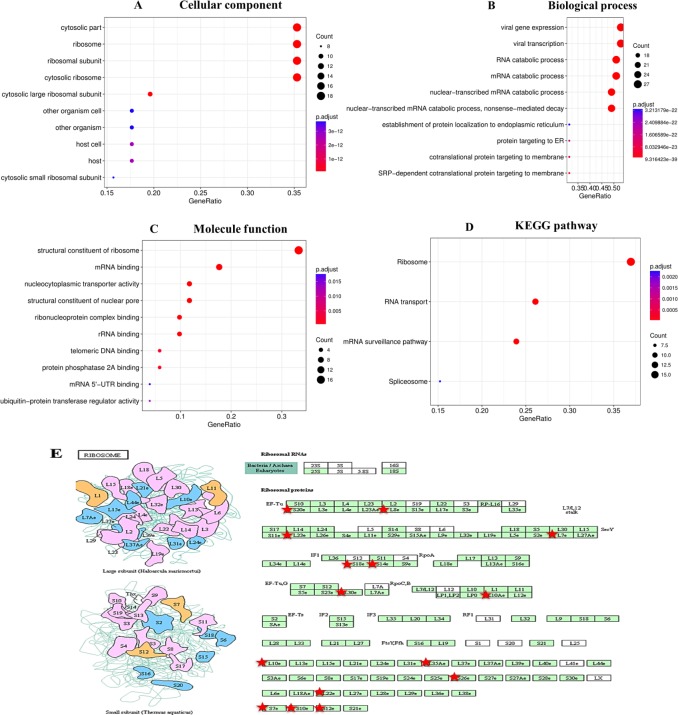
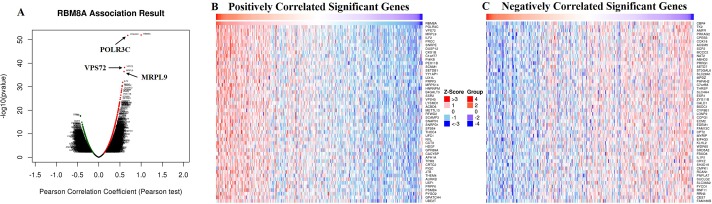
RNA binding motif protein 8A (RBM8A) is an RNA binding protein in a core component of the exon junction complex. Abnormal RBM8A expression is associated with carcinogenesis. We used sequencing data from the Cancer Genome Atlas database and Gene Expression Omnibus, analyzed RBM8A expression and gene regulation networks in hepatocellular carcinoma (HCC). Expression was analyzed using OncomineTM and Gene Expression Profiling Interactive Analysis tools, while RBM8A alterations and related functional networks were identified using cBioPortal. LinkedOmics was used to identify differential gene expression with RBM8A and to analyze Gene Ontology and Kyoto Encyclopedia of Genes and Genomes pathways. Gene enrichment analysis examined target networks of kinases, miRNAs and transcription factors. We found that RBM8A is overexpressed and the RBM8A gene often amplified in HCC. Expression of this gene is linked to functional networks involving the ribosome and RNA metabolic signaling pathways. Functional network analysis suggested that RBM8A regulates the spliceosome, ribosome, DNA replication and cell cycle signaling via pathways involving several cancer-related kinases, miRNAs and E2F Transcription Factor 1. Our results demonstrate that data mining efficiently reveals information about RBM8A expression and potential regulatory networks in HCC, laying a foundation for further study of the role of RBM8A in carcinogenesis.

Keywords: HCC; RBM8A; functional network analysis; prognosis.


Conflict of interest statement

CONFLICTS OF INTEREST: The authors declare that they have no conflicts of interest.

Figures

Figure 1
Figure 1
RBM8A transcription in hepatocellular carcinoma (Oncomine). Levels of RBM8A mRNA and DNA copy number were significantly higher in hepatocellular carcinoma than in normal tissue. Shown are fold change, associated p values, and overexpression gene rank, based on Oncomine 4.5 analysis. (A–D) Box plot showing RBM8A mRNA levels in, respectively, the Roessler Liver 2, Chen Liver, Wurmbach Liver and Mas Liver datasets. (E–F) Box plot showing RBM8A copy number in The Cancer Genome Atlas (TCGA) Liver and Guichard Liver datasets, respectively.
Figure 2
Figure 2
RBM8A transcription in subgroups of patients with hepatocellular carcinoma, stratified based on gender, age and other criteria (UALCAN). (A) Boxplot showing relative expression of RBM8A in normal and LIHC samples. (B) Boxplot showing relative expression of RBM8A in normal individuals of either gender or male or female LIHC patients. (C) Boxplot showing relative expression of RBM8A in normal individuals of any age or in LIHC patients aged 21–40, 41–60, 61–80, or 81–100 yr. (D) Boxplot showing relative expression of RBM8A in normal individuals of any ethnicity or in LIHC patients of Caucasian, African-American or Asian ethnicity. (E) Boxplot showing relative expression of RBM8A in normal individuals or in LIHC patients in stages 1, 2, 3 or 4. (F) Boxplot showing relative expression of RBM8A in normal individuals or LIHC patients with grade 1, 2, 3 or 4 tumors. Data are mean ± SE. *, P < 0.05; **, P < 0.01; ***, P < 0.001.
Figure 3
Figure 3
Visual summary of RBM8A alterations and biological interaction network in hepatocellular carcinoma (cBioPortal). (A) OncoPrint of RBM8A alterations in LIHC. The OncoPrint provides an overview of genomic alterations in RBM8A affecting individual samples (columns) in LIHC from the TCGA. The different types of genetic alterations are highlighted in different colors. (B) Network view of the RBM8A neighborhood in LIHC. RBM8A are seed genes (indicated with thick border), and all other genes are automatically identified as altered in LIHC. Darker red indicates increased frequency of alteration in LIHC. The interaction types are derived from the Biological Pathway Exchange (BioPAX): the blue connection indicates that the first protein controls a reaction that changes the state of the second protein; the red connection indicates that the proteins are members of the same complex.
Figure 4
Figure 4
Enrichment analysis of the genes altered in the RBM8A neighborhood in hepatocellular carcinoma. The bubble diagrams display the enrichment results of the top 50 genes altered in the RBM8A neighborhood in LIHC. (A) Cellular components. (B) Biological processes. (C) Molecular functions. (D) KEGG pathway analysis. (E) KEGG pathway annotations of the ribosome pathway. The red star denotes altered genes.
Figure 5
Figure 5
Genes differentially expressed in correlation with RBM8A in hepatocellular carcinoma (LinkedOmics). (A) A Pearson test was used to analyze correlations between RBM8A and genes differentially expressed in LIHC. (B–C) Heat maps showing genes positively and negatively correlated with RBM8A in LIHC (TOP 50). Red indicates positively correlated genes and green indicates negatively correlated genes.
Figure 6
Figure 6
Significantly enriched GO annotations and KEGG pathways of RBM8A in hepatocellular carcinoma. The significantly enriched GO annotations and KEGG pathways of RBM8A co-expression genes in LIHC were analyzed using GSEA. (A) Cellular components. (B) Biological processes. (C) Molecular functions. (D) KEGG pathway analysis. The blue column represents the LeadingEdgeNum, and the orange represents the false discovery rate (FDR). The FDR from GSEA in the figure is 0. (E) KEGG pathway annotations of the cell cycle pathway. Red marked nodes are associated with the LeadingEdgeGene.
Figure 7
Figure 7
Protein-protein interaction network of ATR kinase-target networks (GeneMANIA). Protein-protein interaction (PPI) network and functional analysis indicating the gene set that was enriched in the target network of ATR kinases. Different colors of the network edge indicate the bioinformatics methods applied: co-expression, website prediction, pathway, physical interactions and co-localization. The different colors for the network nodes indicate the biological functions of the set of enrichment genes.

References

    1. Ferlay J, Soerjomataram I, Dikshit R, Eser S, Mathers C, Rebelo M, Parkin DM, Forman D, Bray F. Cancer incidence and mortality worldwide: sources, methods and major patterns in GLOBOCAN 2012. Int J Cancer. 2015;136:E359–86. doi: 10.1002/ijc.29210. - DOI - PubMed
    1. Chen W. Cancer statistics: updated cancer burden in China. Chin J Cancer Res. 2015;27:1. doi: 10.3978/j.issn.1000-9604.2015.02.07. - DOI - PMC - PubMed
    1. Louafi S, Boige V, Ducreux M, Bonyhay L, Mansourbakht T, de Baere T, Asnacios A, Hannoun L, Poynard T, Taieb J. Gemcitabine plus oxaliplatin (GEMOX) in patients with advanced hepatocellular carcinoma (HCC): results of a phase II study. Cancer. 2007;109:1384–90. doi: 10.1002/cncr.22532. - DOI - PubMed
    1. Bruix J, Qin S, Merle P, Granito A, Huang YH, Bodoky G, Pracht M, Yokosuka O, Rosmorduc O, Breder V, Gerolami R, Masi G, Ross PJ, et al. Regorafenib for patients with hepatocellular carcinoma who progressed on sorafenib treatment (RESORCE): a randomised, double-blind, placebo-controlled, phase 3 trial. Lancet. 2017;389:56–66. doi: 10.1016/S0140-6736(16)32453-9. - DOI - PubMed
    1. Rimassa L, Santoro A. Sorafenib therapy in advanced hepatocellular carcinoma: the SHARP trial. Expert Rev Anticancer Ther. 2009;9:739–45. doi: 10.1586/era.09.41. - DOI - PubMed

Publication types