. 2019 Jan 22;10(1):380.
doi: 10.1038/s41467-018-08023-x.

Bulk tissue cell type deconvolution with multi-subject single-cell expression reference

Affiliations

Bulk tissue cell type deconvolution with multi-subject single-cell expression reference

Xuran Wang et al. Nat Commun. .

Abstract

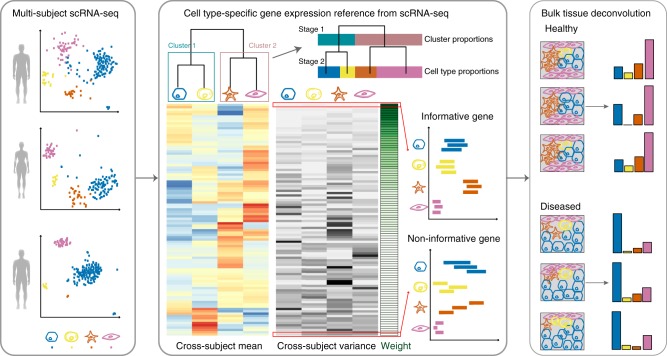
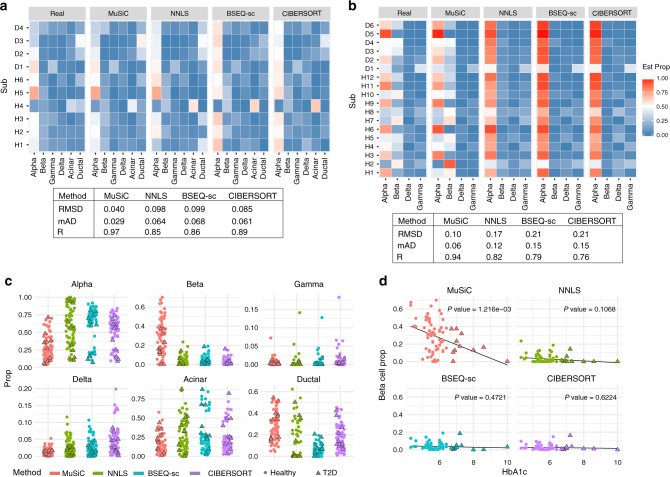
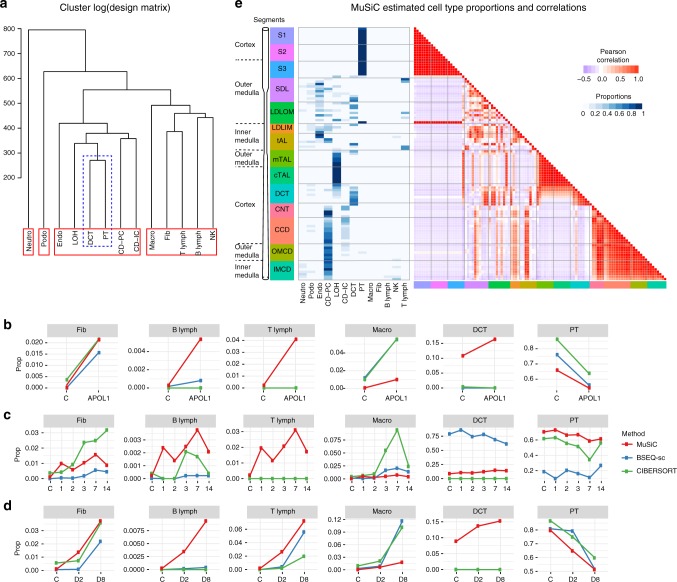
Knowledge of cell type composition in disease relevant tissues is an important step towards the identification of cellular targets of disease. We present MuSiC, a method that utilizes cell-type specific gene expression from single-cell RNA sequencing (RNA-seq) data to characterize cell type compositions from bulk RNA-seq data in complex tissues. By appropriate weighting of genes showing cross-subject and cross-cell consistency, MuSiC enables the transfer of cell type-specific gene expression information from one dataset to another. When applied to pancreatic islet and whole kidney expression data in human, mouse, and rats, MuSiC outperformed existing methods, especially for tissues with closely related cell types. MuSiC enables the characterization of cellular heterogeneity of complex tissues for understanding of disease mechanisms. As bulk tissue data are more easily accessible than single-cell RNA-seq, MuSiC allows the utilization of the vast amounts of disease relevant bulk tissue RNA-seq data for elucidating cell type contributions in disease.


Conflict of interest statement

The authors declare no competing interests.

Figures

Fig. 1
Fig. 1
Overview of MuSiC framework. MuSiC starts from scRNA-seq data from multiple subjects, classified into cell types (shown in different colors), and constructs a hierarchical clustering tree reflecting the similarity between cell types. Based on this tree, the user can determine the stages of recursive estimation and which cell types to group together at each stage. MuSiC then determines the group-consistent genes and calculates cross-subject mean (red to blue) and cross-subject variance (black to white) for these genes in each cell type. MuSiC up-weighs genes with low cross-subject variance and down-weighs genes with high cross-subject variance. In the example shown, deconvolution is performed in two stages, only cluster proportions are estimated for the first stage. Constrained by these cluster proportions, the second stage estimates cell type proportions, illustrated by the length of the bar with different colors. The deconvolved cell type proportions can then be compared across disease cohorts
Fig. 2
Fig. 2
Pancreatic islet cell type composition in healthy and T2D human samples. a, b Benchmarking of deconvolution accuracy on bulk data constructed by combining together scRNA-seq samples. a The bulk data is constructed for 10 subjects from Segerstolpe et al. while the single-cell reference is taken from the same dataset. The cell type proportions of healthy subjects are estimated by leave-one-out single cell reference. The subject names are relabeled; the table shows average root mean square error (RMSD), mean absolute deviation (mAD), and Pearson correlation (R) across all samples and cell types. b The bulk data is constructed for 18 subjects from Xin et al. while the single cell reference is six healthy subjects from Segerstolpe et al. c Jitter plots of estimated cell type proportions for Fadista et al. subjects, color-coded by deconvolution method. Of the 89 subjects from Fadista et al., only the 77 that have recorded HbA1c level are plotted, and T2D subjects are denoted as triangles while non-diabetic subjects are denoted as dots. d HbA1c vs beta cell type proportions estimated by each of 4 methods. The reported p-values are from single variable regression β cell proportion ~HbA1c. Multivariable regression results are reported in Supplementary Table 1. Supplementary Figure 7 shows the deconvolution results of Fadista et al. with the inDrop data from Baron et al. as single-cell reference. The corresponding multivariable regression results are shown in Supplementary Table 2. Source data are provided as a Source Data file
Fig. 3
Fig. 3
Cell type composition in kidney of mouse CKD models and rat. a Cluster dendrogram showing similarity between 13 cell types that were confidently characterized in Park et al. Abbreviations: Neutro: neutrophils, Podo: podocytes, Endo: endothelials, LOH: loop of Henle, DCT: distal convolved tubule, PT: proximal tubule, CD-PT: collecting duct principal cell, CD-IC: CD intercalated cell, Macro: macrophages, Fib: fibroblasts, NK: natural killers. bd Average estimated proportions for 6 cell types in bulk RNA-seq samples taken from three different studies, each study based on a different mouse model for chronic kidney disease. Results from three different deconvolution methods (MuSiC, BSEQ-sc and CIBERSORT) are shown by different colors. Supplementary Figure 5a–c show complete estimation results of all 13 cell types. b Bulk samples are from Beckerman et al., who sequenced 6 control and 4 APOL1 mice. c Bulk data are from Craciun et al., where samples are taken before (C) and at 1, 2, 3, 7, 14 days after administering folic acid. Line plot shows cell type proportion changes over time (days), averaged over 3 replicates at each time point. d Bulk data are from Arvaniti et al., where samples are taken from mice after Sham operation (C), 2 days after UUO operation (D2), and 8 days after UUO operation (D8). The average proportions at each time point are plotted. e MuSiC estimated cell type proportions of rat renal tubule segments. The estimated cell type proportions (left) and the proportions correlations between samples (right) are shown as heatmap. Segment names are color coded and aligned according to their physical positions along the renal tubule. Supplementary Figure 6a–c show NNLS, BSEQ-sc and CIBERSORT results. Segment name abbreviation: S1 S1 proximal tubule, S2 S2 proximal tubule, S3 S3 proximal tubule, SDL short descending limb, LDLOM long descending limb, outer medulla, LDLIM long descending limb, inner medulla, tAL thin ascending limb, mTAL medullary thick ascending limb, cTAL cortical thick ascending limb, DCT distal convoluted tubule, CNT connecting tubule, CCD cortical collecting duct, OMCD outer medullary collecting duct, IMCD inner medullar collecting duct. Source data are provided as a Source Data file

References

    1. Park, J. et al. Single-cell transcriptomics of the mouse kidney reveals potential cellular targets of kidney disease. Science 360, 758–763 (2018). - PMC - PubMed
    1. Avila Cobos, F., Vandesompele, J., Mestdagh, P. & De Preter, K. Computational deconvolution of transcriptomics data from mixed cell populations. Bioinformatics34, 1969–1979 (2018). - PubMed
    1. Newman AM, et al. Robust enumeration of cell subsets from tissue expression profiles. Nat. Methods. 2015;12:453. doi: 10.1038/nmeth.3337. - DOI - PMC - PubMed
    1. Baron M, et al. A single-cell transcriptomic map of the human and mouse pancreas reveals inter- and intra-cell population structure. Cell Syst. 2016;3:346–360 e344. doi: 10.1016/j.cels.2016.08.011. - DOI - PMC - PubMed
    1. Li B, et al. Comprehensive analyses of tumor immunity: implications for cancer immunotherapy. Genome Biol. 2016;17:174. doi: 10.1186/s13059-016-1028-7. - DOI - PMC - PubMed

Publication types