. 2019 Sep;21(9):1977-1986.
doi: 10.1038/s41436-019-0442-0. Epub 2019 Jan 23.

Untargeted metabolomic profiling reveals multiple pathway perturbations and new clinical biomarkers in urea cycle disorders

Affiliations

Untargeted metabolomic profiling reveals multiple pathway perturbations and new clinical biomarkers in urea cycle disorders

Lindsay C Burrage et al. Genet Med. 2019 Sep.

Abstract

Purpose: Untargeted metabolomic analysis is increasingly being used in the screening and management of individuals with inborn errors of metabolism (IEM). We aimed to test whether untargeted metabolomic analysis in plasma might be useful for monitoring the disease course and management of urea cycle disorders (UCDs).

Methods: Untargeted mass spectrometry-based metabolomic analysis was used to generate z-scores for more than 900 metabolites in plasma from 48 individuals with various UCDs. Pathway analysis was used to identify common pathways that were perturbed in each UCD.

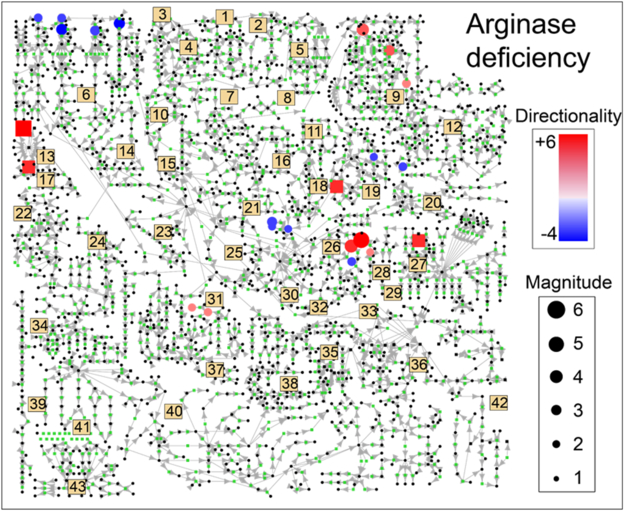
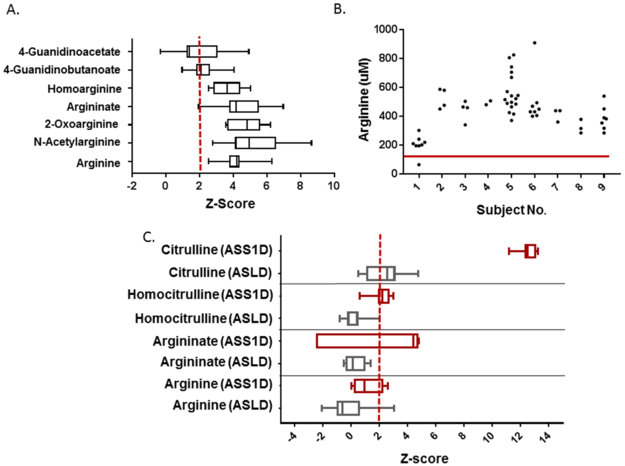
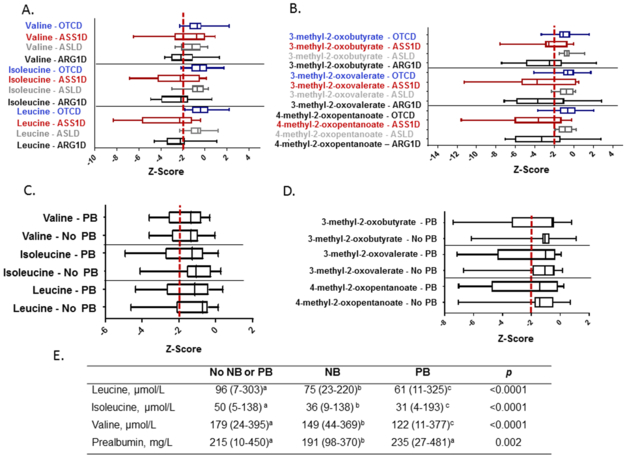
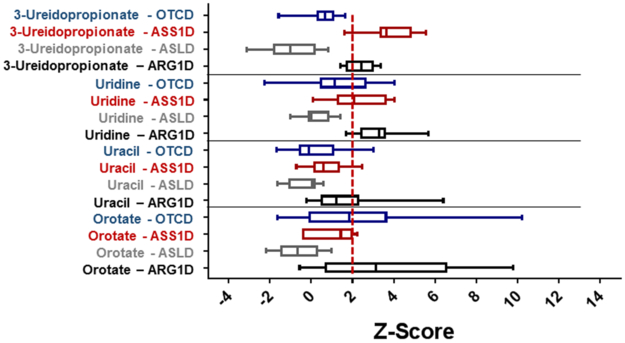
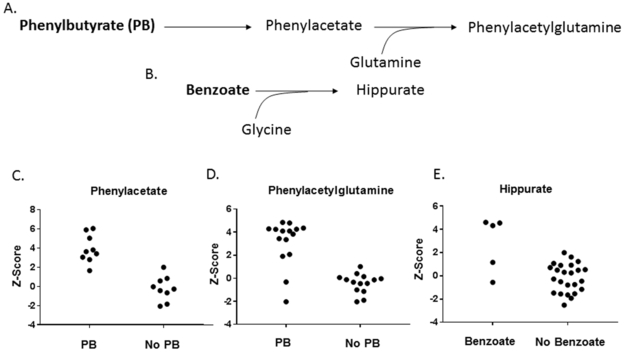
Results: Our metabolomic analysis in plasma identified multiple potentially neurotoxic metabolites of arginine in arginase deficiency and, thus, may have utility in monitoring the efficacy of treatment in arginase deficiency. In addition, we were also able to detect multiple biochemical perturbations in all UCDs that likely reflect clinical management, including metabolite alterations secondary to dietary and medication management.

Conclusion: In addition to utility in screening for IEM, our results suggest that untargeted metabolomic analysis in plasma may be beneficial for monitoring efficacy of clinical management and off-target effects of medications in UCDs and potentially other IEM.

Keywords: arginase deficiency; branched-chain amino acids; guanidino compounds; metabolomics; urea cycle disorder.


Conflict of interest statement

Competing interests

L.C.B., B M.S., Q.S., MJ.M., S.C.S.N., W.C., F.S., V.R.S., B.H.L., and S.H.E. are employees of Baylor College of Medicine, which has a partnership with Baylor Genetics and derives revenue from genetic testing. The other authors declare no conflict of interest.

Figures

Figure 1.
Figure 1.. Metabolite Profile in Arginase Deficiency.
Z-scores for metabolites in subjects with arginase deficiency were averaged. All metabolite z-scores that were mapped to the pathway map are plotted. Only metabolites with z-scores ≥ 2 or ≤ - 2 were plotted. Blue nodes indicate negative z-scores, whereas red nodes indicate positive z-scores. Node size reflects the strength of the z-score. Numbers refer to particular pathways and biological processes, described below. 1–Glycosylation 2–Ascorbate Metabolism 3–Glycogen Metabolism 4–Galactose Metabolism 5–Inositol Metabolism 6–BCAA Metabolism 7–Riboflavin Metabolism 8–Pentose Phosphate Pathway 9–Pyrimidine Metabolism 10–Sorbitol/Glycerol Metabolism 11–Benzoate Metabolism 12–Purine Metabolism 13–Protein Degradation 14–Lysine Catabolism 15–Glycolysis 16–Glycine/Serine/Threonine 17–Carnitine Biosynthesis 18–Methionine/Cysteine Metabolism Metabolism 19–Glutathione Metabolism 20–Histidine Metabolism 21–Ketone Bodies 22–Nicotinate/Nicotinamide 23–Mevalonate Metabolism 24–Tryptophan Metabolism Metabolism 25–TCA Cycle 26–Arginine Metabolism and 27–Eicosanoids Urea Cycle 28–Polyamine Metabolism 29–Creatine Metabolism 30–Aspartate/Glutamate Metabolism 31–Phenylalanine/Tyrosine 32–Proline Metabolism 33–Endocannabinoid Metabolism Synthesis 34–Fibrinogen Cleavage Peptides 35–Sphingolipid Metabolism 36–Phospholipid Metabolism 37–Thyroid Hormone Synthesis 38–Fatty Acid Metabolism 39 Hemoglobin/Porphyrin Metabolism 40–Steroid Hormone Biosynthesis 41–Bile Acid Metabolism 42–Dicarboxylic Acid Metabolism 43-Secondary Bile Acids
Figure 2.
Figure 2.. A. Elevated Guanidino Compounds in Arginase Deficiency.
A. Multiple plasma guanidino compounds are markedly elevated in subjects with arginase deficiency. Data for each metabolite was available for n=7-13 subjects (e.g., total analyte identifications per sample varied by batch and platform used). The red dashed line indicates the z-score of 2. B. Plasma arginine levels over the five years prior to sample collection for metabolomics in subjects with arginase deficiency. The red line represents the upper limit of normal for plasma arginine level. C. Elevated metabolites in citrullinemia (ASS1D, red) and ASL deficiency (ASLD, grey) are shown. The red dashed line indicates the z-score of 2. Data for these metabolites were available for n=7 subjects with ASS1D and n=9-10 subjects with ASLD.
Figure 3.
Figure 3.. Reduced Plasma Levels of Branched-Chain Amino Acids (BCAA) in UCDs.
A. The levels of leucine, isoleucine, and valine in each UCD are shown. B. The levels of the branched-chain ketoacids (BCKA) in each UCD are shown. C. Leucine, isoleucine, and valine levels in subjects taking phenylbutyrate-containing nitrogen-scavenging agents vs. subjects not taking these agents. D. The BCKA levels in subjects taking phenylbutyrate-containing nitrogen scavenging agents vs. subjects not taking these agents. The red dashed line indicates the z-score of −2. OTCD = OTC deficiency, ASS1D = citrullinemia, ASLD = ASL deficiency, ARG1D = arginase deficiency. PB=phenylbutyrate. E. BCAA and prealbumin concentrations in subjects from the UCDC Longitudinal Study are provided based on type of nitrogen-scavenging drug treatment. Statistical analysis includes one-way ANOVA for type of nitrogen-scavenging drug treatment. Values are medians (minimum – maximum). Sample sizes for the branched-chain analyses included: No NB or PB, n = 269-270; NB, n = 61; PB, n = 193-195. Sample sizes for prealbumin included: No NB or PB, n = 211; NB, n = 50; PB, n = 152. a,b,cMedians with different superscripted letters are significantly different (p<0.05). NB, sodium benzoate; PB, sodium or glycerol phenylbutyrate.
Figure 4.
Figure 4.. Pyrimidine Metabolites are Elevated in UCDs.
The levels of elevated pyrimidine metabolites in subjects with UCDs are shown. The red dashed line indicates the z-score of 2. OTCD = OTC deficiency, ASS1D = citrullinemia, ASLD = ASL deficiency, ARG1D = arginase deficiency.
Figure 5.
Figure 5.. Metabolites of the Nitrogen Scavenging Agents are Detected in Plasma Metabolomic Analysis.
A. Phenylbutyrate is metabolized to phenylacetate and combines with glutamine to form phenylacetylglutamine which is excreted in the urine. B. Benzoate combines with glycine to form hippurate which is excreted in the urine. C. Phenylacetate is elevated in subjects taking sodium phenylbutyrate or glycerol phenylbutyrate. D. Phenylacetylglutamine is elevated in subjects taking sodium phenylbutyrate or glycerol phenylbutyrate. E. Hippurate is elevated in most subjects taking sodium benzoate. PB = taking sodium phenylbutyrate or glycerol phenylbutyrate;

References

    1. Jang YJ, LaBella AL, Feeney TP, Braverman N, Tuchman M, Morizono H, et al. Disease-causing mutations in the promoter and enhancer of the ornithine transcarbamylase gene. Hum Mutat. 2018;39:527–36. - PMC - PubMed
    1. Haberle J, Boddaert N, Burlina A, Chakrapani A, Dixon M, Huemer M, et al. Suggested guidelines for the diagnosis and management of urea cycle disorders. Orphanet J Rare Dis. 2012;7:32. - PMC - PubMed
    1. Miller MJ, Kennedy AD, Eckhart AD, Burrage LC, Wulff JE, Miller LA, et al. Untargeted metabolomic analysis for the clinical screening of inborn errors of metabolism. J Inherit Metab Dis. 2015;38:1029–39. - PMC - PubMed
    1. Coene KLM, Kluijtmans LAJ, van der Heeft E, Engelke UFH, de Boer S, Hoegen B, et al. Next-generation metabolic screening: targeted and untargeted metabolomics for the diagnosis of inborn errors of metabolism in individual patients. J Inherit Metab Dis. 2018. - PMC - PubMed
    1. Kennedy AD, Miller MJ, Beebe K, Wulff JE, Evans AM, Miller LA, et al. Metabolomic Profiling of Human Urine as a Screen for Multiple Inborn Errors of Metabolism. Genet Test Mol Biomarkers. 2016;20:485–95. - PMC - PubMed

Publication types

LinkOut - more resources