

Biomarker identification and trans-regulatory network analyses in esophageal adenocarcinoma and Barrett's esophagus
- PMID: 30670912
- PMCID: PMC6337015
- DOI: 10.3748/wjg.v25.i2.233
Biomarker identification and trans-regulatory network analyses in esophageal adenocarcinoma and Barrett's esophagus
Abstract
Background: Esophageal adenocarcinoma (EAC) is an aggressive disease with high mortality and an overall 5-year survival rate of less than 20%. Barrett's esophagus (BE) is the only known precursor of EAC, and patients with BE have a persistent and excessive risk of EAC over time. Individuals with BE are up to 30-125 times more likely to develop EAC than the general population. Thus, early detection of EAC and BE could significantly improve the 5-year survival rate of EAC. Due to the limitations of endoscopic surveillance and the lack of clinical risk stratification strategies, molecular biomarkers should be considered and thoroughly investigated.
Aim: To explore the transcriptome changes in the progression from normal esophagus (NE) to BE and EAC.
Methods: Two datasets from the Gene Expression Omnibus (GEO) in NCBI Database (https://www.ncbi.nlm.nih.gov/geo/) were retrieved and used as a training and a test dataset separately, since NE, BE, and EAC samples were included and the sample sizes were adequate. This study identified differentially expressed genes (DEGs) using the R/Bioconductor project and constructed trans-regulatory networks based on the Transcriptional Regulatory Element Database and Cytoscape software. Enrichment of Kyoto Encyclopedia of Genes and Genomes (KEGG) and Gene Ontology (GO) terms was identified using the Database for Annotation, Visualization, and Integrated Discovery (DAVID) Bioinformatics Resources. The diagnostic potential of certain DEGs was assessed in both datasets.
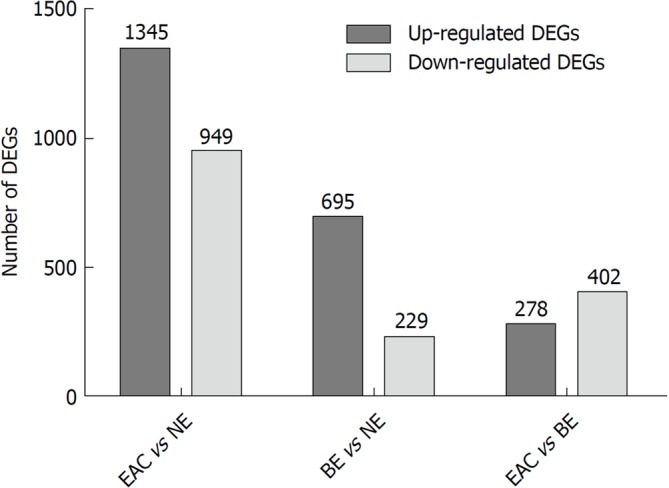
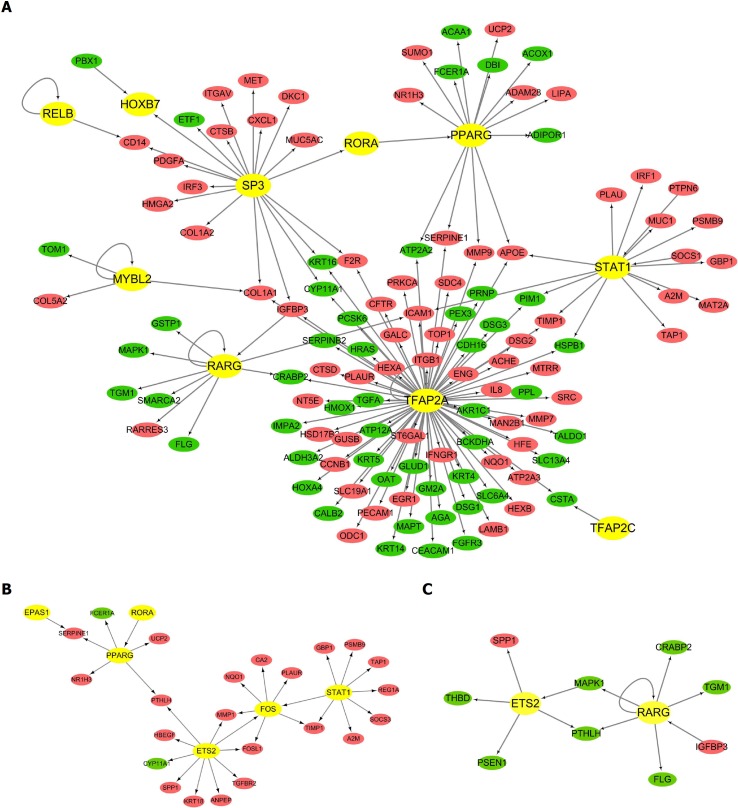
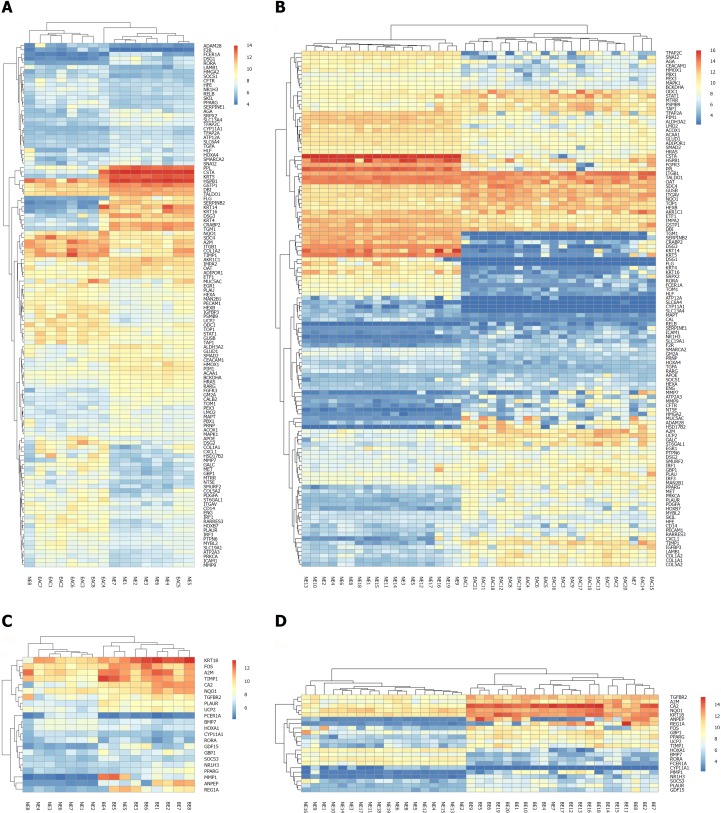
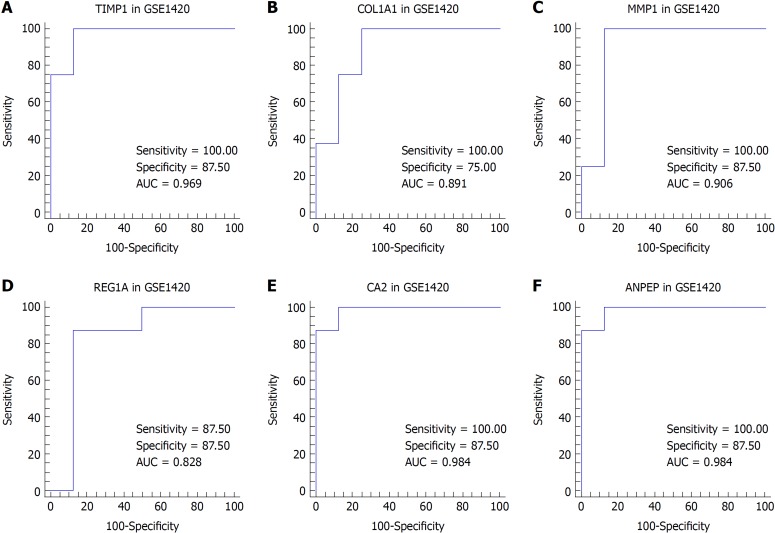
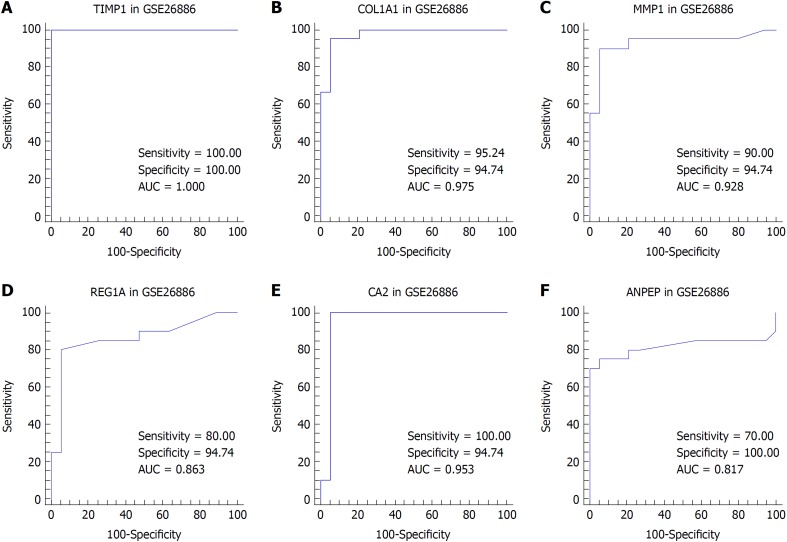
Results: In the GSE1420 dataset, the number of up-regulated DEGs was larger than that of down-regulated DEGs when comparing EAC vs NE and BE vs NE. Among these DEGs, five differentially expressed transcription factors (DETFs) displayed the same trend in expression across all the comparison groups. Of these five DETFs, E2F3, FOXA2, and HOXB7 were up-regulated, while PAX9 and TFAP2C were down-regulated. Additionally, the majority of the DEGs in trans-regulatory networks were up-regulated. The intersection of these potential DEGs displayed the same direction of changes in expression when comparing the DEGs in the GSE26886 dataset to the DEGs in trans-regulatory networks above. The receiver operating characteristic curve analysis was performed for both datasets and found that TIMP1 and COL1A1 could discriminate EAC from NE tissue, while REG1A, MMP1, and CA2 could distinguish BE from NE tissue. DAVID annotation indicated that COL1A1 and MMP1 could be potent biomarkers for EAC and BE, respectively, since they participate in the majority of the enriched KEGG and GO terms that are important for inflammation and cancer.
Conclusion: After the construction and analyses of the trans-regulatory networks in EAC and BE, the results indicate that COL1A1 and MMP1 could be potential biomarkers for EAC and BE, respectively.
Keywords: Barrett’s esophagus; Differentially expressed genes; Esophageal adenocarcinoma; Microarray; Transcription factors.
Conflict of interest statement
Conflict-of-interest statement: The authors declare that they have no conflicts of interest.
Figures
Similar articles
-
Identification of miRNAs and genes for predicting Barrett's esophagus progressing to esophageal adenocarcinoma using miRNA-mRNA integrated analysis.PLoS One. 2021 Nov 24;16(11):e0260353. doi: 10.1371/journal.pone.0260353. eCollection 2021. PLoS One. 2021. PMID: 34818353 Free PMC article.
-
Identification of potential biomarkers in Barrett's esophagus derived esophageal adenocarcinoma.Sci Rep. 2023 Feb 9;13(1):2345. doi: 10.1038/s41598-022-17107-0. Sci Rep. 2023. PMID: 36759514 Free PMC article.
-
Identification of key pathways and genes in Barrett's esophagus using integrated bioinformatics methods.Mol Med Rep. 2018 Feb;17(2):3069-3077. doi: 10.3892/mmr.2017.8274. Epub 2017 Dec 12. Mol Med Rep. 2018. PMID: 29257318 Free PMC article.
-
Genetic and Epigenetic Alterations in Barrett's Esophagus and Esophageal Adenocarcinoma.Gastroenterol Clin North Am. 2015 Jun;44(2):473-89. doi: 10.1016/j.gtc.2015.02.015. Epub 2015 Apr 1. Gastroenterol Clin North Am. 2015. PMID: 26021206 Free PMC article. Review.
-
Molecular Evolution of Metaplasia to Adenocarcinoma in the Esophagus.Dig Dis Sci. 2018 Aug;63(8):2059-2069. doi: 10.1007/s10620-018-5090-8. Dig Dis Sci. 2018. PMID: 29766388 Free PMC article. Review.
Cited by
-
Variance-Preserving Estimation of Intensity Values Obtained From Omics Experiments.Front Genet. 2019 Sep 20;10:855. doi: 10.3389/fgene.2019.00855. eCollection 2019. Front Genet. 2019. PMID: 31616468 Free PMC article.
-
Identification of miRNAs and genes for predicting Barrett's esophagus progressing to esophageal adenocarcinoma using miRNA-mRNA integrated analysis.PLoS One. 2021 Nov 24;16(11):e0260353. doi: 10.1371/journal.pone.0260353. eCollection 2021. PLoS One. 2021. PMID: 34818353 Free PMC article.
-
An Integrated Regulatory Network Based on Comprehensive Analysis of mRNA Expression, Gene Methylation and Expression of Long Non-coding RNAs (lncRNAs) in Myelodysplastic Syndromes.Front Oncol. 2019 Mar 29;9:200. doi: 10.3389/fonc.2019.00200. eCollection 2019. Front Oncol. 2019. PMID: 30984623 Free PMC article.
-
Barrett's Metaplasia Progression towards Esophageal Adenocarcinoma: An Attempt to Select a Panel of Molecular Sensors and to Reflect Clinical Alterations by Experimental Models.Int J Mol Sci. 2022 Mar 18;23(6):3312. doi: 10.3390/ijms23063312. Int J Mol Sci. 2022. PMID: 35328735 Free PMC article.
-
A bioinformatics analysis for diagnostic roles of the E2F family in esophageal cancer.J Gastrointest Oncol. 2022 Oct;13(5):2115-2131. doi: 10.21037/jgo-22-855. J Gastrointest Oncol. 2022. PMID: 36388667 Free PMC article.
References
-
- Vakil N, van Zanten SV, Kahrilas P, Dent J, Jones R Global Consensus Group. The Montreal definition and classification of gastroesophageal reflux disease: a global evidence-based consensus. Am J Gastroenterol. 2006;101:1900–1920; quiz 1943. - PubMed
-
- Kimchi ET, Posner MC, Park JO, Darga TE, Kocherginsky M, Karrison T, Hart J, Smith KD, Mezhir JJ, Weichselbaum RR, Khodarev NN. Progression of Barrett’s metaplasia to adenocarcinoma is associated with the suppression of the transcriptional programs of epidermal differentiation. Cancer Res. 2005;65:3146–3154. - PubMed
-
- Desai TK, Krishnan K, Samala N, Singh J, Cluley J, Perla S, Howden CW. The incidence of oesophageal adenocarcinoma in non-dysplastic Barrett’s oesophagus: a meta-analysis. Gut. 2012;61:970–976. - PubMed
MeSH terms
Substances
Supplementary concepts
LinkOut - more resources
Full Text Sources
Medical
Molecular Biology Databases
Research Materials
Miscellaneous
