. 2019 Jan 8:9:784.
doi: 10.3389/fendo.2018.00784. eCollection 2018.

Protein Disulfide Isomerase Modulates the Activation of Thyroid Hormone Receptors

Affiliations

Protein Disulfide Isomerase Modulates the Activation of Thyroid Hormone Receptors

Jessica L O Campos et al. Front Endocrinol (Lausanne). .

Abstract

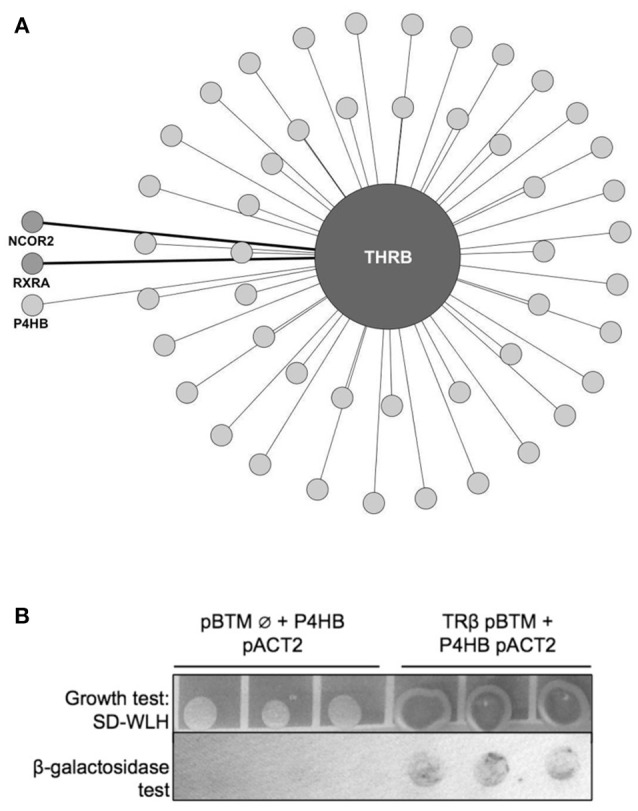
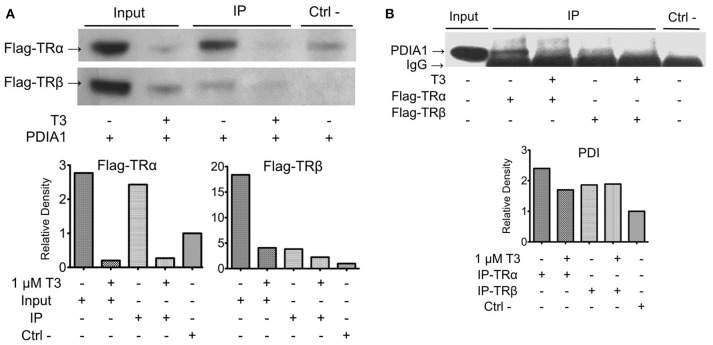
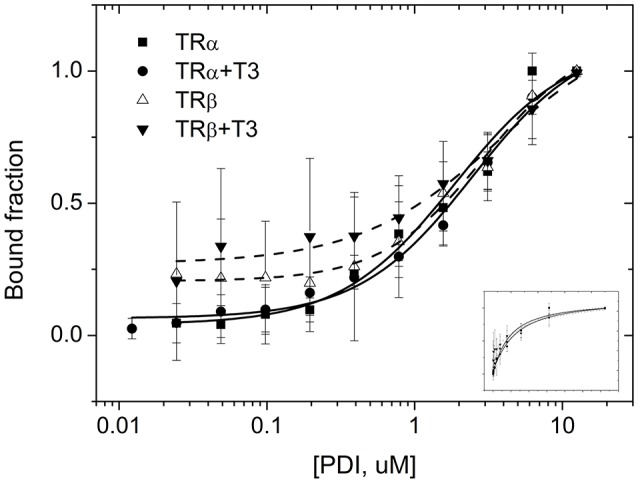
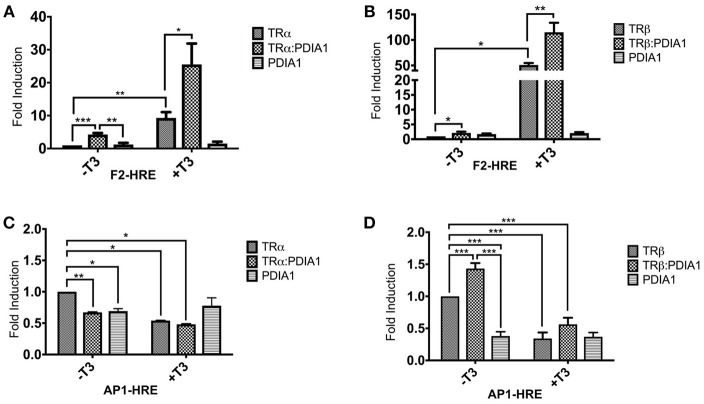
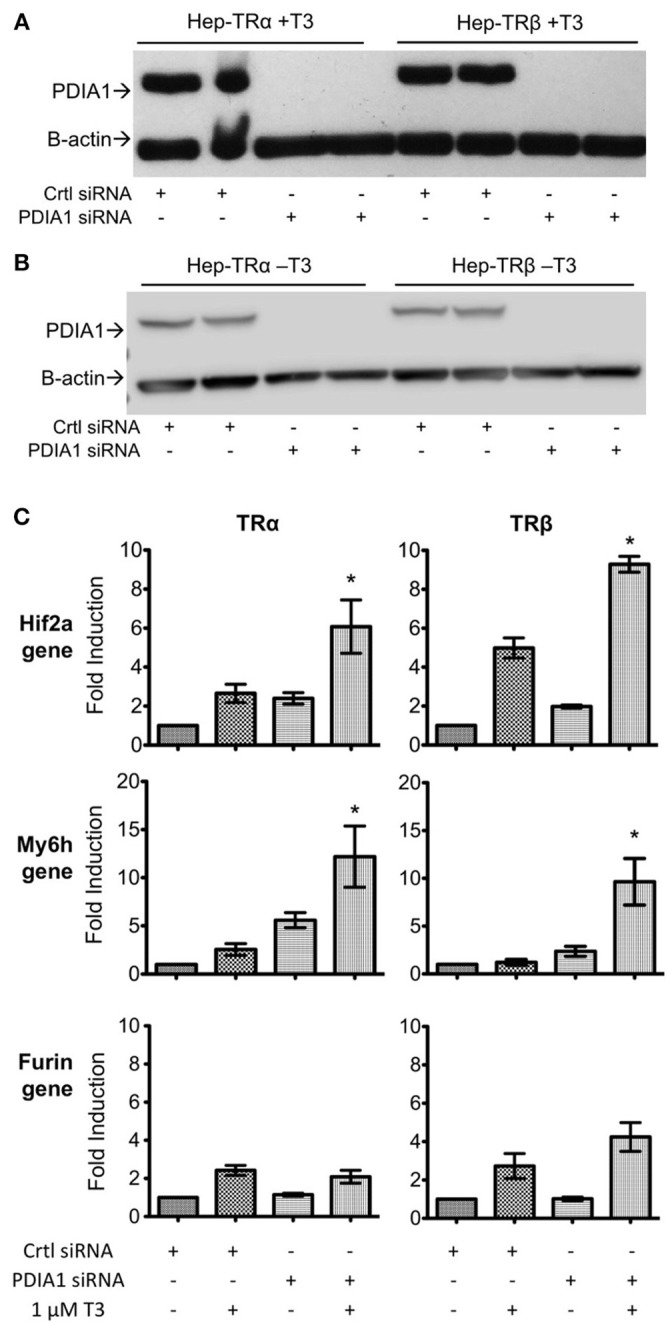
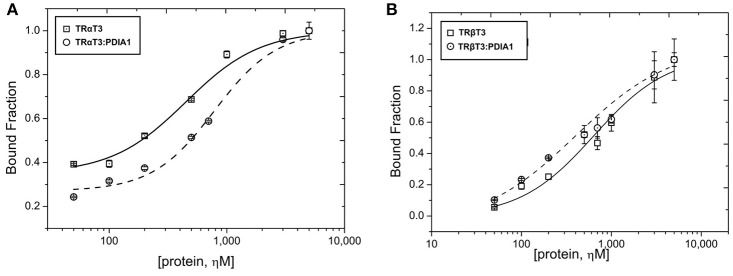
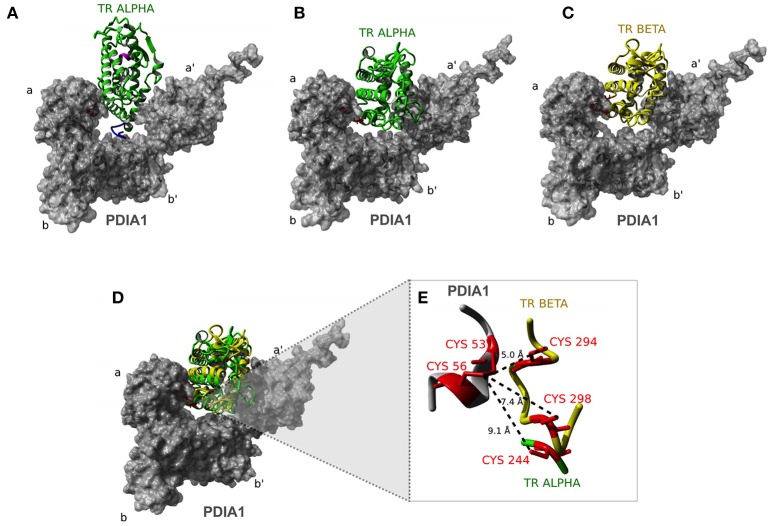
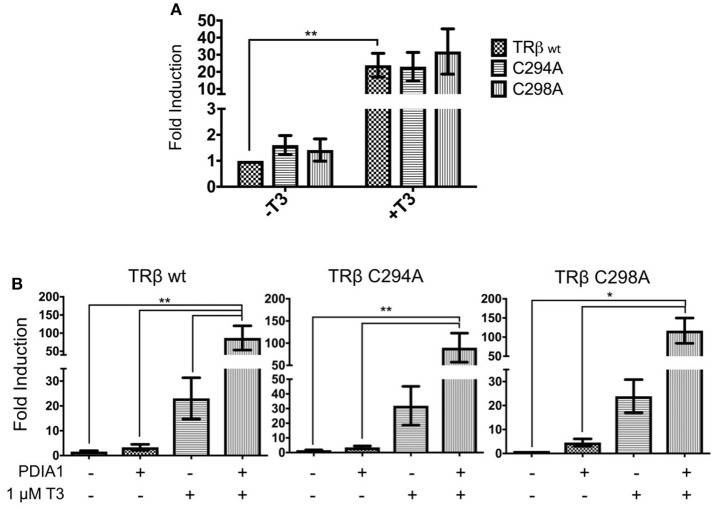
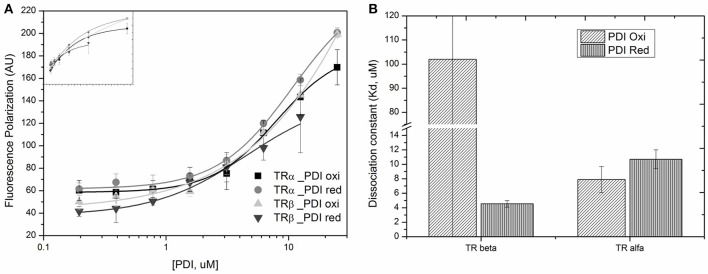
Thyroid hormone receptors (TRs) are responsible for mediating thyroid hormone (T3 and T4) actions at a cellular level. They belong to the nuclear receptor (NR) superfamily and execute their main functions inside the cell nuclei as hormone-regulated transcription factors. These receptors also exhibit so-called "non-classic" actions, for which other cellular proteins, apart from coregulators inside nuclei, regulate their activity. Aiming to find alternative pathways of TR modulation, we searched for interacting proteins and found that PDIA1 interacts with TRβ in a yeast two-hybrid screening assay. The functional implications of PDIA1-TR interactions are still unclear; however, our co-immunoprecipitation (co-IP) and fluorescence assay results showed that PDI was able to bind both TR isoforms in vitro. Moreover, T3 appears to have no important role in these interactions in cellular assays, where PDIA1 was able to regulate transcription of TRα and TRβ-mediated genes in different ways depending on the promoter region and on the TR isoform involved. Although PDIA1 appears to act as a coregulator, it binds to a TR surface that does not interfere with coactivator binding. However, the TR:PDIA1 complex affinity and activation are different depending on the TR isoform. Such differences may reflect the structural organization of the PDIA1:TR complex, as shown by models depicting an interaction interface with exposed cysteines from both proteins, suggesting that PDIA1 might modulate TR by its thiol reductase/isomerase activity.

Keywords: nuclear receptor signaling pathways; protein complexes; protein disulfide isomerase; redox regulation; thyroid hormone receptor.


Figures

Figure 1
Figure 1
TRβ yeast two-hybrid (y2h) screening. (A) Network created with IIS (Integrated Interactome System) platform and built in Cytoscape 3.3.0 software. Y2H experiments identified 50 preys, among them, light-gray circles represent the new interactors found for TRβ (48 in total), and medium-gray, detached from circle, the already-known TR partners NCOR2 (Nuclear Receptor Corepressor 2) and RXRA (Retinoid X-Receptor α). In light-gray, also detached from circle, we show the new TRβ partner found, Protein Disulfide Isomerase (PDIA1, also known as Prolyl 4-Hydroxylase Subunit Beta—P4HB). (B) Confirmation of PDIA1 and TRβ interaction found in Y2H assay. The TRβ and PDIA1 interaction reconstructed cell transcription factors machinery and transcribed genes that allows colonies to grow, we observe this in dark-grey colonies. Moreover, this interaction produced blue products in the β-galactosidase assay. Negative control with an empty vector (pBTM Ø) had no growth and in β-galactosidase assay, no blue color.
Figure 2
Figure 2
Co-immunoprecipitation of TR:PDIA1 in 293T cells shows the interaction for both isoforms with or without T3 presence. (A) Immunoprecipitation of PDIA1 followed by Western Blot anti-flag, revealing Co-IP of PDIA1 and flag-TRs. The treatment with T3 (1 μM) decreases TR expression in 293T cell (input bands are thinner) reducing protein available to be immunoprecipitated. The interactions of TRs with PDIA1 were confirmed according to the quantification of bands (presented in the graphs below the WB). (B) Immunoprecipitation of flag tagged TRs (+ or –T3), and western blot anti-PDIA1. Control experiment WB anti-flag is presented in Supplementary Figure 2A, together with a confirmation experiment (Supplementary Figure 2B). Although WB shows strong IgG band, it is still possible to observe the presence of PDIA1 in all conditions, co-immunoprecipitated with both isoforms of TR. The quantification of bands are presented in graphs below WB, where all signals were normalized to the control signal (relative Density). 293T cell extracts without T3 and without transfection of flag-TRs were used on this experiment as negative control. Co-IP and WB experiments were performed more than once and here we show a representative image.
Figure 3
Figure 3
Fluorescence anisotropy curves of TRs binding to PDIA1 in the presence or absence of T3. TRα, as well as TRβ, binds to PDIA1 with similar affinity, and T3 makes no difference in binding affinities (Kd). Insert, same fluorescence plot, without logarithm scale in the x-axis.
Figure 4
Figure 4
Reporter gene luciferase assay shows PDIA1 acting on TRs gene regulation. Full length TRα or TRβ, full length PDIA1 and Responsive Elements (REs) F2 and AP1, were transfected in 293T cells (in the presence and absence of T3), then luciferase activity was measured. All the TRs activation values were normalized by Renilla Luciferase activation. (A) In F2-Luc Response element, PDIA1 increased the basal activation of TRα in 4 times (*), and the T3 presence, which already increased TRα basal activation 9-fold (**), increased the TRα:PDIA1 activation 3-fold higher (**), or 25 times the TRα basal activity. (B) PDIA1 presence, in F2-Luc Response element, increased basal activity of TRβ in 2-fold (*) independently of T3 presence, the T3 increased TRβ activity in 50-fold (***), and PDIA1+T3 addition increased this activation in 2-fold (***), which in total, reached 115 times the basal activity of TRβ. (C) In AP1-Luc Response element, T3 repress basal activity of TRα, PDIA1 presence was able to decrease the basal gene expression in both cases, with (*) and without T3 (**), and T3 and PDIA1 together were able to halving the unliganded TRα activation (*). (D) In AP1-Luc Response element, when PDIA1 is present and T3 is not, basal activation increased 1.5-fold (***), and presence of T3 decreased even more this basal TRβ activation (about 60%) (***). However, both PDIA1 and T3 together maintained the basal activation also repressed but in lower level (about 40%) (***). In this last case, PDIA1 and T3 seemed to work in opposite directions. Statistical Analysis made with One-way or Two-way ANOVA *p < 0.05, **p < 0.01, ***p < 0.001.
Figure 5
Figure 5
Knockdown of PDIA1 in Hep-TRα and Hep-TRβ cell lines followed by qPCR. (A) Knockdown of PDI in Hep-TRs cell lines in T3 presence (+T3). Western blot shows the absence of PDIA1 protein in knockdown samples (PDIA1 siRNA). Cells were treated with 1 μM of T3 for 6 h prior to cell harvesting. We presented here only 2 out of 3 knockdown experiments for each condition. Antibodies: anti-PDI and anti-β-Actin as loading control. (B) Knockdown of PDI in Hep-TRs cell lines in T3 absence (–T3). Western blot shows the absence of PDIA1 protein in knockdown samples (PDIA1 siRNA). Cells were treated with 1 μM of DMSO for 6 h prior to cell harvesting. We presented here only 2 out of 3 knockdown experiments for each condition. Antibodies: anti-PDI and anti-β-Actin as loading control. (C) qPCRs for each cell line, Hep-TRα and Hep-TRβ, with or without T3. Hif2a and Myh6 in absence of PDI (knockdown condition), increases transcription, Furin in absence of PDI (knockdown condition), did not alter gene expression. Each experiment was performed in three biological replicates. Statistical Analysis with One-way ANOVA *p < 0.05.
Figure 6
Figure 6
Fluorescence anisotropy of liganded TRs or complex (TR+T3:PDIA1) on SRC1 coactivator. (A) Anisotropy curves of TRα+T3 with and without PDIA1 titration in 50 nM of SRC1 peptide. (B) Anisotropy curves of TRβ+T3 with and without PDIA1 titrated in 50 nM of SRC1 peptide. These curves represent the average of the triplicate.
Figure 7
Figure 7
Docking analysis of TR:PDIA1 binding sites. (A) Model I of TRα: PDIA1 interaction. Structural representation showing the interaction between TRα (green) and PDIA1 (surface presented in gray). The a, b, a′, and b′ Domains are shown in PDIA1 structure. In pink we show H12 helix. Hinge Domain of TRα is shown in blue. This domain interacts with domain b′ of PDIA1. (B) Model II of TRα:PDIA1 interaction. Cysteines 53 and 56 of PDIA1 are close to cys244 in TRα, located in H5. In pink we show H12 helix. (C) TRβ:PDIA1 interaction (similar to TRα:PDIA1 Model II). Structural representation showing the interaction between TRβ (yellow) and PDIA1 (surface presented in gray). In pink, the H12 helix. (D) Overlap of TRα and TRβ models (B,C). (E) Detail of PDIA1 cysteines and TRα and TRβ cysteines. Interaction between 53 and 56 cysteins of PDIA1 (red in gray) and 294 and 298 cysteins of TRβ (red in yellow) and 244 cysteine of TRα (red in green). Dotted lines show the distance between thiol groups of each protein.
Figure 8
Figure 8
Reporter gene luciferase assay shows PDIA1 acting on TRβ gene regulation. Full length TRβ wt, C294A, and C298A, full length PDIA1 and Responsive Element (RE) F2, were transfected in 293T cells (in the presence and absence of T3), then luciferase activity was measured. All the TRs activation values were normalized by Renilla Luciferase activation. (A) First, T3 hormone addition in all cases increased the transactivation, this shows that in terms of gene expression, both TRβ mutants were activated in a similar way. (B) PDIA1 presence in the TRβ mutant transactivation assay led to increase TRβ-C294A and TRβ-C298A basal activation by about 3- to 4-fold. On the other hand, in the presence of T3, PDIA1 promoted minor further reduction in TRβ-C294A and TRβ-C298A activation in comparison with wt TRβ (86-fold for C294A, 89-fold for C298A, and 115-fold for TRβ wt). Statistical Analysis with One-way or Two-way ANOVA *p < 0.05, **p < 0.01.
Figure 9
Figure 9
Binding profile for TRs binding to PDIA1 under different redox state. (A) Anisotropy curves of PDIA1 titrated under TRα and TRβ labeled with FITC. (B) Binding constants found for TRα and TRβ bound to reduced or oxidized PDIA1 (PDI red or PDI red).

Similar articles

Cited by

References

    1. Sachs LM. Unliganded Thyroid hormone receptor function: amphibian metamorphosis got TALENs. Endocrinology (2015) 156:409–10. 10.1210/en.2014-2016 - DOI - PubMed
    1. Schroeder A, Jimenez R, Young B, Privalsky ML. The ability of thyroid hormone receptors to sense t4 as an agonist depends on receptor isoform and on cellular cofactors. Mol Endocrinol. (2014) 28:745–57. 10.1210/me.2013-1335 - DOI - PMC - PubMed
    1. Brent GA. Mechanisms of thyroid hormone action. J Clin Investig. (2012) 122:3035–43. 10.1172/JCI60047 - DOI - PMC - PubMed
    1. Chan IH, Privalsky ML. Isoform-specific transcriptional activity of overlapping target genes that respond to thyroid hormone receptors alpha1 and beta1. Mol Endocrinol. (2009) 23:1758–75. 10.1210/me.2009-0025 - DOI - PMC - PubMed
    1. Flamant F, Baxter JD, Forrest D, Refetoff S, Samuels H, Scanlan TS, et al. . International union of pharmacology. LIX The pharmacology and classification of the nuclear receptor superfamily: thyroid hormone receptors. Pharmacol Rev. (2006) 58:705–11. 10.1124/pr.58.4.3 - DOI - PubMed