. 2019 Jan 8:9:3075.
doi: 10.3389/fimmu.2018.03075. eCollection 2018.

Pregnancy Epigenetic Signature in T Helper 17 and T Regulatory Cells in Multiple Sclerosis

Affiliations

Pregnancy Epigenetic Signature in T Helper 17 and T Regulatory Cells in Multiple Sclerosis

Andrea Iannello et al. Front Immunol. .

Abstract

Increasing evidence supports the anti-inflammatory role of estrogens in Multiple Sclerosis (MS), originating from the observation of reduction in relapse rates among women with MS during pregnancy, but the molecular mechanisms are still not completely understood. Using an integrative data analysis, we identified T helper (Th) 17 and T regulatory (Treg) cell-type-specific regulatory regions (CSR) regulated by estrogen receptor alpha (ERα). These CSRs were validated in polarized Th17 from healthy donors (HD) and in peripheral blood mononuclear cells, Th17 and Treg cells from relapsing remitting (RR) MS patients and HD during pregnancy. 17β-estradiol induces active histone marks enrichment at Forkhead Box P3 (FOXP3)-CSRs and repressive histone marks enrichment at RAR related orphan receptor C (RORC)-CSRs in polarized Th17 cells. A disease-associated epigenetic profile was found in RRMS patients during pregnancy, suggesting a FOXP3 positive regulation and a RORC negative regulation in the third trimester of pregnancy. Altogether, these data indicate that estrogens act as immunomodulatory factors on the epigenomes of CD4+ T cells in RRMS; the identified CSRs may represent potential biomarkers for monitoring disease progression or new potential therapeutic targets.

Keywords: ERα; FOXP3; RORC; Th17; Treg; epigenetic profile; multiple sclerosis; pregnancy.


Figures
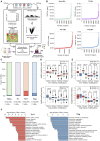
Figure 1
Figure 1
Active regulatory regions within super enhancers of CD4+ T cell subtypes (A) Workflow representation of our approach for data integration. SEs prediction in CD4+ T cell subtypes and chromatin states analysis were used for identification of active regulatory regions (left side). Overlap between these regions defines SE-ARRs. DE Gene expression analysis led to the identification of main TFs involved in Th17 and Treg lineage determination (right side). Finally, we reconstructed a SE-ARRs-associated TFs regulatory network in Th17 and Treg cells. By this analysis, we identified putative targets of ERα-mediated regulation in Th17 and Treg cells. (B) Prediction of SEs in Th17, Treg, Naive T, and Th cells by Rank Ordering of Super Enhancers (ROSE) algorithm. Line plot reports the cumulative number of enhancers identified in Th17 and Treg cells as function of the number of H3K27ac ChIP-Seq reads over the input dataset. Vertical lines represent the threshold over which H3K27ac signal intensity defines SEs. (C) Bar plot shows the fraction of ARRs overlapping SEs in Th17 and Treg. (D,E) Box plot shows the log2 normalized H3K27ac, H3K4me1, H3K27me3, and H3K9me3 ChIP-Seq signal measured in Th17- (D) and Treg- (E) SE-ARRs. On right panels SE-ARRs comparison with ARRs. P-value by Wilcoxon Rank-sum test. (F) Bar plot shows top 15 most significant Gene Ontology Biological Processes enriched by Genomic Regions Enrichment of Annotations Tool (GREAT) for genes mapped in proximity of Th17 (left) and Treg (right) SE-ARRs.
Figure 2
Figure 2
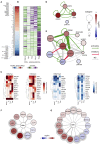
ERα-regulated genomic regulatory regions inTh17 and Treg cells. (A) Heat map representing the log2FC of expression computed between Th17 and Treg RNA-Seq data. Only data of SE-ARRs associated significantly DE genes between the two CD4+ cell type are reported. Genes are sorted by decreasing Th17/Treg log2FC. (B) Heat map representing the gene expression specificity computed in each CD4+ population as Z-score of expression. Purple colors represent specifically overexpressed genes while green color specifically underexpressed genes. (C) Heatmap shows log2 normalized H3K27ac, H3K4me1, H3K27me3 and H3K9me3 ChIP-Seq signal measured in CSRs associated nodes from Th17 and Treg core regulatory networks. Hierarchical clustering shows differences between the epigenetic asset of Treg- and Th17- CSRs. (D,E) Th17 (D) and Treg (E) core regulatory networks. Core regulatory networks are reconstructed by filtering total regulatory networks for SE-ARRs associated TFs with a significant fold change (DESeq adjusted p-value < 1 × 10⁻⁷). Node size is scaled to indegree values. Node color represents log2 fold change expression of Th17/Naive CD4+ cells and Treg/Naive CD4+ cells, respectively. Edge thickness is scaled to the sum of predicted TF binding sites at target-associated CSRs. Edge color represents positive (green) or negative (red) regulation inferred by Pearson correlation analysis between regulator and target gene expression. Positive and negative correlations are used to represent activatory and inhibitory network edges, respectively. Since PWMs are not available for all TFs, some interactions could not be predicted. (F,G) Networks show predicted ERα binding at SE-ARRs associated TFs in Th17 (F) and Treg (G) cells. Edge thickness is proportional to the number of ERE identified at target SE-ARRs. Node color represents log2 fold change expression of Th17/Naive CD4+ cells and Treg/Naive CD4+ cells, respectively. Node size is fixed. ERα targets included also in respective core regulatory network are highlighted with a gray circle.
Figure 3
Figure 3
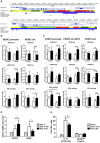
E2 impairs Th17 polarization inducing chromatin remodeling at CSRs. (A) UCSC Browser of human FOXP3 locus and RORC locus. First colored bars represent the chromatin states (e.g., yellow segments are classified as active enhancers). Blue bars are predicted SEs, purple bars are ARRs and green bars are the regions that we analyzed. (B–E) PBMCs from five HD were polarized under Th17 polarizing conditions with or without E2 treatment. ChIP-qPCR analysis of H3K4me3, H3K27me3, H3K4me1, H3K27ac, and ERα at RORC- (B) and FOXP3- (C) CSRs. Columns represent the enrichment of the immunoprecipitation over non-specific IgG and normalized for input chromatin at 30 min and 3 days of stimulation. FOXP3 and RORC mRNA expression (D), and FACS analysis of Th17 and Treg cells in CD4_lymphocytes (E) stimulated for 3 days. *p < 0.05, **p < 0.01, and ***p < 0.001 represent the statistical significance.
Figure 4
Figure 4
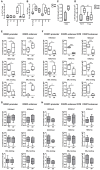
Epigenetic changes at FOXP3 and RORC loci in PBMCs from MS patients during pregnancy. (A,B) Th17 and Treg cells percentage, evaluated by FACS, in the PBMCs of HD (gray bars) and MS patients (white bar) non-pregnant, during the T3 and in the pp. (C,D) Expression of ERα, evaluated by FACS, on total CD4+ T cells, Th17, and Treg cells from HD and MS patients. Graph shows ERα specific cell-associated mean fluorescence (ΔMFI). (E–H) ChIP-qPCR analysis of H3K4me3, H3K27me3, H3K4me1, H3K27ac, and ERα binding on PBMCs derived from MS patients (E,F) and HD (G,H) during T3 and in the pp. Boxes, with mean, minimum and maximum, represent the enrichment of the immunoprecipitation over non-specific IgG and normalized for input chromatin. *p < 0.05, **p < 0.01 and ***p < 0.001 represent the statistical significance.
Figure 5
Figure 5
Epigenetic changes at FOXP3 and RORC loci in Treg and Th17 purified from MS patients during pregnancy. ChIP-qPCR analysis of H3K4me3, H3K27me3, H3K4me1, H3K27ac, and ERα binding performed at RORC- (A) and FOXP3-CSRs (B) in Th17 (red) and Treg (blu) cells, derived from MS patients during third trimester of pregnancy T3 (filled texture) and during the post-partum pp (squared texture) phase. Boxes, with mean, minimum and maximum, represent the enrichment of the immunoprecipitation over non-specific IgG and normalized for input chromatin. *p < 0.05 and **p < 0.01 represent the statistical significance.

References

    1. Compston A, Coles A. Multiple sclerosis. Lancet (2008) 372:1502–17. 10.1016/S0140-6736(08)61620-7 - DOI - PubMed
    1. Orton SM, Herrera BM, Yee IM, Valdar W, Ramagopalan SV, Sadovnick AD, et al. . Sex ratio of multiple sclerosis in Canada: a longitudinal study. Lancet Neurol. (2006) 5:932–6. 10.1016/S1474-4422(06)70581-6 - DOI - PubMed
    1. Durelli L, Conti L, Clerico M, Boselli D, Contessa G, Ripellino P, et al. . T-helper 17 cells expand in multiple sclerosis and are inhibited by interferon-beta. Ann Neurol. (2009) 65:499–509. 10.1002/ana.21652 - DOI - PubMed
    1. Becher B, Segal BM. T H17 cytokines in autoimmune neuro-inflammation Curr Opin Immunol. (2011) 23:707–12. 10.1016/j.coi.2011.08.005 - DOI - PMC - PubMed
    1. Viglietta V, Baecher-Allan C, Weiner HL, Hafler DA. Loss of functional suppression by CD4+CD25+ regulatory T cells in patients with multiple sclerosis. J Exp Med. (2004) 199:971–9. 10.1084/jem.20031579 - DOI - PMC - PubMed

Publication types

MeSH terms