. 2018 Dec;34(4):176-184.
doi: 10.5625/lar.2018.34.4.176. Epub 2018 Dec 31.

Changes of myelin basic protein in the hippocampus of an animal model of type 2 diabetes

Affiliations

Changes of myelin basic protein in the hippocampus of an animal model of type 2 diabetes

Sung Min Nam et al. Lab Anim Res. 2018 Dec.

Abstract

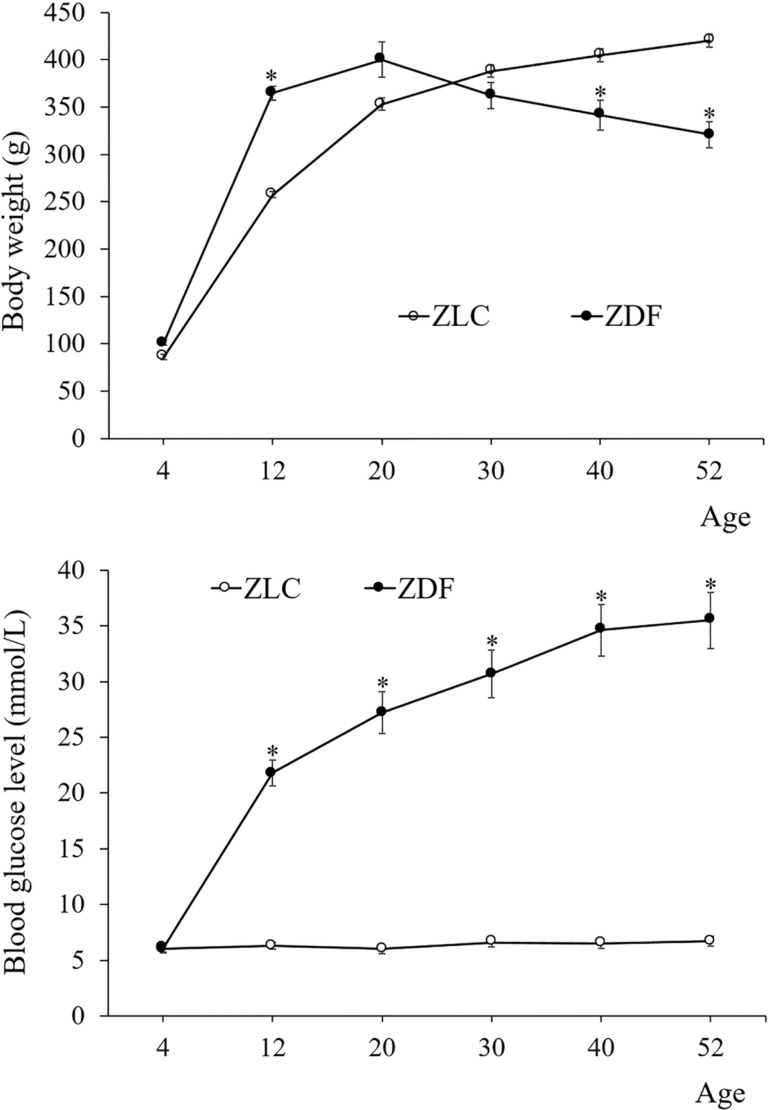
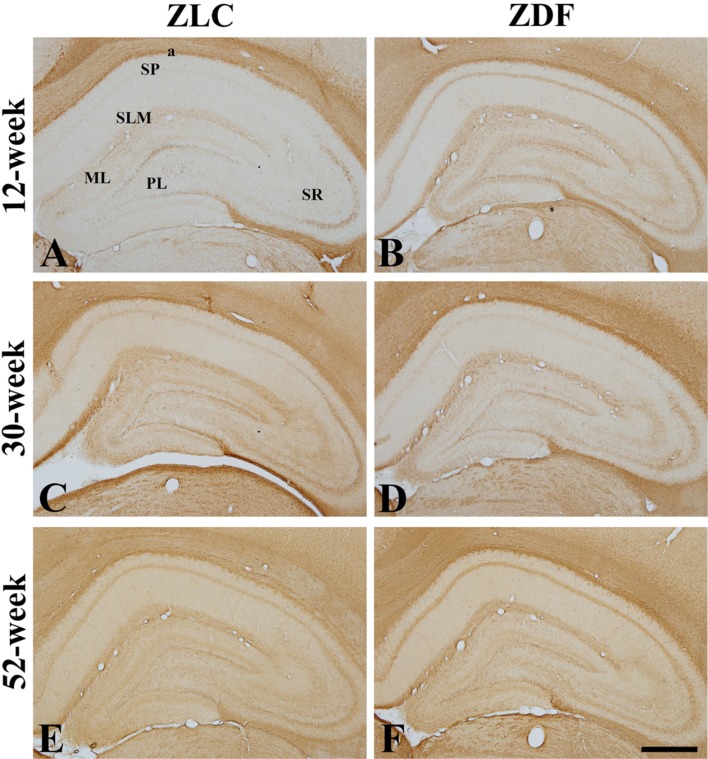
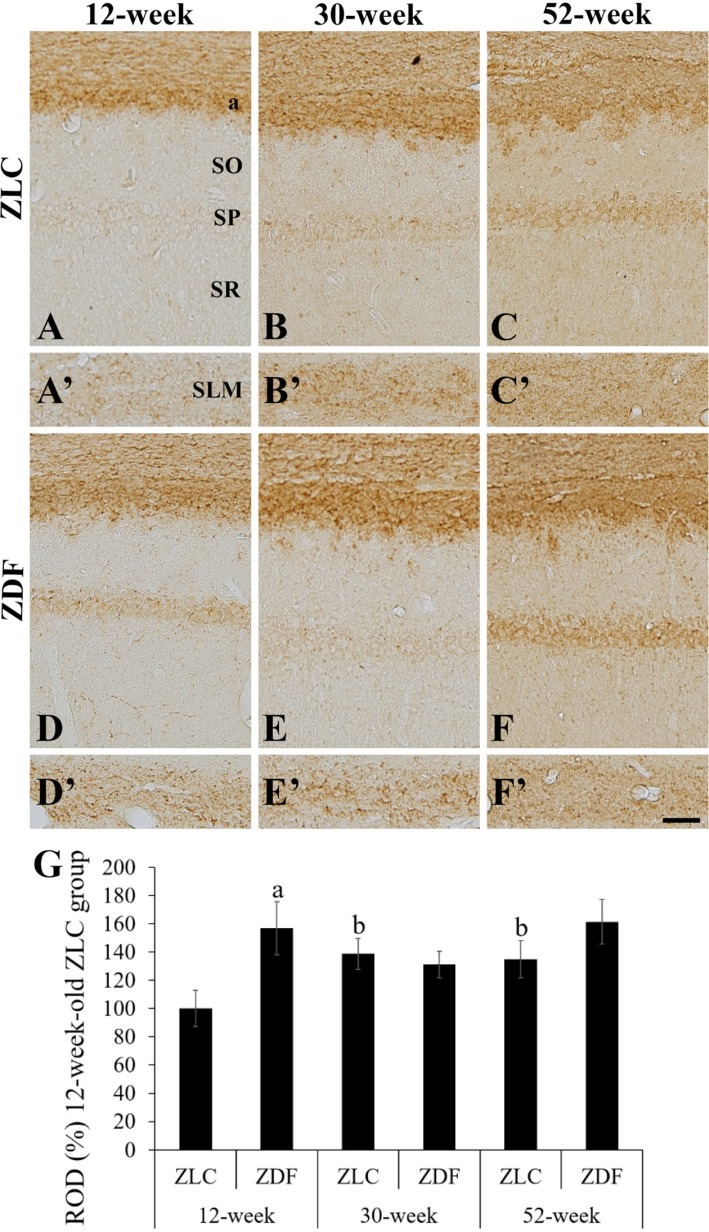
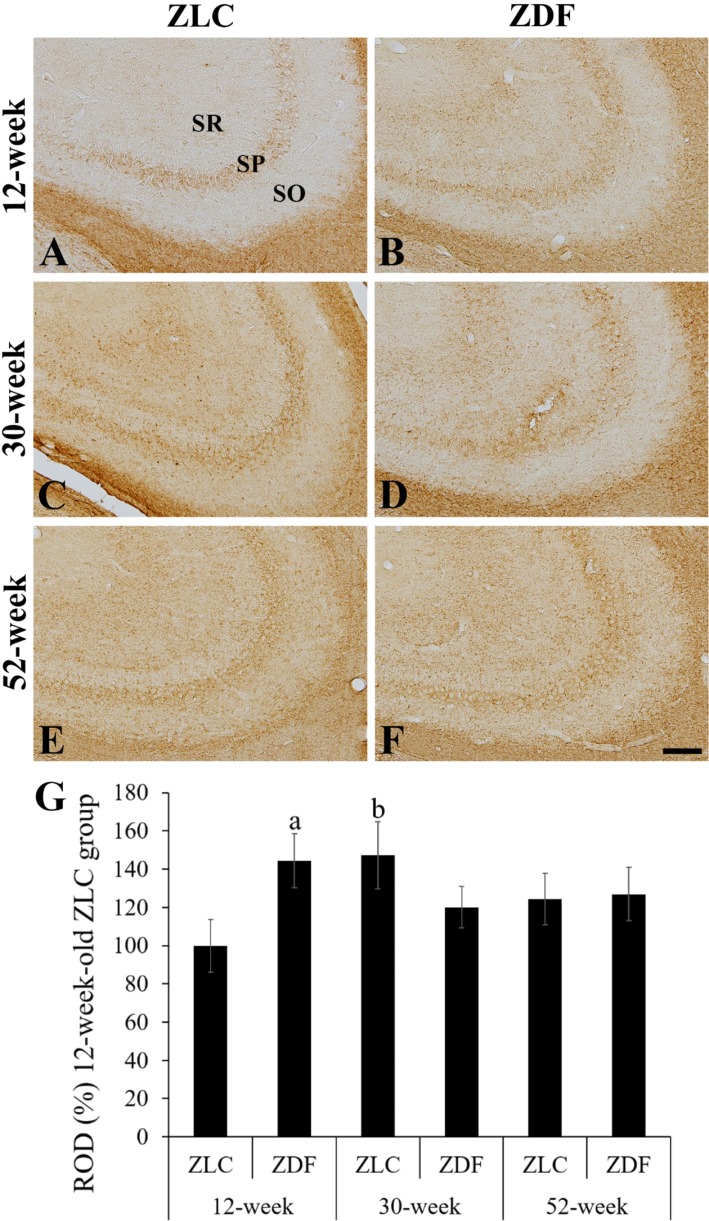
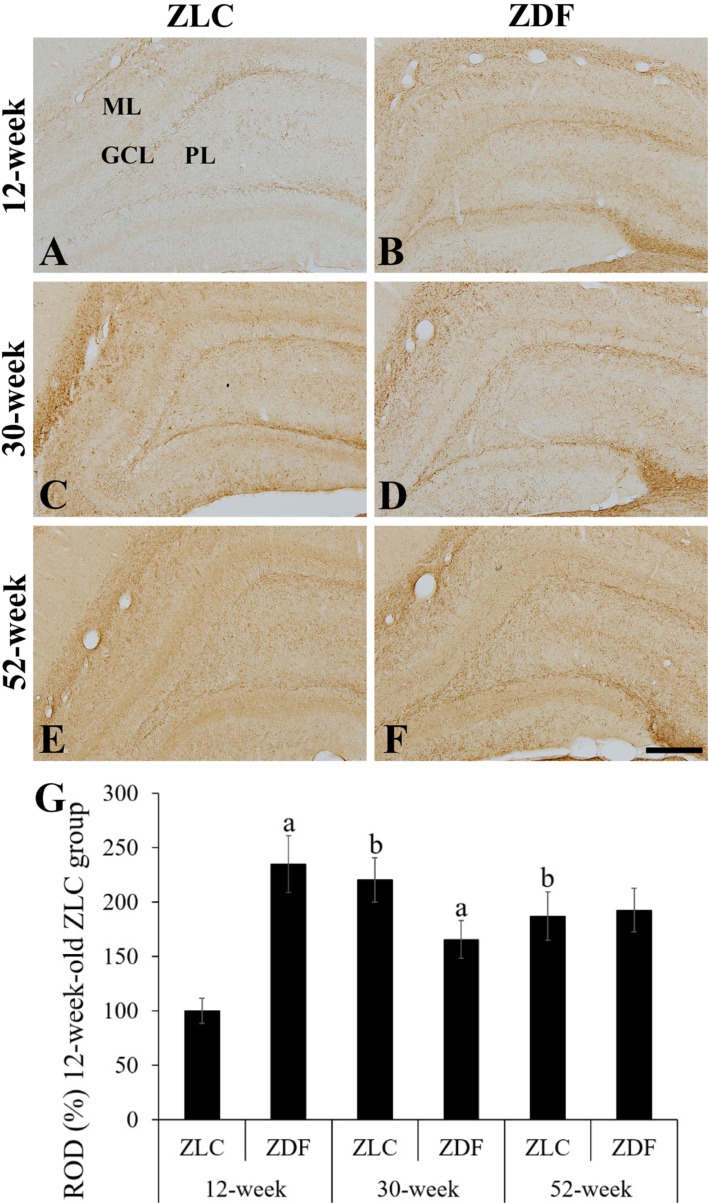
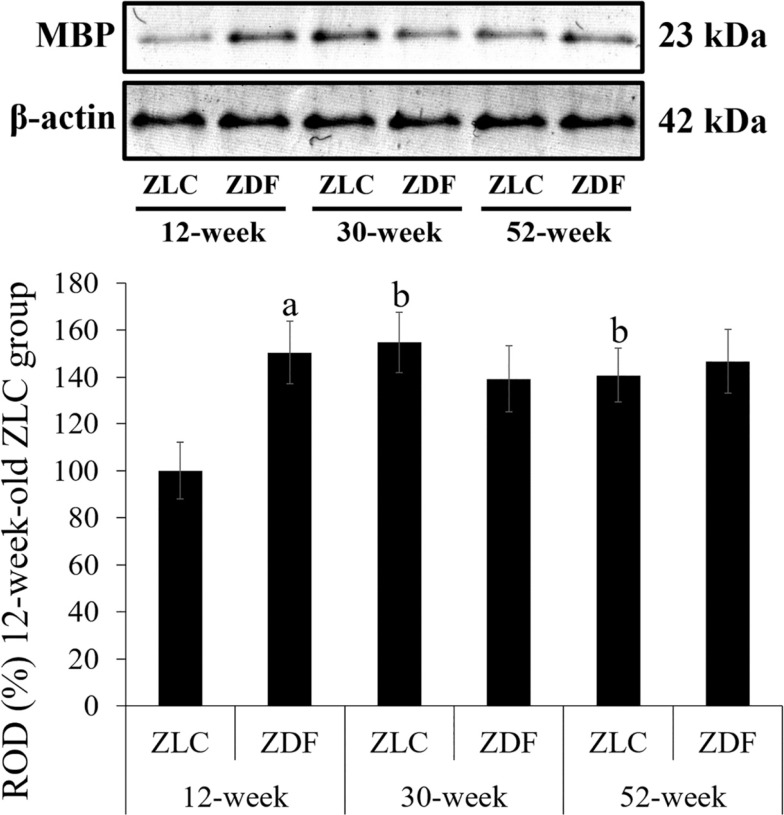
In this study, we observed chronological changes in the immunoreactivity and expression level of myelin basic protein (MBP), one of the most abundant proteins in the central nervous system, in the hippocampus of Zucker diabetic fatty (ZDF) rats and their control littermates (Zucker lean control; ZLC). In the ZLC group, body weight steadily increased with age; the body weight of the ZDF group, however, peaked at 30 weeks of age, and subsequently decreased. Based on the changes of body weight, animals were divided into the following six groups: early (12-week), middle (30-week), and chronic (52-week) diabetic groups and their controls. MBP immunoreactivity was found in the alveus, strata pyramidale, and lacunosum-moleculare of the CA1 region, strata pyramidale and radiatum of the CA3 region, and subgranular zone, polymorphic layer, and molecular layer of the dentate gyrus. MBP immunoreactivity was lowest in the hippocampus of 12-week-old rats in the ZLC group, and highest in 12-week-old rats in the ZDF group. Diabetes increased MBP levels in the 12-week-old group, while MBP immunoreactivity decreased in the 30-week-old group. In the 52-week-old ZLC and ZDF groups, MBP immunoreactivity was detected in the hippocampus, similar to the 30-week-old ZDF group. Western blot results corroborated with immunohistochemical results. These results suggested that changes in the immunoreactivity and expression of MBP in the hippocampus might be a compensatory response to aging, while the sustained levels of MBP in diabetic animals could be attributed to a loss of compensatory responses in oligodendrocytes.

Keywords: Myelin basic protein; age; hippocampus; type 2 diabetes.


Conflict of interest statement

Conflict of interests: The authors declare that there is no financial conflict of interests to publish these results.

Figures

Figure 1
Figure 1. Body weight changes (A) and fed blood glucose levels (B) of Zucker lean control (ZLC) and Zucker diabetic fatty (ZDF) rats, at 4, 12, 20, 30, 40, and 52 months of age (n=10). Data shown as mean±standard error of mean (SEM). *P<0.05 (compared to age-matched ZLC group)
Figure 2
Figure 2. Immunohistochemistry of myelin basic protein (MBP) in the whole hippocampus of Zucker lean control (ZLC; A, C, and E) and Zucker diabetic fatty (ZDF) rats (B, D, and F), at 12 (A and B), 30 (C and D), and 52 (E and F) weeks of age. MBP immunoreactivity is found in the alveus (a), stratum lacunosum moleculare (SML), and stratum pyramidale (SP) of the CA1 region, the stratum radiatum (SR) and SP of the CA3 region, and the subgranular zone, polymorphic layer (PL), and molecular layer (ML) of the dentate gyrus. Note that MBP immunoreactive structures are least abundant in the hippocampus in the 12-week old ZLC rats, and were most abundant in the 12-week-old ZDF or 30-week-old ZLC rats. Scale bar=400 µm.
Figure 3
Figure 3. High magnification of myelin basic protein (MBP) immunoreactive structures in the CA1 region (A–F) and stratum lacunosum-moleculare (SLM, A′–F′) of Zucker lean control (ZLC; A–C and A′–C′) and Zucker diabetic fatty (ZDF; D–F and D′–F′) rats, at 12 (A, A′, D, and D′), 30 (B, B′, E, and E′), and 52 (C, C′, F, and F′) weeks of age. MBP immunoreactivity is detected in the stratum pyramidale (SP), alveus (a), and SLM of the CA1 region. SO, stratum oriens. Scale bar=50 µm. G: Relative optical densities (ROD) are expressed as a percentage of the value of the MBP immunoreactivity in the CA1 region in 12-week old ZLC rats (n=5 in each group). Data are analyzed with a two-way analysis of variance, followed by a Bonferroni's post-hoc test (aP<0.05, significantly different from the ZLC group, bP<0.05, significantly different from the 12-week-old group). Data shown as mean±standard error of mean (SEM).
Figure 4
Figure 4. High magnification of myelin basic protein (MBP) immunoreactive structures in the CA3 region of Zucker lean control (ZLC; A, C, and E) and Zucker diabetic fatty (ZDF; B, D, and F) rats at 12 (A and B), 30 (C and D), and 52 (E and F) weeks of age. MBP immunoreactivity is detected in the stratum pyramidale (SP) and radiatum (SR) of the CA3 region. SO, stratum oriens. Scale bar=50 µm. G: Relative optical densities (ROD) are expressed as a percentage of the value of the MBP immunoreactivity in the CA3 region in the 12-week-old ZLC group (n=5 in each group). Data are analyzed by a two-way analysis of variance followed by a Bonferroni's post-hoc test (aP<0.05, significantly different from the ZLC group, bP<0.05, significantly different from the 12-week-old group). Data shown as mean±standard error of mean (SEM).
Figure 5
Figure 5. High magnification of myelin basic protein (MBP) immunoreactive structures in the dentate gyrus of Zucker lean control (ZLC; A, C, and E) and Zucker diabetic fatty (ZDF; B, D, and F) rats at 12 (A and B), 30 (C and D), and 52 (E and F) weeks of age. MBP immunoreactivity is observed in the subgranular zone, polymorphic layer (PL), and molecular layer (ML) of the dentate gyrus. GCL, granule cell layer. Scale bar=100 µm. G: Relative optical densities (ROD) are expressed as a percentage of the value of the MBP immunoreactivity in the dentate gyrus in the 12-week-old ZLC group (n=5 in each group). Data are analyzed using a two-way analysis of variance followed by a Bonferroni's post-hoc test (aP<0.05, significantly different from the ZLC group, bP<0.05, significantly different from the 12-week-old group). Data shown as mean±standard error of mean (SEM).
Figure 6
Figure 6. Western blot analysis. Protein levels are expressed as a percentage of the level of myelin basic protein (MBP), normalized to the â-actin protein level, in the hippocampal homogenates of Zucker lean control (ZLC) and Zucker diabetic fatty (ZDF) rats, at 12, 30, and 52 weeks of age. G: Relative optical densities (ROD) are expressed as a percentage of the value of the MBP protein band in the dentate gyrus in the 12-week-old ZLC group (n=5 in each group). Data are analyzed using a two-way analysis of variance followed by a Bonferroni's post-hoc test (aP<0.05, significantly different from the ZLC group, bP<0.05, significantly different from the 12-week-old group). Data shown as mean±standard error of mean (SEM).

Similar articles

Cited by

References

    1. Benedict C, Grillo CA. Insulin Resistance as a Therapeutic Target in the Treatment of Alzheimer's Disease: A State-of-the-Art Review. Front Neurosci. 2018;12:215. - PMC - PubMed
    1. Salunkhe VA, Veluthakal R, Kahn SE, Thurmond DC. Novel approaches to restore beta cell function in prediabetes and type 2 diabetes. Diabetologia. 2018;61(9):1895–1901. - PMC - PubMed
    1. Derakhshan F, Toth C. Insulin and the brain. Curr Diabetes Rev. 2013;9(2):102–116. - PubMed
    1. Kalaria RN. Neurodegenerative disease: Diabetes, microvascular pathology and Alzheimer disease. Nat Rev Neurol. 2009;5(6):305–306. - PubMed
    1. Bauduceau B, Doucet J, Bordier L, Garcia C, Dupuy O, Mayaudon H. Hypoglycaemia and dementia in diabetic patients. Diabetes Metab. 2010;36(Suppl 3):S106–S111. - PubMed