

Estimating the incidence and diagnosed proportion of HIV infections in Japan: a statistical modeling study
- PMID: 30671310
- PMCID: PMC6338104
- DOI: 10.7717/peerj.6275
Estimating the incidence and diagnosed proportion of HIV infections in Japan: a statistical modeling study
Abstract
Background: Epidemiological surveillance of HIV infection in Japan involves two technical problems for directly applying a classical backcalculation method, i.e., (i) all AIDS cases are not counted over time and (ii) people diagnosed with HIV have received antiretroviral therapy, extending the incubation period. The present study aimed to address these issues and estimate the HIV incidence and the proportion of diagnosed HIV infections, using a simple statistical model.
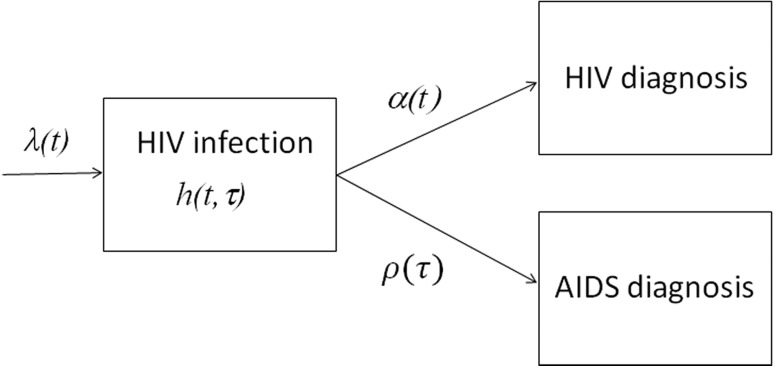
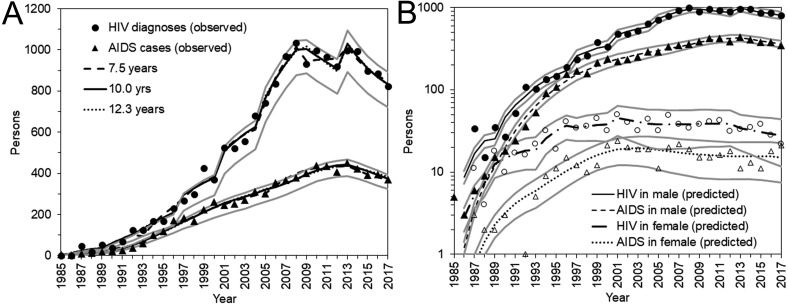
Methods: From among Japanese nationals, yearly incidence data of HIV diagnoses and patients with AIDS who had not previously been diagnosed as HIV positive, from 1985 to 2017, were analyzed. Using the McKendrick partial differential equation, general convolution-like equations were derived, allowing estimation of the HIV incidence and the time-dependent rate of diagnosis. A likelihood-based approach was used to obtain parameter estimates.
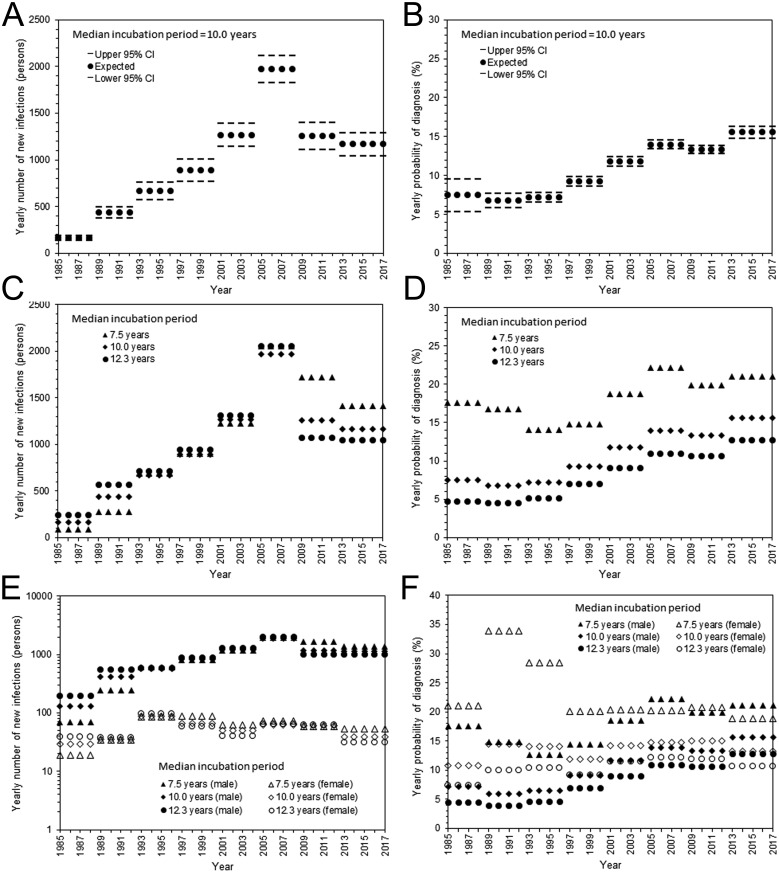
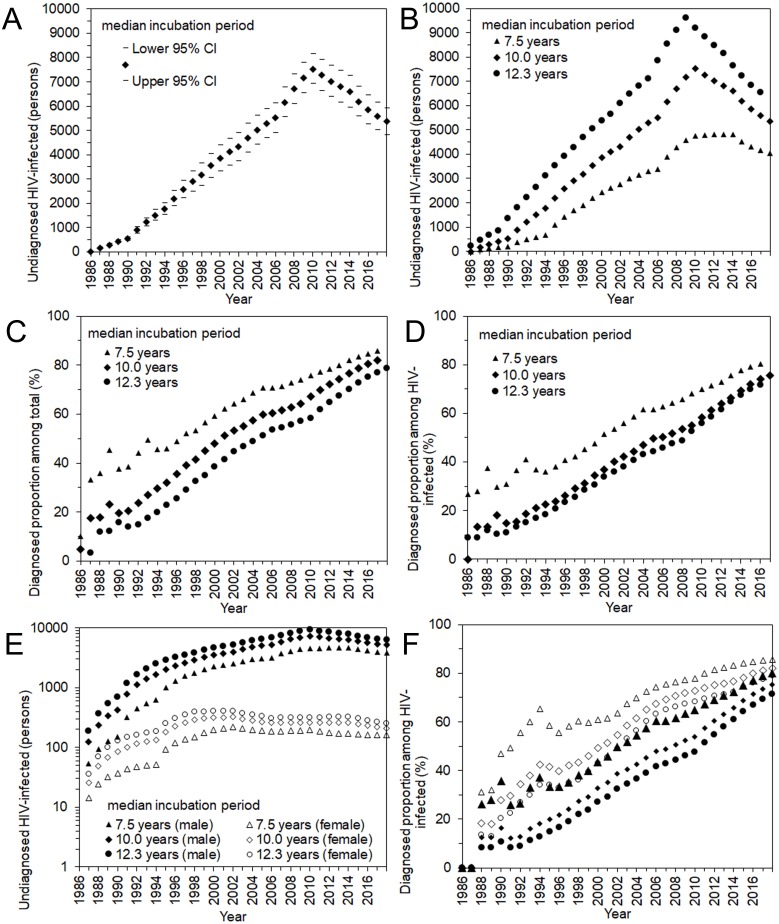
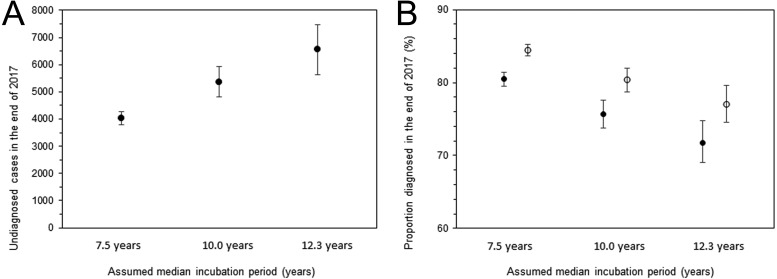
Results: Assuming that the median incubation period was 10.0 years, the cumulative number of HIV infections was estimated to be 29,613 (95% confidence interval (CI): 29,059, 30,167) by the end of 2017, and the proportion of diagnosed HIV infections was estimated at 80.3% (95% CI [78.7%-82.0%]). Allowing the median incubation period to range from 7.5 to 12.3 years, the estimate of the proportion diagnosed can vary from 77% to 84%.
Discussion: The proportion of diagnosed HIV infections appears to have not yet reached 90% among Japanese nationals. Compared with the peak incidence from 2005-2008, new HIV infections have clearly been in a declining trend; however, there are still more than 1,000 new HIV infections per year in Japan. To increase the diagnosed proportion of HIV infections, it is critical to identify people who have difficulty accessing consultation, testing, and care, and to explore heterogeneous patterns of infection.
Keywords: Ascertainment; Epidemic; Forecasting; Opportunistic infection; Outbreak; Statistical estimation; Statistical model; Test and treat.
Conflict of interest statement
Hiroshi Nishiura is an Academic Editor for PeerJ and has no competing interests.
Figures
Similar articles
-
Investigation of the Proportion of Diagnosed People Living with HIV/AIDS among Foreign Residents in Japan.J Clin Med. 2019 Jun 5;8(6):804. doi: 10.3390/jcm8060804. J Clin Med. 2019. PMID: 31195745 Free PMC article.
-
HIV incidence before and during the COVID-19 pandemic in Japan.Math Biosci Eng. 2024 Feb 29;21(4):4874-4885. doi: 10.3934/mbe.2024215. Math Biosci Eng. 2024. PMID: 38872518
-
Estimating HIV-1 incidence in Japan from the proportion of recent infections.Prev Med Rep. 2019 Oct 21;16:100994. doi: 10.1016/j.pmedr.2019.100994. eCollection 2019 Dec. Prev Med Rep. 2019. PMID: 31720200 Free PMC article.
-
Modeling methods for estimating HIV incidence: a mathematical review.Theor Biol Med Model. 2020 Jan 22;17(1):1. doi: 10.1186/s12976-019-0118-0. Theor Biol Med Model. 2020. PMID: 31964392 Free PMC article. Review.
-
HIV infection/AIDS in the United States during the 1990s.Clin Infect Dis. 1993 Aug;17 Suppl 1:S219-23. doi: 10.1093/clinids/17.supplement_1.s219. Clin Infect Dis. 1993. PMID: 8399920 Review.
Cited by
-
HIV Testing by Public Health Centers and Municipalities and New HIV Cases During the COVID-19 Pandemic in Japan.J Acquir Immune Defic Syndr. 2021 Jun 1;87(2):e182-e187. doi: 10.1097/QAI.0000000000002660. J Acquir Immune Defic Syndr. 2021. PMID: 33625066 Free PMC article.
-
Regional variations in HIV diagnosis in Japan before and during the COVID-19 pandemic.Infect Dis Model. 2024 Aug 16;10(1):40-49. doi: 10.1016/j.idm.2024.08.004. eCollection 2025 Mar. Infect Dis Model. 2024. PMID: 39319285 Free PMC article.
-
Investigation of the Proportion of Diagnosed People Living with HIV/AIDS among Foreign Residents in Japan.J Clin Med. 2019 Jun 5;8(6):804. doi: 10.3390/jcm8060804. J Clin Med. 2019. PMID: 31195745 Free PMC article.
-
Estimation of the Number of HIV Infections and Time to Diagnosis in the Korea.J Korean Med Sci. 2020 Feb 17;35(6):e41. doi: 10.3346/jkms.2020.35.e41. J Korean Med Sci. 2020. PMID: 32056401 Free PMC article.
-
Association of demographics, HCV co-infection, HIV-1 subtypes and genetic clustering with late HIV diagnosis: a retrospective analysis from the Japanese Drug Resistance HIV-1 Surveillance Network.J Int AIDS Soc. 2023 May;26(5):e26086. doi: 10.1002/jia2.26086. J Int AIDS Soc. 2023. PMID: 37221951 Free PMC article.
References
-
- Boldson JL, Jensen JL, Sogarrd J, Sorensen M. On the incubation time distribution and the Danish AIDS data. Journal of the Royal Statistical Society, Series A. 1988;151:42–43. doi: 10.2307/2982183. - DOI
-
- Brookmeyer R, Gail MH. Minimum size of the acquired immunodeficiency syndrome (AIDS) epidemic in the United States. Lancet. 1986;2:1320–1322. - PubMed
-
- Brookmeyer R, Gail MH. AIDS epidemiology: a quantitative approach. Oxford University Press; New York: 1994.
LinkOut - more resources
Full Text Sources
