

Functional Blockade of Small GTPase RAN Inhibits Glioblastoma Cell Viability
- PMID: 30671385
- PMCID: PMC6331428
- DOI: 10.3389/fonc.2018.00662
Functional Blockade of Small GTPase RAN Inhibits Glioblastoma Cell Viability
Abstract
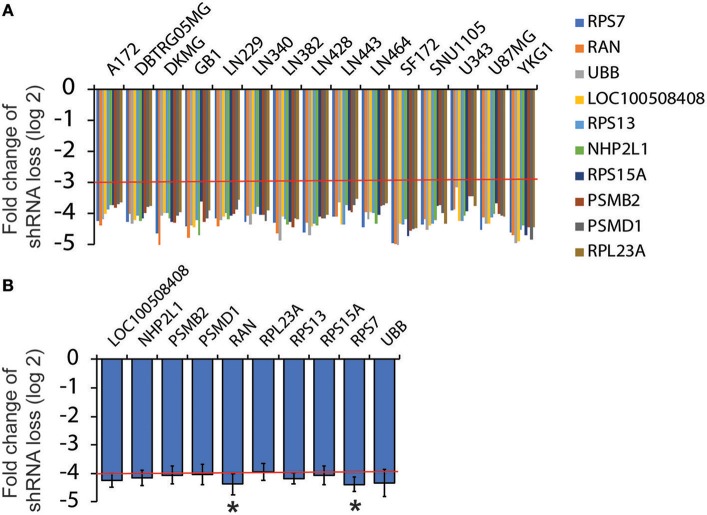
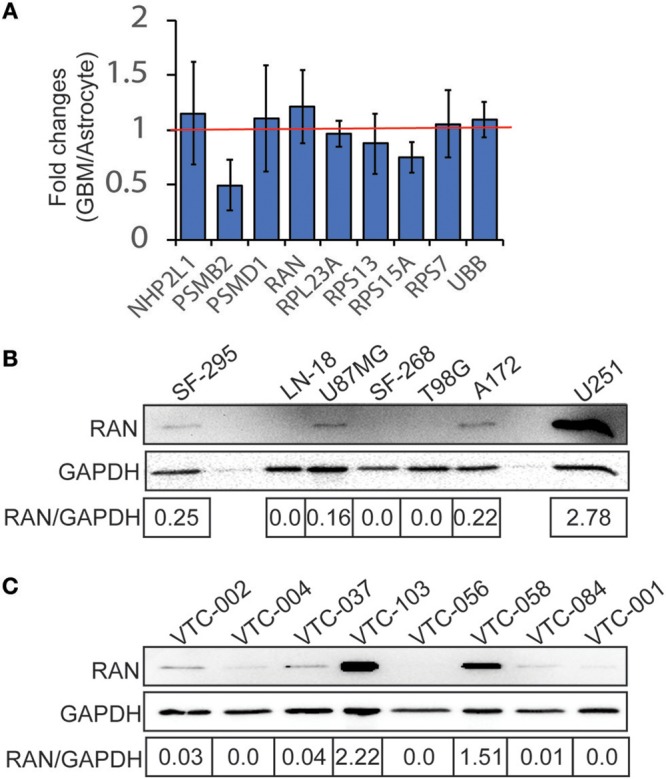
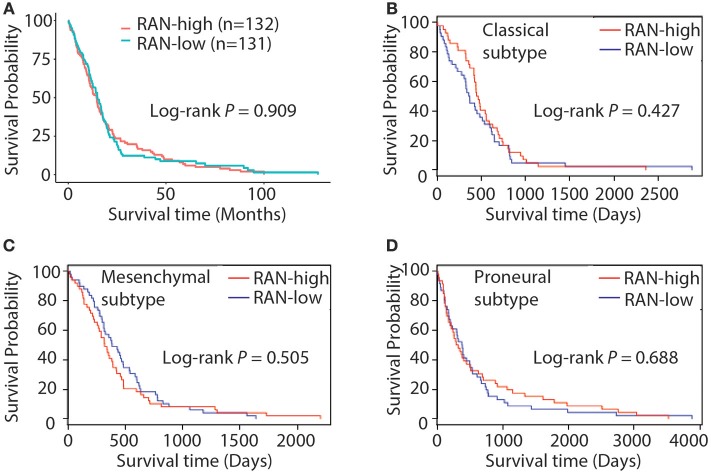
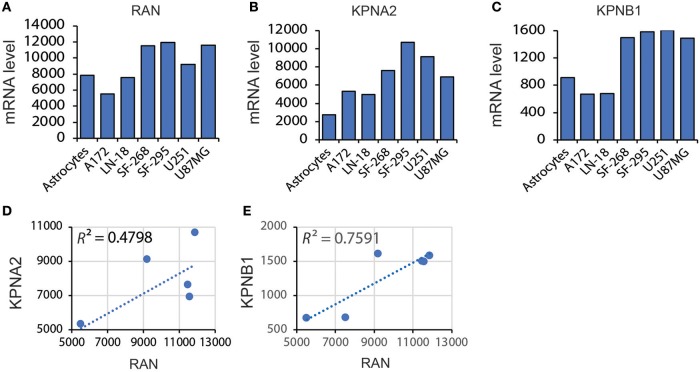
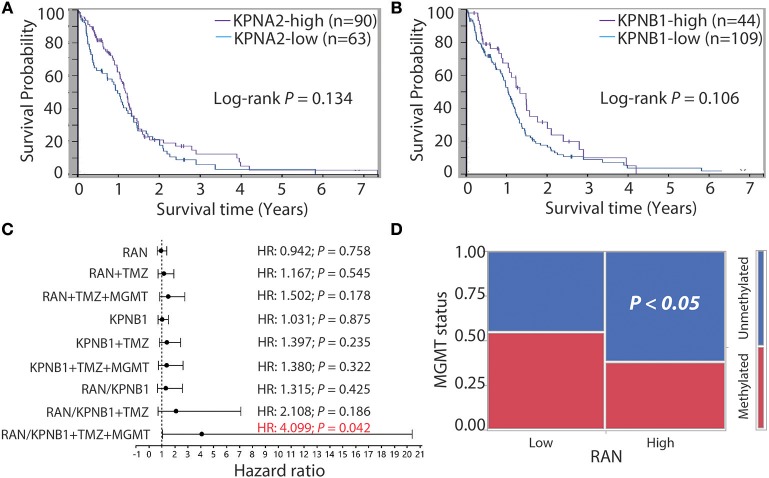
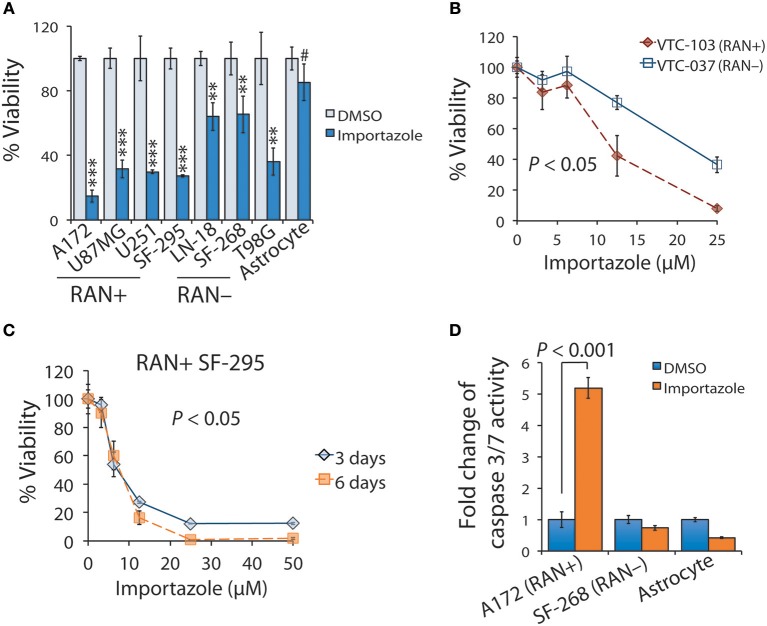
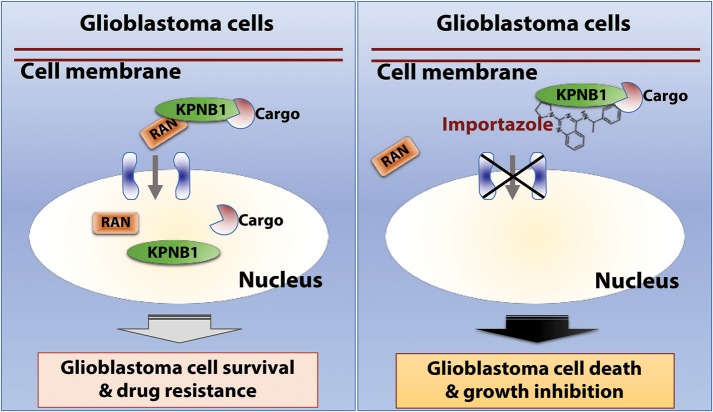
Glioblastoma, the most common malignant tumor in the brain, lacks effective treatments and is currently incurable. To identify novel drug targets for this deadly cancer, the publicly available results of RNA interference screens from the Project Achilles database were analyzed. Ten candidate genes were identified as survival genes in 15 glioblastoma cell lines. RAN, member RAS oncogene family (RAN) was expressed in glioblastoma at the highest level among all candidates based upon cDNA microarray data. However, Kaplan-Meier survival analysis did not show any correlation between RAN mRNA levels and patient survival. Because RAN is a small GTPase that regulates nuclear transport controlled by karyopherin subunit beta 1 (KPNB1), RAN was further analyzed together with KPNB1. Indeed, GBM patients with high levels of RAN also had more KPNB1 and levels of KPNB1 alone did not relate to patient prognosis. Through a Cox multivariate analysis, GBM patients with high levels of RAN and KPNB1 showed significantly shorter life expectancy when temozolomide and promoter methylation of O6-methylguanine DNA methyltransferase were used as covariates. These results indicate that RAN and KPNB1 together are associated with drug resistance and GBM poor prognosis. Furthermore, the functional blockade of RAN and KPNB1 by importazole remarkably suppressed cell viability and activated apoptosis in GBM cells expressing high levels of RAN, while having a limited effect on astrocytes and GBM cells with undetectable RAN. Together, our results demonstrate that RAN activity is important for GBM survival and the functional blockade of RAN/KPNB1 is an appealing therapeutic approach.
Keywords: KPNB1; RAN; cell survival; glioblastoma; glioblastoma prognosis; glioblastoma treatment; importazole.
Figures
Similar articles
-
Stabilization of KPNB1 by deubiquitinase USP7 promotes glioblastoma progression through the YBX1-NLGN3 axis.J Exp Clin Cancer Res. 2024 Jan 23;43(1):28. doi: 10.1186/s13046-024-02954-8. J Exp Clin Cancer Res. 2024. PMID: 38254206 Free PMC article.
-
Karyopherin-β1 Regulates Radioresistance and Radiation-Increased Programmed Death-Ligand 1 Expression in Human Head and Neck Squamous Cell Carcinoma Cell Lines.Cancers (Basel). 2020 Apr 8;12(4):908. doi: 10.3390/cancers12040908. Cancers (Basel). 2020. PMID: 32276424 Free PMC article.
-
Nuclear translocation of fibroblast growth factor-2 (FGF2) is regulated by Karyopherin-β2 and Ran GTPase in human glioblastoma cells.Oncotarget. 2015 Aug 28;6(25):21468-78. doi: 10.18632/oncotarget.4097. Oncotarget. 2015. PMID: 26056081 Free PMC article.
-
Astragaloside Ⅳ mediates the effect and mechanism of KPNB1 on biological behavior and tumor growth in prostate cancer.Heliyon. 2024 Jun 28;10(13):e33904. doi: 10.1016/j.heliyon.2024.e33904. eCollection 2024 Jul 15. Heliyon. 2024. PMID: 39027542 Free PMC article.
-
Tumor-promoting properties of karyopherin β1 in melanoma by stabilizing Ras-GTPase-activating protein SH3 domain-binding protein 1.Cancer Gene Ther. 2022 Dec;29(12):1939-1950. doi: 10.1038/s41417-022-00508-8. Epub 2022 Jul 28. Cancer Gene Ther. 2022. PMID: 35902727 Free PMC article.
Cited by
-
Hypoxia-Induced Adaptations of miRNomes and Proteomes in Melanoma Cells and Their Secreted Extracellular Vesicles.Cancers (Basel). 2020 Mar 14;12(3):692. doi: 10.3390/cancers12030692. Cancers (Basel). 2020. PMID: 32183388 Free PMC article.
-
Impact of IDH Mutations, the 1p/19q Co-Deletion and the G-CIMP Status on Alternative Splicing in Diffuse Gliomas.Int J Mol Sci. 2023 Jun 6;24(12):9825. doi: 10.3390/ijms24129825. Int J Mol Sci. 2023. PMID: 37372972 Free PMC article.
-
Allostery in Disease: Anticancer Drugs, Pockets, and the Tumor Heterogeneity Challenge.J Mol Biol. 2025 Feb 26:169050. doi: 10.1016/j.jmb.2025.169050. Online ahead of print. J Mol Biol. 2025. PMID: 40021049 Review.
-
Connexin 43 confers chemoresistance through activating PI3K.Oncogenesis. 2022 Jan 12;11(1):2. doi: 10.1038/s41389-022-00378-7. Oncogenesis. 2022. PMID: 35022385 Free PMC article.
-
The association of RAN and RANBP2 gene polymerphisms with Wilms tumor risk in Chinese children.J Cancer. 2020 Jan 1;11(4):804-809. doi: 10.7150/jca.36651. eCollection 2020. J Cancer. 2020. PMID: 31949483 Free PMC article.
References
LinkOut - more resources
Full Text Sources
Other Literature Sources
Research Materials
Miscellaneous