. 2019 Aug;29(8):683-709.
doi: 10.1002/hipo.23062. Epub 2019 Jan 23.

Adult neurogenesis in the mouse dentate gyrus protects the hippocampus from neuronal injury following severe seizures

Affiliations

Adult neurogenesis in the mouse dentate gyrus protects the hippocampus from neuronal injury following severe seizures

Swati Jain et al. Hippocampus. 2019 Aug.

Abstract

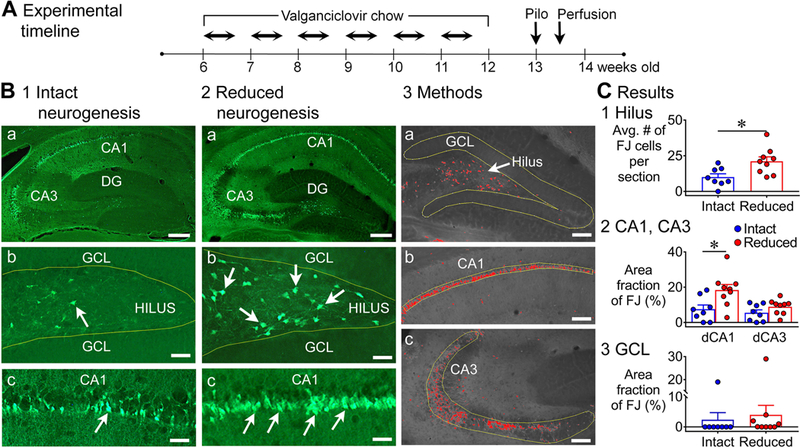
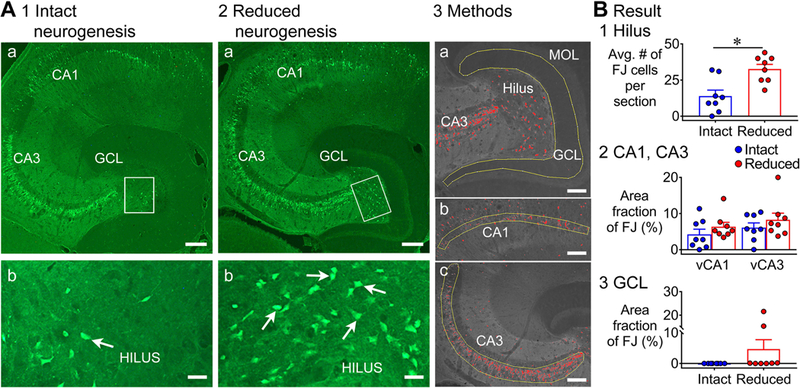
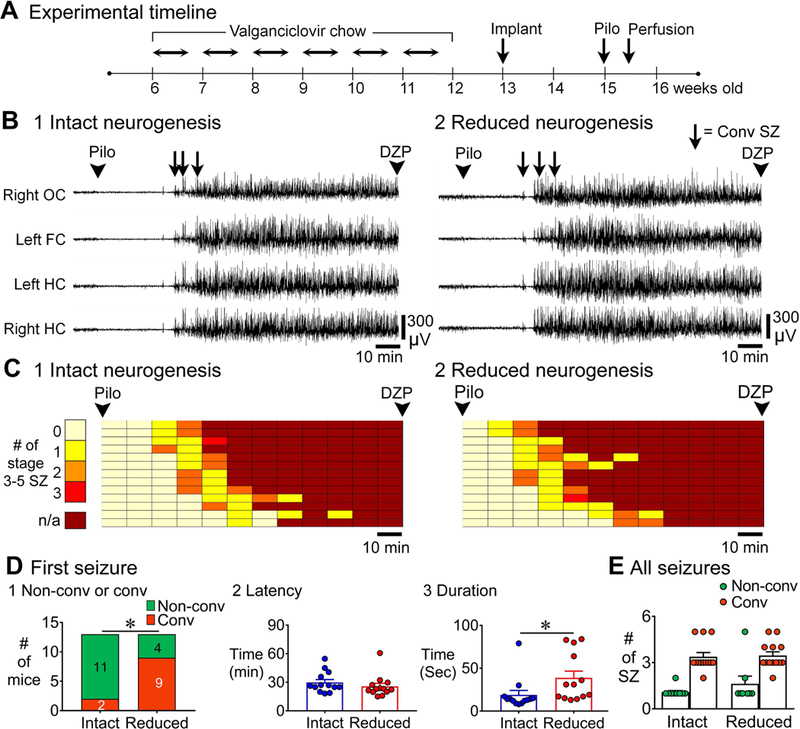
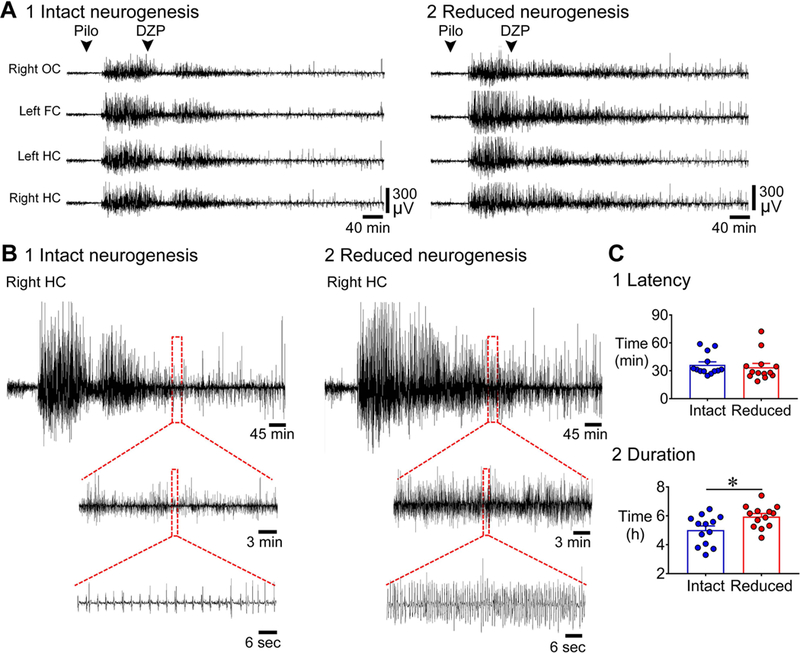
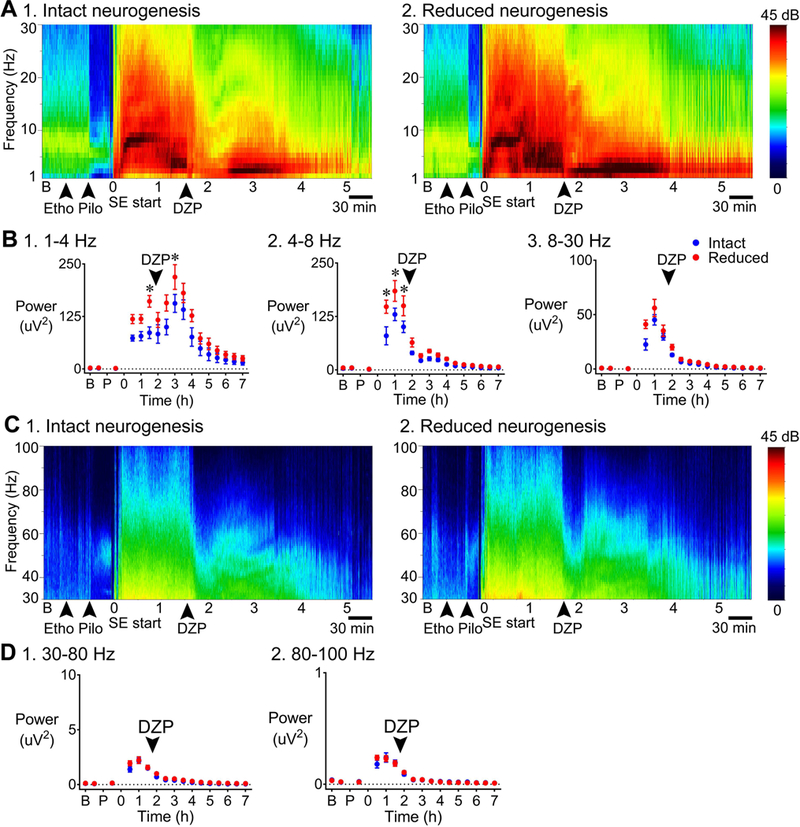
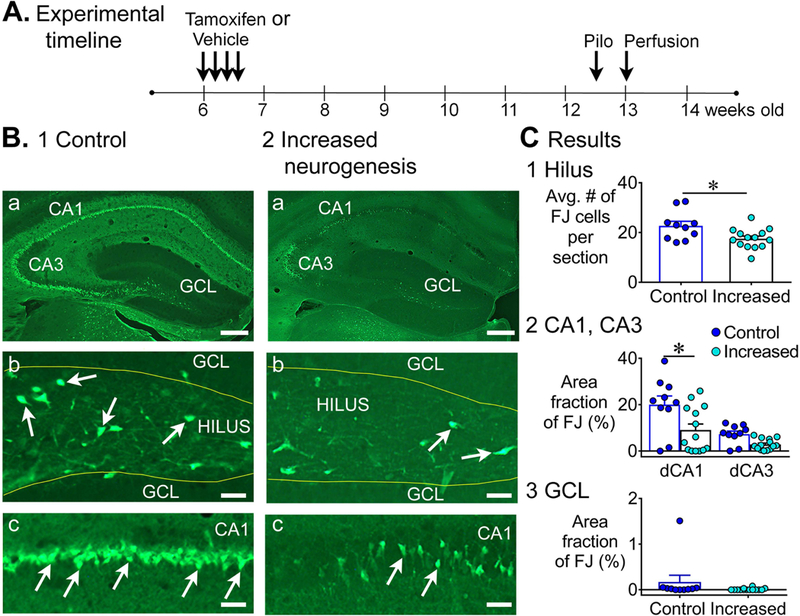
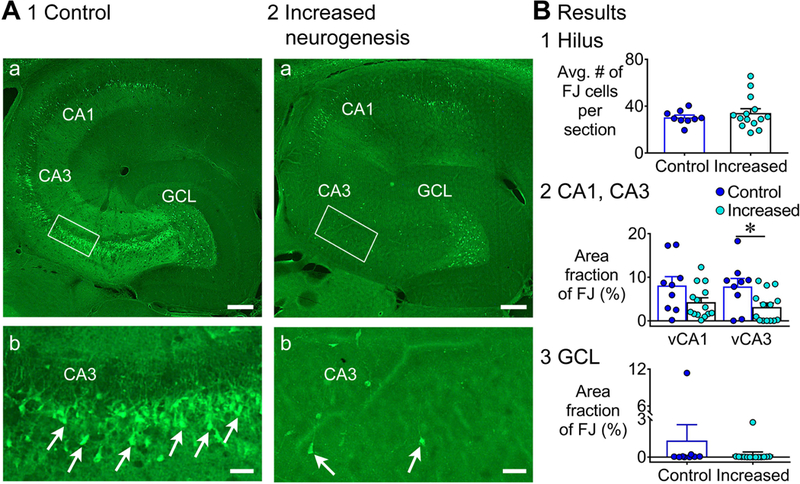
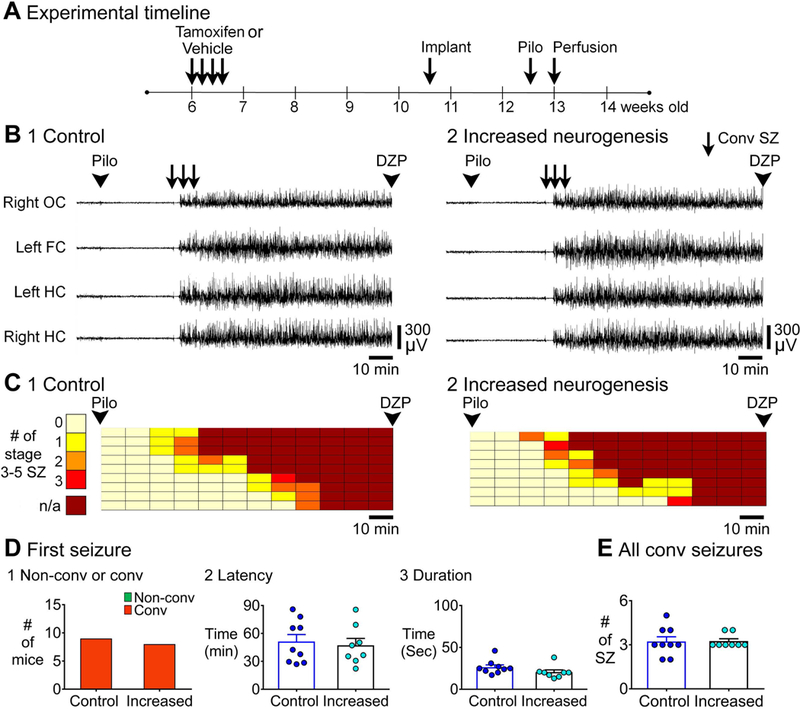
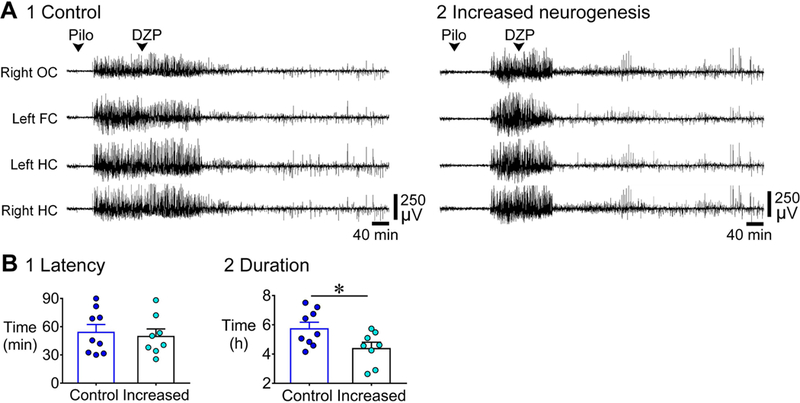
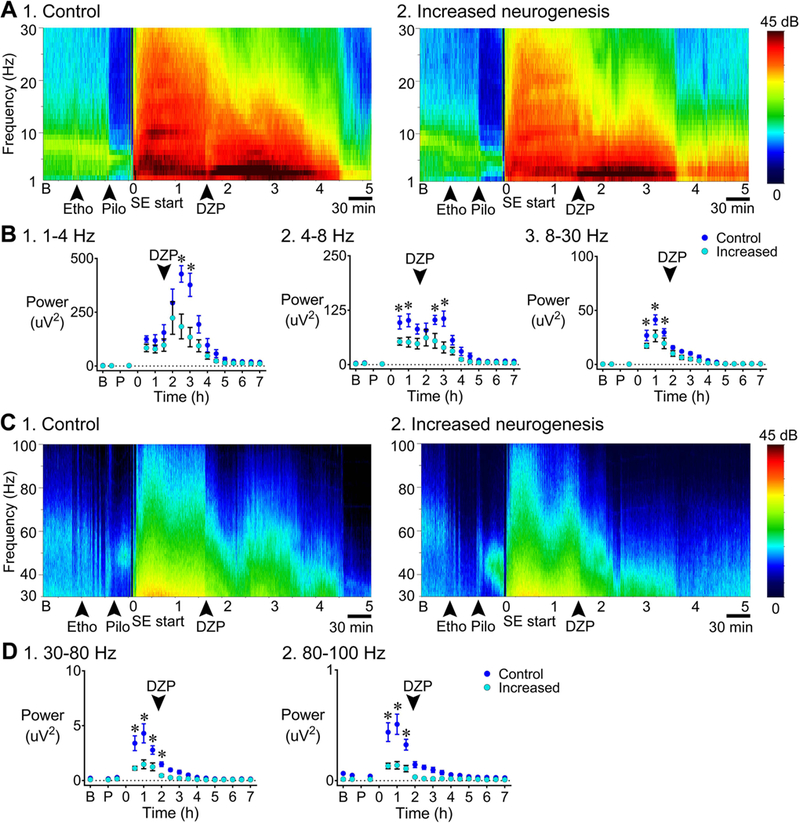
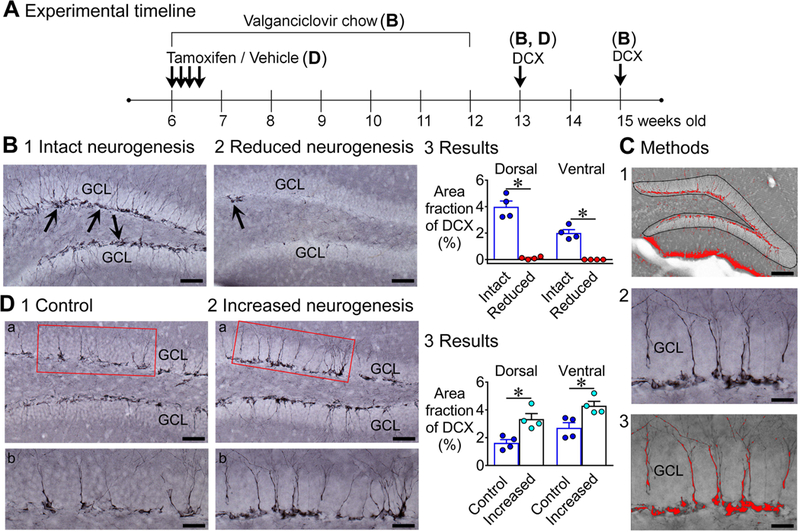
Previous studies suggest that reducing the numbers of adult-born neurons in the dentate gyrus (DG) of the mouse increases susceptibility to severe continuous seizures (status epilepticus; SE) evoked by systemic injection of the convulsant kainic acid (KA). However, it was not clear if the results would be the same for other ways to induce seizures, or if SE-induced damage would be affected. Therefore, we used pilocarpine, which induces seizures by a different mechanism than KA. Also, we quantified hippocampal damage after SE. In addition, we used both loss-of-function and gain-of-function methods in adult mice. We hypothesized that after loss-of-function, mice would be more susceptible to pilocarpine-induced SE and SE-associated hippocampal damage, and after gain-of-function, mice would be more protected from SE and hippocampal damage after SE. For loss-of-function, adult neurogenesis was suppressed by pharmacogenetic deletion of dividing radial glial precursors. For gain-of-function, adult neurogenesis was increased by conditional deletion of pro-apoptotic gene Bax in Nestin-expressing progenitors. Fluoro-Jade C (FJ-C) was used to quantify neuronal injury and video-electroencephalography (video-EEG) was used to quantify SE. Pilocarpine-induced SE was longer in mice with reduced adult neurogenesis, SE had more power and neuronal damage was greater. Conversely, mice with increased adult-born neurons had shorter SE, SE had less power, and there was less neuronal damage. The results suggest that adult-born neurons exert protective effects against SE and SE-induced neuronal injury.

Keywords: adult-born neurons; epilepsy; pilocarpine; progenitor; status epilepticus.


Figures

Figure 1.
Figure 1.. Greater Fluoro-Jade (FJ) staining in the dorsal hippocampus of mice with reduced adult neurogenesis.
A. The experimental timeline is shown. Chow containing valganciclovir (VGCV) was given for 6 weeks (Monday to Friday) and standard chow on weekends. One week later, mice were injected with pilocarpine (Pilo) to induce status epilepticus (SE). Three days after pilocarpine injection, mice were transcardially-perfused. GFAP-TK-: intact neurogenesis (n=8); GFAP-TK+: reduced neurogenesis (n=9). B. Representative examples of FJ staining in the dorsal hippocampus in mice with intact (1) and reduced (2) neurogenesis are shown. Calibration, 75 μm (a); 50 μm (b, c). 3. The tracing and thresholding of the region of interest (ROI) used to quantify FJ in the granule cell layer (GCL, a), CA1 (b), and CA3 (c) are shown. Calibration, 50 μm (a-c). C. 1. There were significantly more FJ-positive (FJ+) hilar cells in mice with reduced neurogenesis than intact neurogenesis (p = 0.010). 2. There was a main effect of reduced neurogenesis on FJ staining in dorsal CA1 and CA3 (p = 0.009). Dunn’s test showed significantly more damage in mice with reduced neurogenesis in area CA1 (p = 0.014), but not in CA3 (p = 0.535). 3. The differences in area fraction of the GCL with FJ staining were not significant (p = 0.064).
Figure 2.
Figure 2.. Greater FJ staining in the ventral hippocampus of mice with reduced adult neurogenesis.
A. Representative examples of FJ staining in the ventral hippocampus in mice with intact (1) and reduced (2) neurogenesis are shown. Calibration, 75 μm (a); 50 μm (b). GFAP-TK-: intact neurogenesis (n=8); GFAP-TK+: reduced neurogenesis (n=8). 3. The tracing and thresholding of the ROI used to quantify FJ in the GCL (a), CA1 (b), and CA3 (c) are shown. Calibration, 50 μm (a-c). B. 1. There were significantly more FJ+ hilar cells in mice with reduced neurogenesis than intact neurogenesis (p = 0.005). 2. There was no effect of reduced neurogenesis on FJ staining in ventral CA1 and CA3 (p = 0.343). 3. There was a significantly greater area fraction of FJ staining in the GCL of mice with reduced neurogenesis relative to intact neurogenesis (p = 0.025).
Figure 3.
Figure 3.. EEG recording of SE in mice with intact and reduced adult neurogenesis.
A. The experimental timeline for EEG recording of SE is shown. One week after cessation of chow, mice were implanted with electrodes. Two weeks later, mice were injected with pilocarpine to induce SE. Video-EEG was recorded for 24 h (see Methods). GFAP-TK-: intact neurogenesis (n=13); GFAP-TK+: reduced neurogenesis (n=13). B. Representative examples of 2 h-long EEG for the time between pilocarpine and diazepam injections for mice with intact (1) and reduced (2) neurogenesis are shown. C. The 2 h between pilocarpine and diazepam injection was divided into 10 min-long bins. The number of discrete convulsive seizures per bin is plotted with colors indicating lesser (light colors) and greater (darker red) numbers of seizures until SE (continuous seizures, darkest red). Each row is for a different mouse and arranged in order to the latency of first convulsive seizure. Convulsive seizures were seizures between stages 3–5 (see Methods). D. 1. The first seizure before SE was more often convulsive (rather than non-convulsive) in mice with reduced neurogenesis (9/13) compared to intact neurogenesis (2/13, p = 0.015). 2. The latency to the onset of first seizure was similar in both genotypes (p = 0.217). 3. The duration of the first seizure was longer in mice with reduced neurogenesis relative to intact neurogenesis (p = 0.004). E. There were differences in the total numbers of non-convulsive vs. convulsive seizures in all animals (p < 0.001) but there was no effect of genotype (Dunn’s test, p > 0.05). In this figure and all others, OC = Occipital Cortex, FC = Frontal Cortex, HC = Hippocampus, DZP = Diazepam, SZ = Seizure.
Figure 4.
Figure 4.. Longer duration of SE in mice with reduced adult neurogenesis compared to intact adult neurogenesis.
A. Representative examples of 10 h-long EEG are shown, beginning with pilocarpine injection, for mice with intact (1) and reduced (2) neurogenesis. GFAP-TK-: intact neurogenesis (n=13); GFAP-TK+: reduced neurogenesis (n=13). B. The EEG recording of the right hippocampus at 5 h from the onset of SE is expanded in mice with intact (1) and reduced (2) neurogenesis. The EEG of the mouse with intact neurogenesis shows much less activity than the mouse with reduced neurogenesis. C. 1. The latency to the onset of SE was similar in the two genotypes (p = 0.243). 2. The duration of SE (defined in Supporting Information Fig. S2 and Methods) was longer (by ~1 h) in mice with reduced neurogenesis compared to intact neurogenesis (p = 0.015).
Figure 5.
Figure 5.. More power during SE in mice with reduced adult neurogenesis relative to intact adult neurogenesis.
A. Representative examples of a 7 h-long spectrogram are shown for mice with intact (1) and reduced (2) neurogenesis, for the frequency ranges 1–30 Hz. Left: Colors are used to indicate the magnitude of power, ranging from 0 (dark blue) to 45 decibels (dB; dark red). GFAP-TK-: intact neurogenesis (n=7); GFAP-TK+: reduced neurogenesis (n=7). B. Power was calculated for 30 min-long epochs: a) the baseline period, b) time between pretreatment with ethosuximide and pilocarpine injection, c) the time between pilocarpine injection and SE onset, and then d) every 30 min after the onset of SE. 1. 1–4 Hz: Power in the delta band was greater in mice with reduced neurogenesis (p = 0.021) 1.5 h after the onset of SE (Bonferroni’s test, p = 0.004) and 3 h after the onset of SE (p = 0.033) compared to mice with intact neurogenesis. 2. 4–8 Hz: There was significantly greater power at theta frequency in mice with reduced neurogenesis (p = 0.012; Bonferroni’s test, 30 min to 1 h, p < 0.001; 1.5 h, p = 0.001) compared to mice with intact neurogenesis. 3. 8–30 Hz: There was a trend towards greater power during SE in mice with reduced neurogenesis, but the differences were not significant (p = 0.056). C. Representative examples of a 7 h-long spectrogram are shown for mice with intact (1) and reduced (2) neurogenesis, for the frequency ranges 30–100 Hz. D. There was no significant effect of genotype for low gamma or high gamma (low gamma: p = 0.187, high gamma: p = 0.844).
Figure 6.
Figure 6.. Less FJ staining in the dorsal hippocampus of mice with increased adult neurogenesis.
A. The experimental timeline is shown for NestinCreERT2Baxf/f mice. Tamoxifen or vehicle was injected for 4 consecutive days. Six weeks after last tamoxifen injection, mice were injected with pilocarpine to induce SE. Three days after pilocarpine injection, mice were transcardially-perfused. Controls: tamoxifen-treated NestinCre-, n=7 and vehicle-treated NestinCre+, n=3; Increased neurogenesis: tamoxifen-treated NestinCre+, n=14. B. Representative examples of FJ staining in the dorsal hippocampus in 1) a control (tamoxifen-treated NestinCre-) mouse and 2) a mouse with increased neurogenesis (tamoxifen-treated NestinCre+) are shown. Calibration, 75 μm (a); 50 μm (b, c). C. 1. There were significantly fewer FJ+ hilar cells in mice with increased neurogenesis than controls (p = 0.032). 2. There was a main effect of increased neurogenesis on FJ staining in dorsal CA1 and CA3 (p = 0.010). Dunn’s test showed significantly less damage in mice with increased neurogenesis in area CA1 (p = 0.046), but not in CA3 (p = 0.224). 3. The area fraction of FJ+ cells in the GCL was not significantly different (p = 0.072).
Figure 7.
Figure 7.. Less FJ staining in the ventral hippocampus of mice with increased adult neurogenesis.
A. Representative examples of FJ staining in the ventral hippocampus are shown for 1) a control (tamoxifen-treated NestinCre-) mouse and 2) a mouse with increased neurogenesis (tamoxifen-treated NestinCre+). Calibration, 75 μm (a); 50 μm (b). Controls: tamoxifen-treated NestinCre-, (n=6) and vehicle-treated NestinCre+ (n=3); Increased neurogenesis: (tamoxifen-treated NestinCre+, n=14). B. 1. There was no effect of increased neurogenesis on the numbers of FJ+ hilar cells (p = 0.841). 2. There was a main effect of increased neurogenesis on FJ staining in ventral CA1 and CA3 (p = 0.040). Dunn’s test showed significantly less damage in mice with increased neurogenesis in area CA3 (p = 0.032), but not in CA1 (p = 0.353). 3. There was no effect of increased neurogenesis on the area fraction of FJ staining in the GCL (p = 0.183).
Figure 8.
Figure 8.. EEG recording of SE in controls and mice with increased adult neurogenesis.
A. The experimental timeline to administer tamoxifen or vehicle is shown. Approximately 3–4 weeks after last tamoxifen or vehicle injection, mice were implanted. Two-three weeks after surgery, mice were injected with pilocarpine to induce SE. Controls: tamoxifen-treated NestinCre- (n=6) and vehicle-treated NestinCre- (n=3); Increased neurogenesis: tamoxifen-treated NestinCre+ (n=8). B. Representative examples of 2 h-long EEG records after pilocarpine injection of 1) a control (tamoxifen-treated NestinCre-) mouse and 2) a mouse with increased neurogenesis (tamoxifen-treated NestinCre+) are shown. C. The 2 h between pilocarpine and diazepam injection was divided into 10 min-long bins and each row is for a different mouse and arranged in order to the latency of first convulsive seizure (as shown in Fig. 3). D. 1. The first SZ before SE was always convulsive so there were no genotypic differences. 2. The latencies to the onset of the first SZ were similar (p = 0.709). 3. Increased neurogenesis did not affect the duration of first seizure (p = 0.093). E. Increased neurogenesis did not influence the total number of convulsive SZs (p = 0.887).
Figure 9.
Figure 9.. Shorter duration of SE in mice with increased adult neurogenesis compared to control.
A. Representative examples of a 10 h-long EEG are shown, beginning with pilocarpine injection for 1) a control (tamoxifen-treated NestinCre-) mouse and 2) a mouse with increased neurogenesis (tamoxifen-treated NestinCre+). Controls: tamoxifen-treated NestinCre- (n=6) and vehicle-treated NestinCre- (n=3); Increased neurogenesis: tamoxifen-treated NestinCre+ (n=8). B. 1. The latency to the onset of SE was similar (p = 0.690). 2. The duration of SE was shorter (by ~1 h) in mice with increased neurogenesis compared to controls (p = 0.032).
Figure 10.
Figure 10.. Less power during SE in mice with increased adult neurogenesis compared to control.
A. Representative examples of a 7 h-long spectrogram of 1) a control (tamoxifen-treated NestinCre-) mouse and 2) a mouse with increased neurogenesis (tamoxifen-treated NestinCre+), for the frequency range 1–30 Hz are shown. Left: Colors are used to indicate the magnitude of power, ranging from 0 (dark blue) to 45 decibels (dB; dark red). Controls: tamoxifen-treated NestinCre- (n=5) and vehicle-treated NestinCre- (n=2); Increased neurogenesis: tamoxifen-treated NestinCre+ (n=8). B. Power was calculated for different time points as described in Fig. 5. 1. 1–4 Hz: Power in the delta band was decreased in mice with increased neurogenesis (p = 0.013) 2.5 h after the onset of SE (Bonferroni’s test, p < 0.001) and 3 h after the onset of SE (p < 0.001) relative to control. 2. 4–8 Hz: There was significantly less power at theta frequency in mice with increased neurogenesis (p = 0.010; Bonferroni’s test, 30 min, p = 0.012; 1 h, p = 0.002; 2.5 h, p = 0.003; 3 h, p < 0.001) than control. 3. 8–30 Hz: There was significantly less beta power in mice with increased neurogenesis (p = 0.025; Bonferroni’s test, 30 min, p = 0.017; 1 h, p < 0.001; 1.5 h, p = 0.007) than controls. C. Representative examples of a 7 h-long spectrogram of 1) a control and 2) a mouse with increased neurogenesis, for the frequency range 30–100 Hz are shown. D. There was a main effect of increased neurogenesis on 1) low gamma power (p = 0.001; Bonferroni’s test, 30 min to 1.5 h, p < 0.001; 2 h, p = 0.029) and 2) high gamma power (p < 0.001; Bonferroni’s test, 30 min to 1.5 h, p < 0.001).
Figure 11.
Figure 11.. Confirmation of suppression and enhancement of adult neurogenesis.
A. The experimental timeline for suppression and enhancement of neurogenesis. Details are in the text. B. Doublecortin (DCX) immunoreactivity is shown in mice with intact (1) and reduced (2) neurogenesis. Calibration, 30 μm (1, 2). 3. DCX immunoreactivity in mice with reduced neurogenesis was significantly decreased relative to mice with intact neurogenesis in both dorsal and ventral hippocampus (p < 0.001; Dunn’s test, p = 0.021 for dorsal; p = 0. 047 for ventral; n = 4/group). C. 1. The ROI used to quantify DCX immunoreactivity is shown. 2, 3. DCX immunoreactivity before (2) and after thresholding (3). The area above threshold is red. Calibration, 50 μm (1); 15 μm (2, 3). D. 1, 2. DCX immunoreactivity in control (1a-b) and mice with increased (2a-b) neurogenesis, shows a significantly greater area fraction for DCX immunoreactivity in mice with increased neurogenesis. Calibration, 30 μm (a); 15 μm (b). 3. Mice with increased neurogenesis had a significantly greater area fraction of DCX immunoreactivity compared to control mice and this occurred in both the dorsal and ventral hippocampus (p < 0.001; Bonferroni’s test, p = 0.007 for dorsal; p = 0.012 for ventral; n = 4/group).

Similar articles

Cited by

References

    1. Adlaf EW, Vaden RJ, Niver AJ, Manuel AF, Onyilo VC, Araujo MT, . . . Overstreet-Wadiche L (2017). Adult-born neurons modify excitatory synaptic transmission to existing neurons. Elife, 6, e19886. - PMC - PubMed
    1. Aimone JB, Li Y, Lee SW, Clemenson GD, Deng W, Gage FH (2014). Regulation and function of adult neurogenesis: from genes to cognition. Physiol Rev, 94(4), 991–1026. - PMC - PubMed
    1. Altman J, Das GD (1965). Autoradiographic and histological evidence of postnatal hippocampal neurogenesis in rats. J Comp Neurol, 124(3), 319–335. - PubMed
    1. Altman J (2011). The discovery of adult mammalian neurogenesis In Seki T, Sawamoto K, Parent JM, Alvarez-Buylla A (Eds.), Neurogenesis in the Adult Brain I: Neurobiology (Vol. I, pp. 3–46): Springer.
    1. Amaral DG (1978). A Golgi study of cell types in the hilar region of the hippocampus in the rat. J Comp Neurol, 182, 851–914. - PubMed

Publication types