

Urine Nuclear Magnetic Resonance (NMR) Metabolomics in Age-Related Macular Degeneration
- PMID: 30672297
- PMCID: PMC7838731
- DOI: 10.1021/acs.jproteome.8b00877
Urine Nuclear Magnetic Resonance (NMR) Metabolomics in Age-Related Macular Degeneration
Abstract
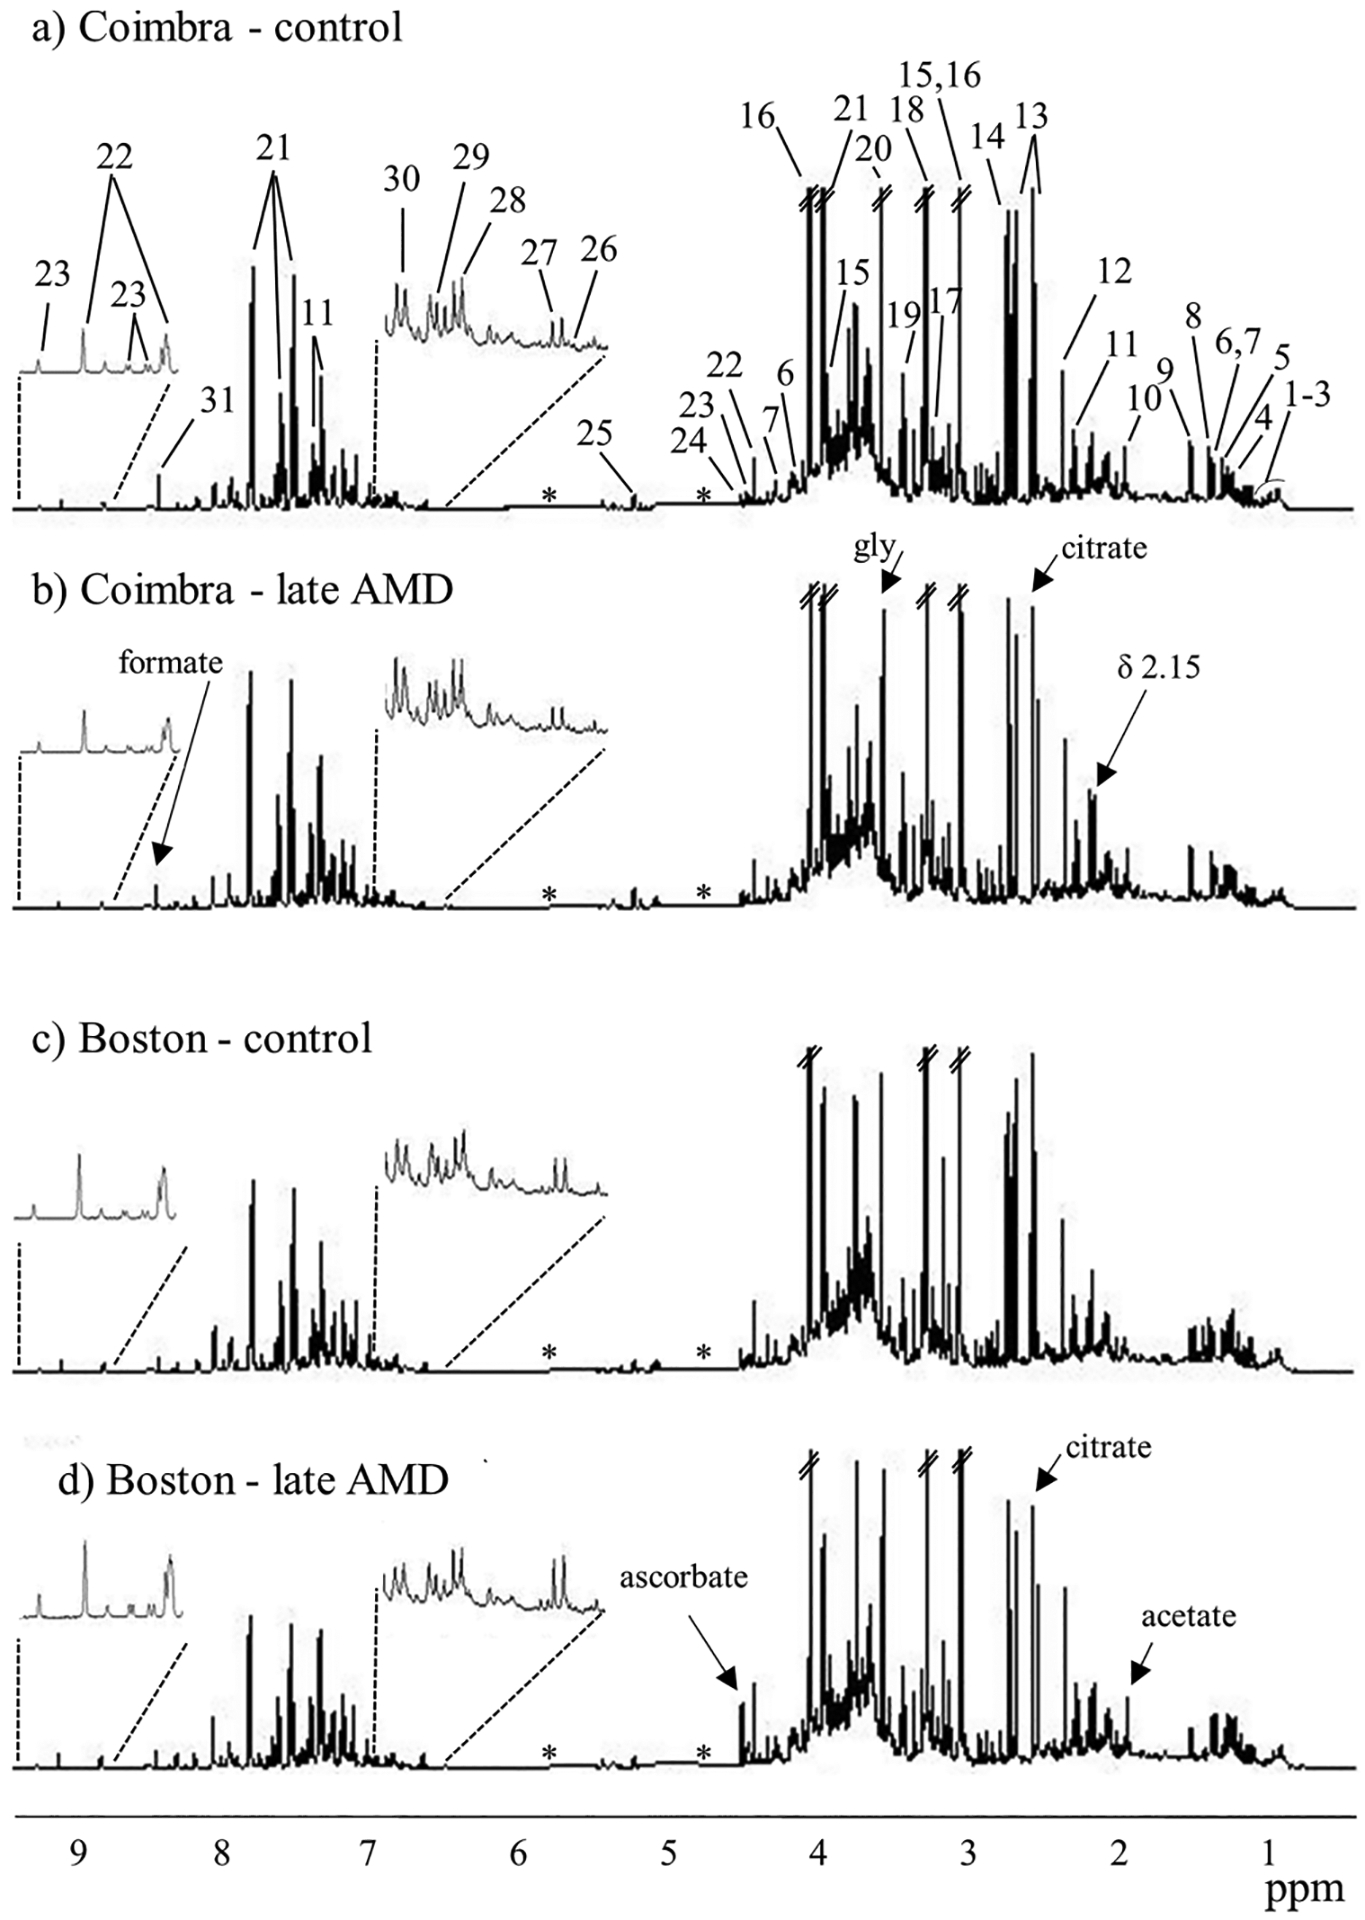
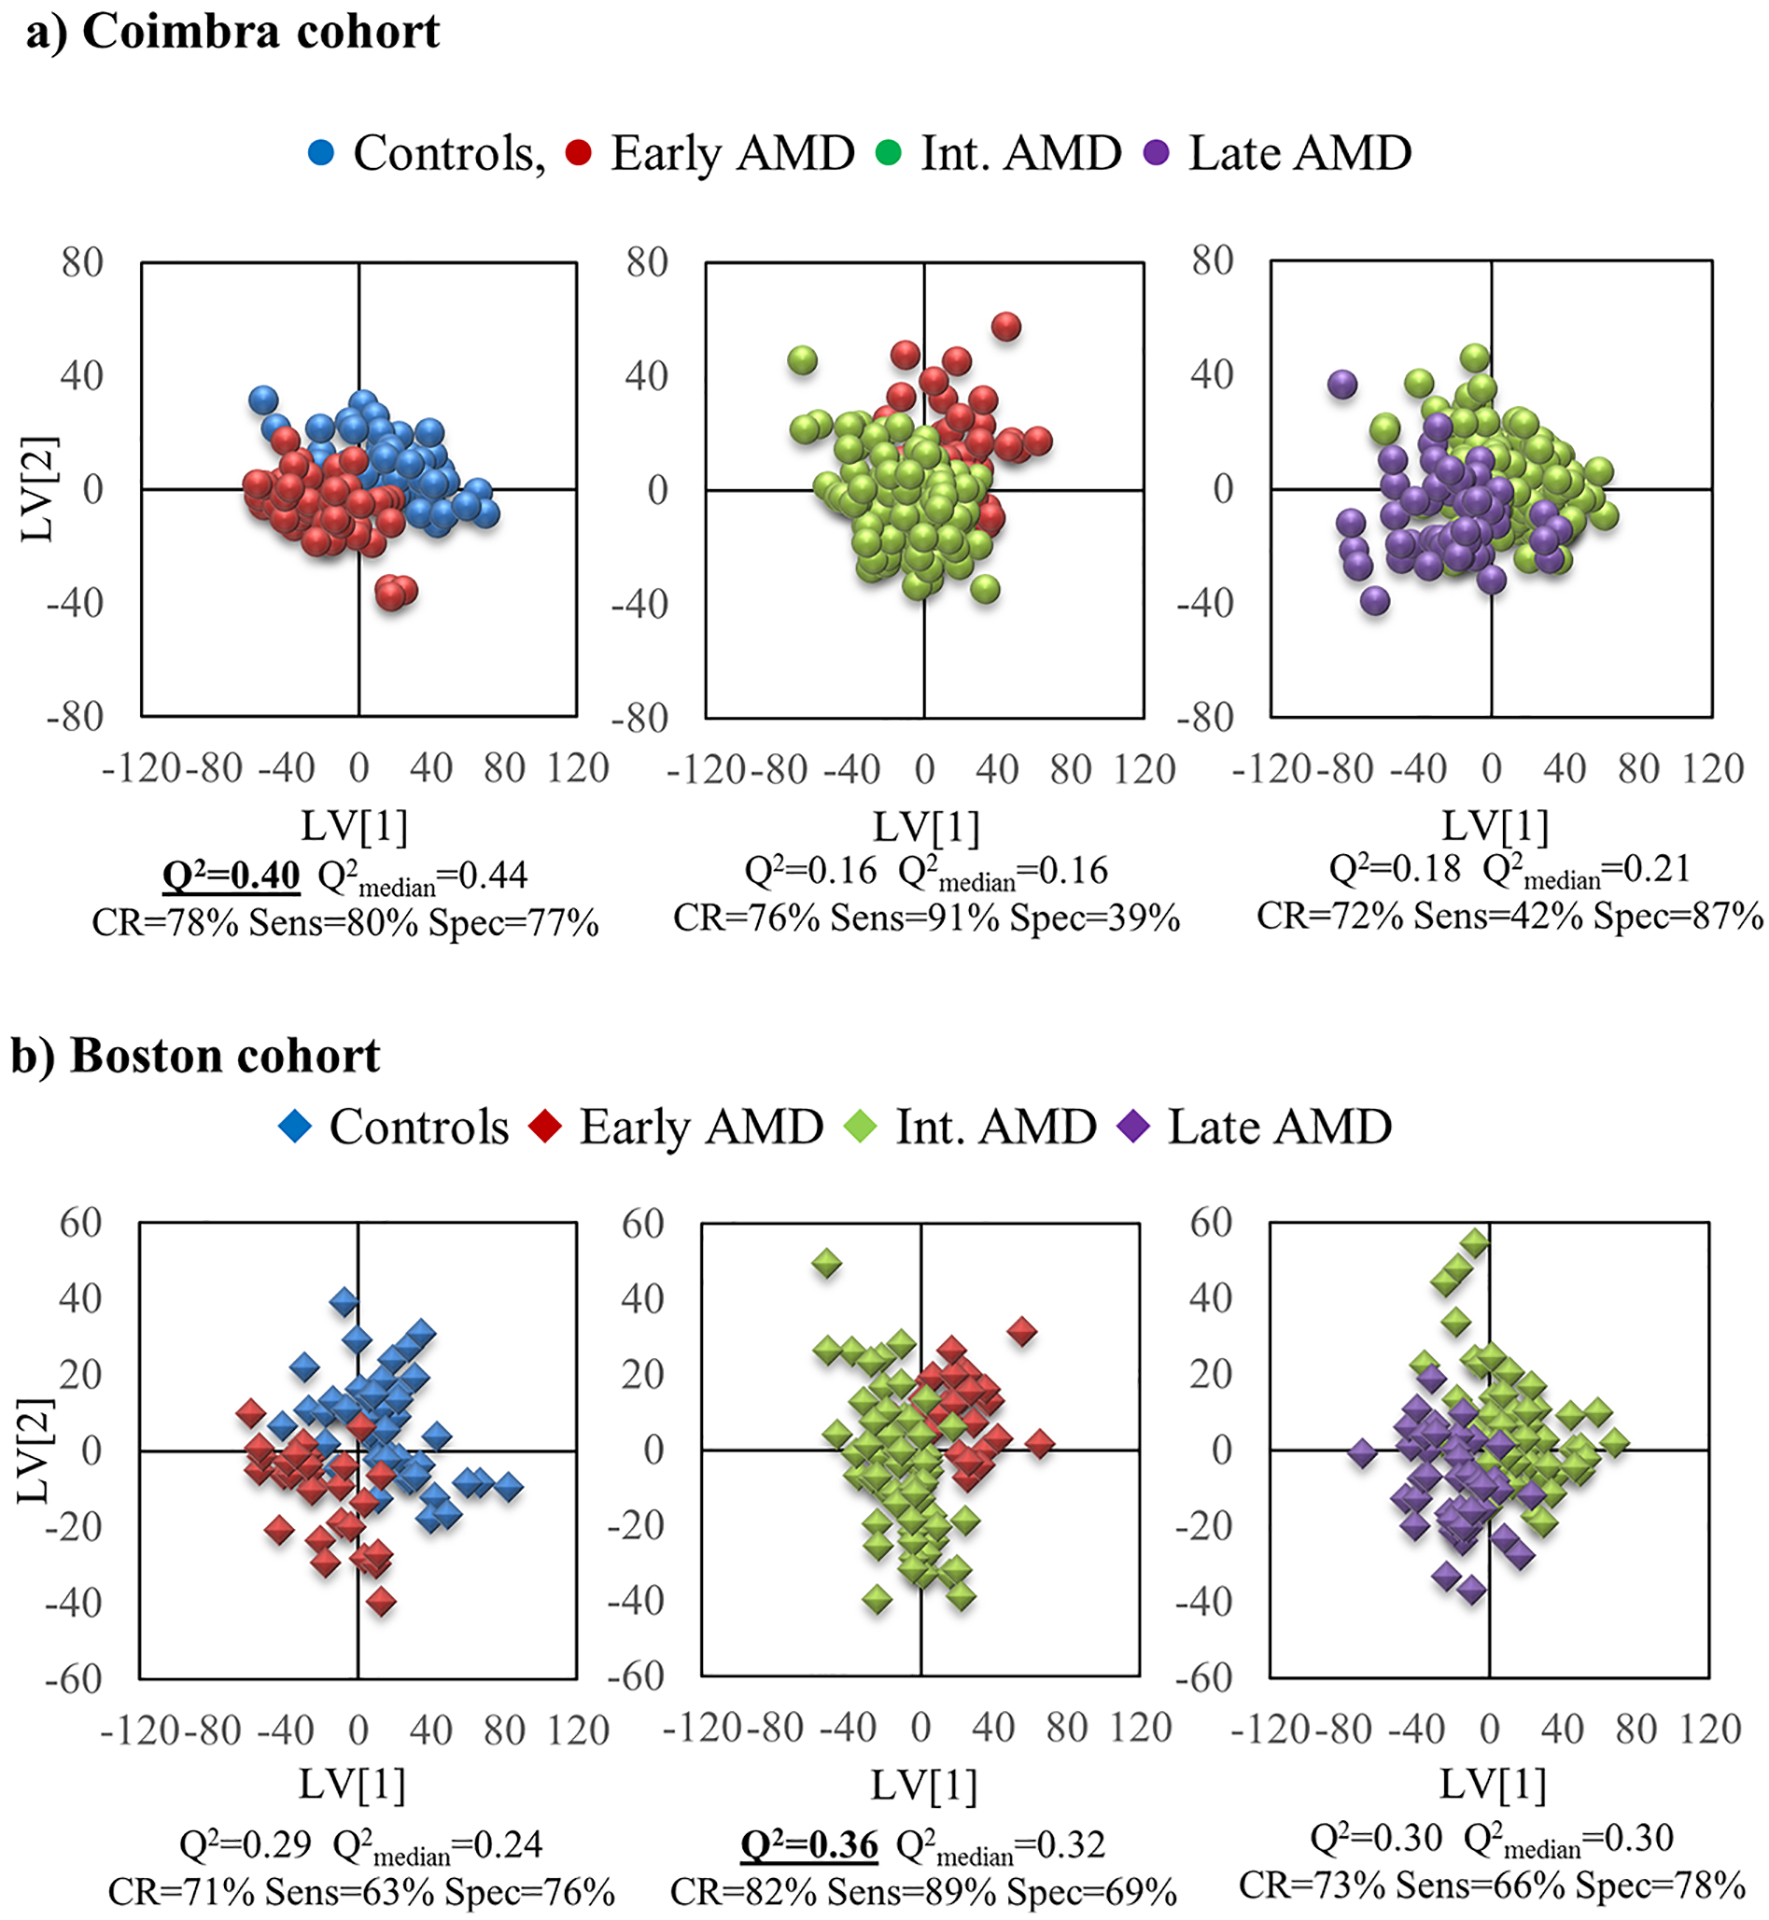
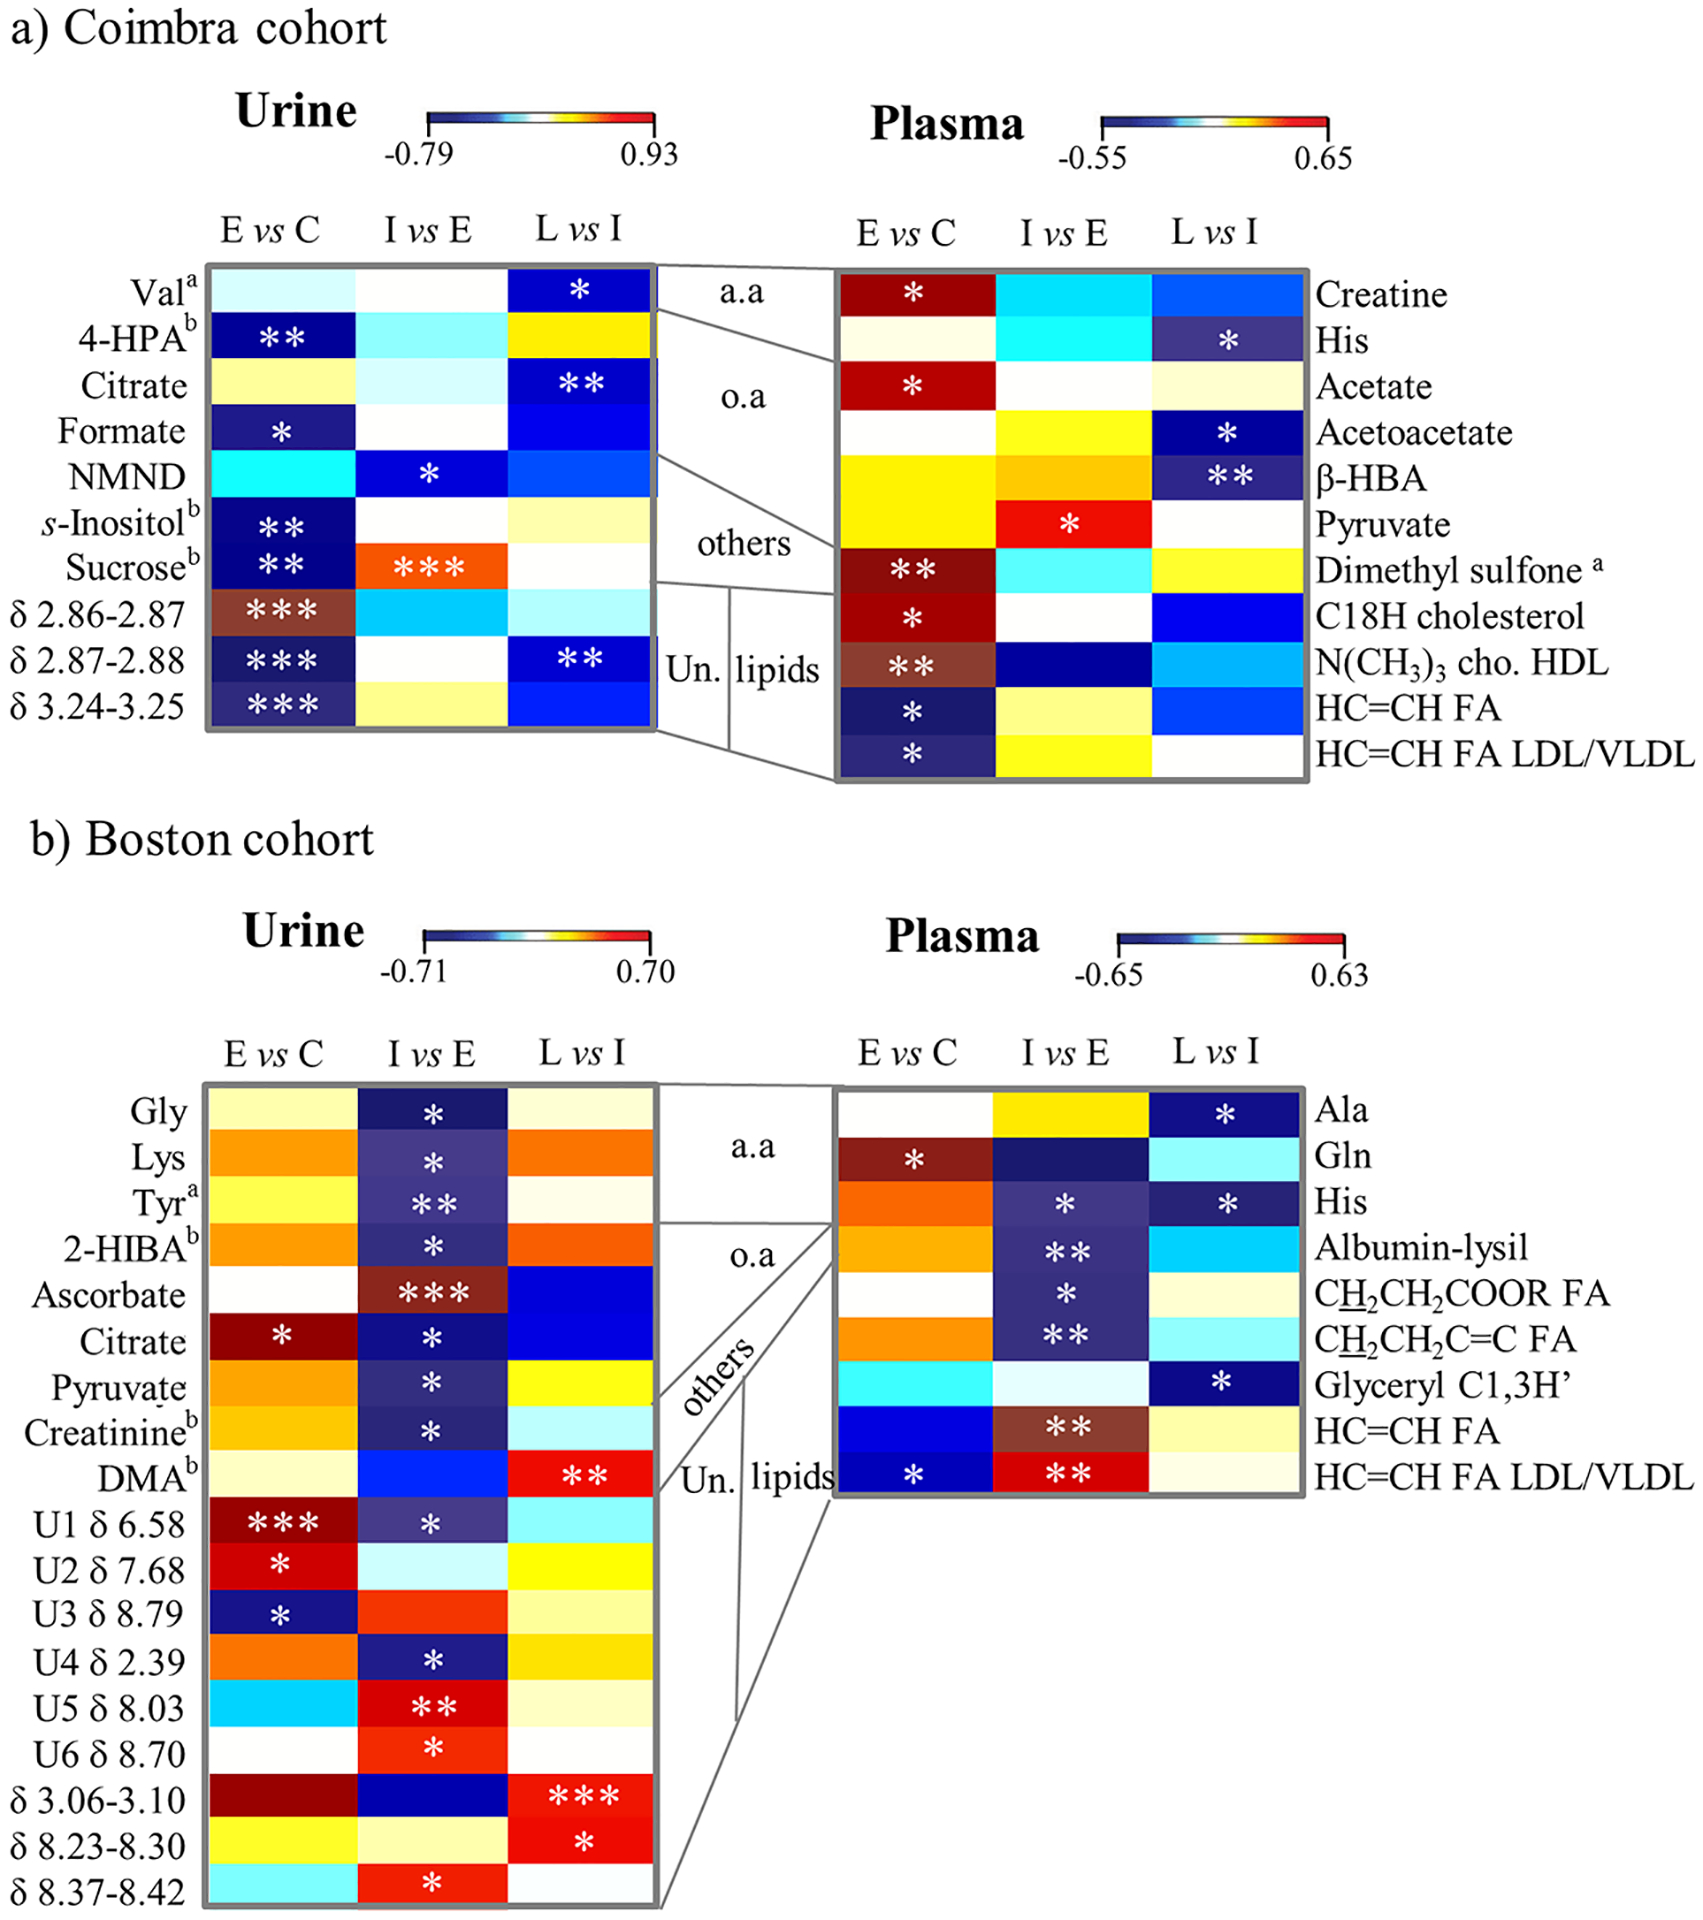
Biofluid biomarkers of age-related macular degeneration (AMD) are still lacking, and their identification is challenging. Metabolomics is well-suited to address this need, and urine is a valuable accessible biofluid. This study aimed to characterize the urinary metabolomic signatures of patients with different stages of AMD and a control group (>50 years). It was a prospective, cross-sectional study, where subjects from two cohorts were included: 305 from Coimbra, Portugal (AMD patients n = 252; controls n = 53) and 194 from Boston, United States (AMD patients n = 147; controls n = 47). For all participants, we obtained color fundus photographs (for AMD staging) and fasting urine samples, which were analyzed using 1H nuclear magnetic resonance (NMR) spectroscopy. Our results revealed that in both cohorts, urinary metabolomic profiles differed mostly between controls and late AMD patients, but important differences were also found between controls and subjects with early AMD. Analysis of the metabolites responsible for these separations revealed that, even though distinct features were observed for each cohort, AMD was in general associated with depletion of excreted citrate and selected amino acids at some stage of the disease, suggesting enhanced energy requirements. In conclusion, NMR metabolomics enabled the identification of urinary signals of AMD and its severity stages, which might represent potential metabolomic biomarkers of the disease.
Keywords: age-related macular degeneration; metabolomics; nuclear magnetic resonance spectroscopy; urine.
Conflict of interest statement
The authors declare no competing financial interest.
Figures
Similar articles
-
Urinary Mass Spectrometry Profiles in Age-Related Macular Degeneration.J Clin Med. 2022 Feb 11;11(4):940. doi: 10.3390/jcm11040940. J Clin Med. 2022. PMID: 35207212 Free PMC article.
-
Human plasma metabolomics in age-related macular degeneration (AMD) using nuclear magnetic resonance spectroscopy.PLoS One. 2017 May 18;12(5):e0177749. doi: 10.1371/journal.pone.0177749. eCollection 2017. PLoS One. 2017. PMID: 28542375 Free PMC article.
-
Human Plasma Metabolomics Study across All Stages of Age-Related Macular Degeneration Identifies Potential Lipid Biomarkers.Ophthalmology. 2018 Feb;125(2):245-254. doi: 10.1016/j.ophtha.2017.08.008. Epub 2017 Sep 12. Ophthalmology. 2018. PMID: 28916333 Free PMC article.
-
Analysis of biofluid metabolomic profiles to the discovery of biomarkers in age-related macular degeneration.BMJ Open Ophthalmol. 2024 Dec 24;9(1):e001573. doi: 10.1136/bmjophth-2023-001573. BMJ Open Ophthalmol. 2024. PMID: 39719382 Free PMC article.
-
Metabolomics in Age-Related Macular Degeneration: A Systematic Review.Invest Ophthalmol Vis Sci. 2020 Dec 1;61(14):13. doi: 10.1167/iovs.61.14.13. Invest Ophthalmol Vis Sci. 2020. PMID: 33315052 Free PMC article.
Cited by
-
Metabolomics in Retinal Diseases: An Update.Biology (Basel). 2021 Sep 22;10(10):944. doi: 10.3390/biology10100944. Biology (Basel). 2021. PMID: 34681043 Free PMC article. Review.
-
Systematic Review of NMR-Based Metabolomics Practices in Human Disease Research.Metabolites. 2022 Oct 12;12(10):963. doi: 10.3390/metabo12100963. Metabolites. 2022. PMID: 36295865 Free PMC article. Review.
-
Urinary Mass Spectrometry Profiles in Age-Related Macular Degeneration.J Clin Med. 2022 Feb 11;11(4):940. doi: 10.3390/jcm11040940. J Clin Med. 2022. PMID: 35207212 Free PMC article.
-
Systemic Metabolomics in a Framework of Genetics and Lifestyle in Age-Related Macular Degeneration.Metabolites. 2023 May 27;13(6):701. doi: 10.3390/metabo13060701. Metabolites. 2023. PMID: 37367859 Free PMC article.
-
Carbon Nanotubes Induce Metabolomic Profile Disturbances in Zebrafish: NMR-Based Metabolomics Platform.Front Mol Biosci. 2021 Jul 2;8:688827. doi: 10.3389/fmolb.2021.688827. eCollection 2021. Front Mol Biosci. 2021. PMID: 34277704 Free PMC article.
References
-
- Wong WL; Su X; Li X; Cheung CM; Klein R; Cheng CY; Wong TY; et al. Global prevalence of age-related macular degeneration and disease burden projection for 2020 and 2040: a systematic review and meta-analysis. Lancet Global Health 2014, 2 (2), e106–e116. - PubMed
Publication types
MeSH terms
Substances
Grants and funding
LinkOut - more resources
Full Text Sources
Medical
