. 2019 Mar 15;30(6):753-765.
doi: 10.1091/mbc.E18-08-0541. Epub 2019 Jan 23.

A unified model for microtubule rescue

Affiliations

A unified model for microtubule rescue

Colby P Fees et al. Mol Biol Cell. .

Abstract

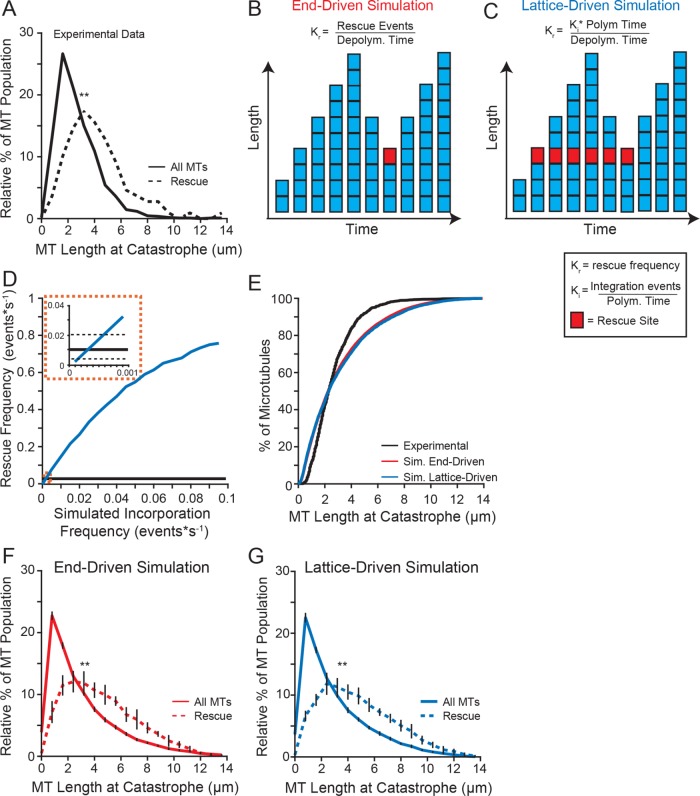
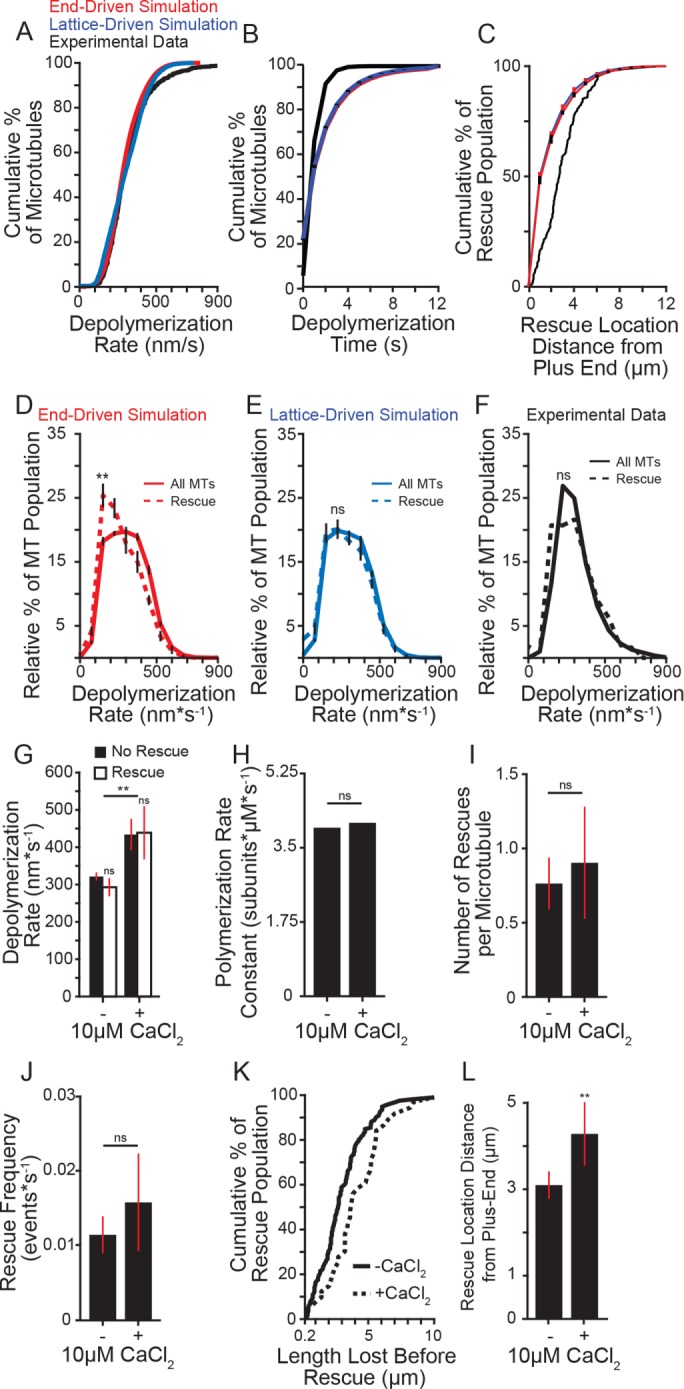
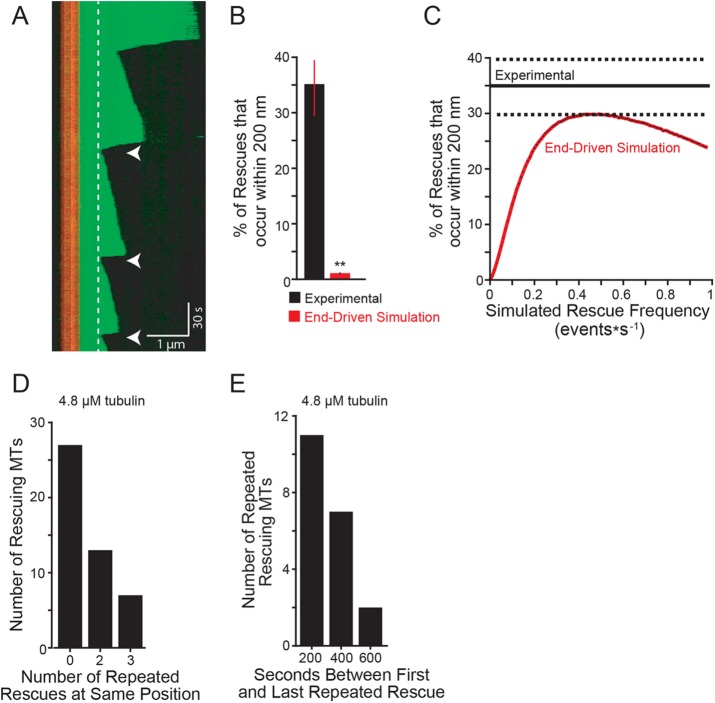
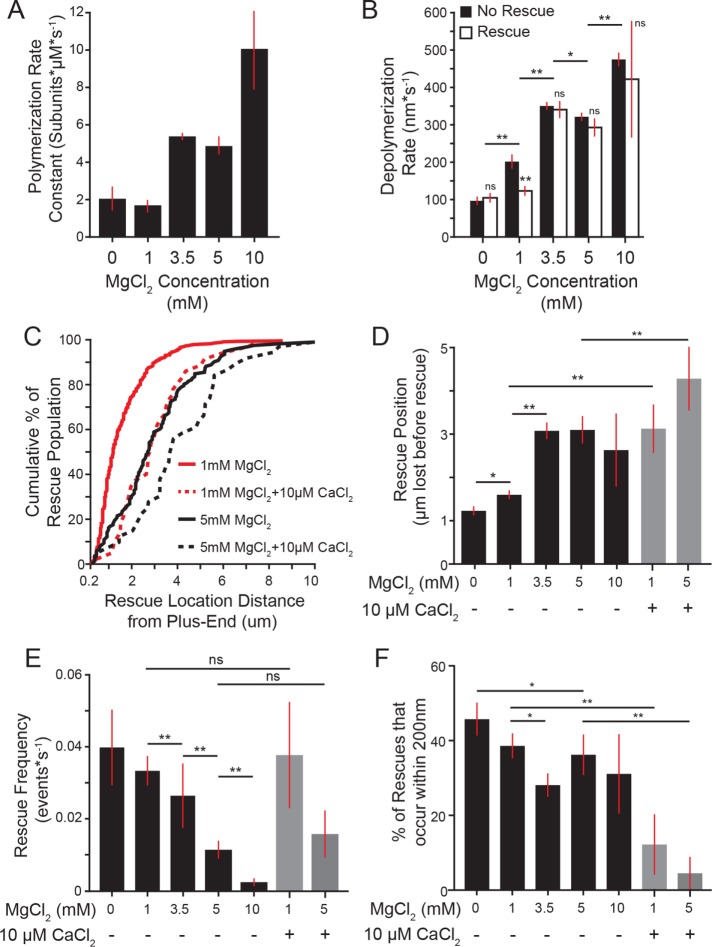
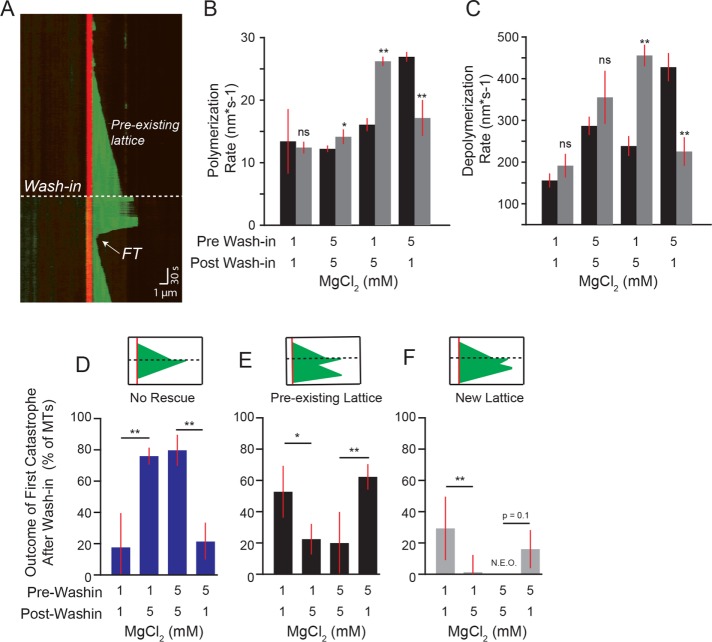
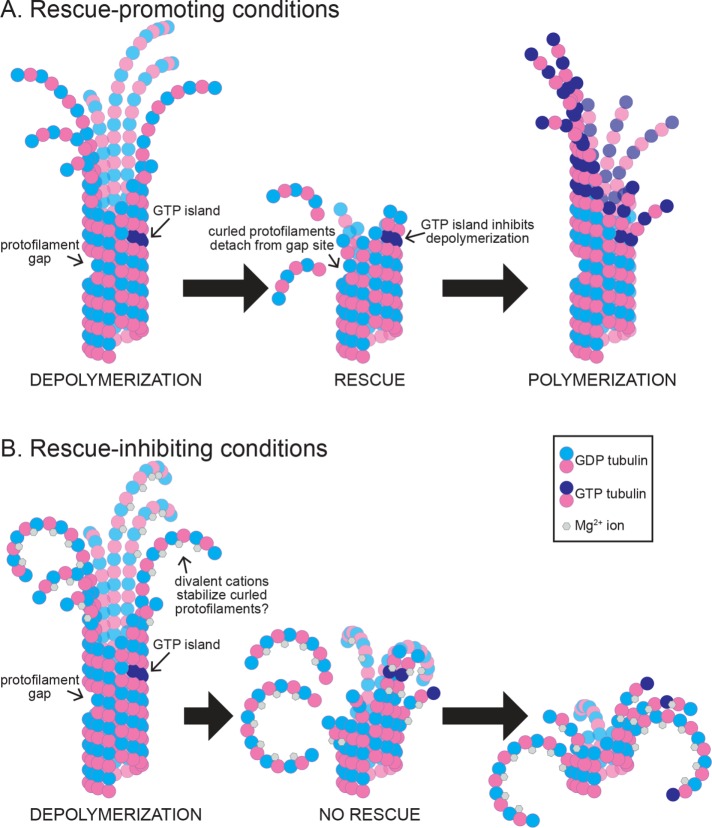
How microtubules transition from depolymerization to polymerization, known as rescue, is poorly understood. Here we examine two models for rescue: 1) an "end-driven" model in which the depolymerizing end stochastically switches to a stable state; and 2) a "lattice-driven" model in which rescue sites are integrated into the microtubule before depolymerization. We test these models using a combination of computational simulations and in vitro experiments with purified tubulin. Our findings support the "lattice-driven" model by identifying repeated rescue sites in microtubules. In addition, we discover an important role for divalent cations in determining the frequency and location of rescue sites. We use "wash-in" experiments to show that divalent cations inhibit rescue during depolymerization, but not during polymerization. We propose a unified model in which rescues are driven by embedded rescue sites in microtubules, but the activity of these sites is influenced by changes in the depolymerizing ends.


Figures

FIGURE 1:
FIGURE 1:
Microtubule rescue frequency is independent of tubulin concentration. (A) Purified tubulin sample separated by SDS–PAGE gel stained with Coomassie. Lane 1: protein ladder. Lanes 2–4: 10-fold serial dilutions of tubulin purified from porcine brain. Protein loads are ∼22.5–0.225 mg. (B) Representative kymograph of purified tubulin (green) polymerized from GMPCPP stabilized microtubule seeds (red), rescue event denoted (arrowhead). Images were collected at 1-s intervals. Tubulin concentration: 7.2 µM, vertical scale bar = 0.5 min and horizontal scale bar = 1 µm. (C) Polymerization rate plotted as a function of tubulin concentration. Protein purified from pig brain (black) compared with purchased protein purified commercially (red). Data points are mean ± 95% CI. (D) Depolymerization rate plotted as a function of tubulin concentration. (E) Catastrophe frequency plotted as a function of tubulin concentration. Catastrophe frequency defined as the number of events per sum of polymerization time for each concentration. Error bars represent SE of proportion (SEP). (F) Rescue frequency plotted as a function of tubulin concentration. Rescue frequency calculated as the number of rescues divided by total depolymerization time for each concentration. Error bars represent SEP. For C–F, at least 73 microtubules were analyzed for each tubulin sample, at each concentration.
FIGURE 2:
FIGURE 2:
Longer microtubules are more likely to rescue. (A) Relative distribution of microtubule lengths at catastrophe leading to rescue (dashed line) compared with the entire population (solid line) of the experimental data under standard conditions (5 mM MgCl2). Data represent 1127 microtubule lengths from 525 stabilized seeds, pooled from five separate experiments at the following tubulin concentrations: 4.8, 5.4, 5.8, 7.0, 7.2 µM. (B) Schematic of our end-driven simulation. Rescue site is denoted by a red square. Rescue frequency is defined as the number rescue events per depolymerization time. Rescues were triggered stochastically during depolymerization at the experimentally derived rescue frequency (0.01 events*depolymerization s−1). (C) Schematic of our lattice-driven simulation. Rescue sites (denoted by a red square) are incorporated during polymerization, and always trigger rescue when the depolymerizing end returns to that site. (D) Simulated rescue frequency as a function of incorporation frequency. The simulated rescue frequency for each incorporation rate calculated from 1000 simulated microtubules. (E) Cumulative distribution of microtubule lengths at catastrophe under standard conditions (black) compared with end-driven simulation (red) and the lattice-driven simulation (blue). (F) Similar to A, using data from the end-driven simulation. Error bars represent SD from 10 separate simulations of 20,000 microtubule seeds. (G) Similar to A, using data from the lattice-driven simulation, with the incorporation frequency set to 0.0001 events*s−1. Error bars represent SD from 10 separate simulations of 20,000 microtubule seeds. Significance determined by Kolmogorov-Smirnov test (F and G) or Mann-Whitney U test (A). **: p < 0.001.
FIGURE 3:
FIGURE 3:
Effect of depolymerization rate on rescue. (A) Cumulative distribution of depolymerization rates of experimental data under standard conditions (5 mM MgCl2; black) compared with the end-driven simulation (red) and the lattice-driven simulation (blue). (B) Cumulative distribution of microtubule depolymerization times (s) of experimental data under standard conditions (5 mM MgCl2; black) compared with simulated microtubules from the end-driven and lattice-driven models (red and blue, respectively). Error bars represent SD from 10 separate simulations of 20,000 microtubule seeds. (C) Cumulative distribution of rescue location relative to the micro­tubule plus end of experimental data under standard conditions compared with the simulated models as in A and B. Error bars represent SD from 10 separate simulations of 20,000 microtubule seeds. (D) Relative distribution of depolymerization rates leading to rescue (dashed line) compared with entire population (solid line) of the end-driven simulation. Plot represents 10 separate simulations of 20,000 simulated microtubules per simulation. Error bars represent SD. (E) Relative distribution of depolymerization rates leading to rescue (dashed line) compared with entire population (solid line) of the lattice-driven model. Error bars represent SD. (F) Relative distribution of depolymerization rates leading to rescue (dashed line) compared with entire population (solid line) from experimental data under 5 mM MgCl2 conditions. Rescue data represent 165 depolymerization events from 112 microtubules; solid line represents entire population data consisting of 1283 depolymerization events from 1164 microtubules from five separate experiments at the following tubulin concentrations: 4.8, 5.4, 5.8, 7.0, 7.2 µM. (G) Average depolymerization rates from experimental data of microtubules at 5 mM MgCl2, with or without 10 µM CaCl2, showing catastrophes terminating at the seed (No Rescue) compared with those terminating at a rescue site within the lattice (Rescue). Significance determined by comparing rescue to no rescue for each condition as well as rescue across conditions. Bars represent mean ± 95% CI, at least 230 depolymerization events from at least three experiments from at the following tubulin concentrations: -CaCl2: 4.8, 5.4, 5.8, 7.0, 7.2 µM; + CaCl2: 5.3, 6.4, 6.9 µM. (H) Average polymerization rate constants from experimental observations of at least 275 microtubules for each condition at tubulin concentrations listed for G. (I) Average number of rescues per microtubule with and without 10 µM CaCl2. Bars represent mean ± 95% CI from at least 275 microtubules over at least three separate experiments for each condition at tubulin concentrations listed for G. (J) Average rescue frequency calculated as events per depolymerization time. Bars represent mean ± 95% CI from at least 275 microtubules over at least three experiments per condition at tubulin concentrations listed for G. (K) Cumulative distribution of the length lost before rescue with and without CaCl2 at tubulin concentrations listed for G. (L) Mean ± 95% CI of the rescue position relative to the catastrophe site. Position defined as the difference of microtubule length at catastrophe and length at rescue. Bars represent at least 39 length measurements from 25 microtubules from at least three separate experiments at tubulin concentrations listed for G. **: p ≪ 0.001; ns: not significant. Significance determined by Mann-Whitney U test (F–L) or Kolmogorov-Smirnov test (B–E).
FIGURE 4:
FIGURE 4:
Rescues occur repeatedly at similar sites along the microtubule. (A) Representative kymograph showing repeated rescue events (within 200 nm of previous rescue denoted with arrowheads. Dashed lines highlight the location of two separate rescue sites through time. Images were collected at 1-s intervals. Tubulin concentration: 5.6 µM using porcine brain tubulin purchased from Cytoskeleton; vertical scale bar: 30 s; horizontal scale bar: 1 µm. (B) Percent of rescues that occur within 200 nm of previous rescue site. Experimental data pooled from 105 total rescue events from five separate experiments at the following tubulin concentrations: 4.8, 5.4, 5.8, 7.0, 7.2 µM. Error bars are SEP. **: p ≪ 0.001; determined by Fishers exact test. (C) Percent of repeated rescues calculated with increasing rescue frequencies using the end-driven simulation (solid red line). Experimental data represented as mean (solid black line) ± SEP (dashed black lines). Sets of simulations were performed using 1000 microtubules per rescue frequency tested. Rescue frequencies were increased by 0.005 intervals between 0.01 and 0.99 events*s−1. Plot represents the average percentage of microtubules with repeated rescue events from 10 separate simulation replicates of 20,000 microtubule seeds. Error bars in black represent SD; however, they are smaller than the mean line thickness. (D) Number of rescuing microtubules that exhibit zero, two, or three repeated rescues at the same lattice position. Experimental data are from microtubules assembled from 4.8 µM tubulin. (E) Observed time that repeated rescue sites persist during the image acquisition. Persistence time calculated by subtracting the time of the last observed rescue from the first rescue. Experimental data are from microtubules assembled from 4.8 µM tubulin.
FIGURE 5:
FIGURE 5:
Divalent cations suppress rescues. (A) Polymerization rate constants for each concentration of magnesium tested. Plot represents mean ± 95% CI from pooled data of at least 32 polymerization events from at least 20 microtubules for increasing concentrations of tubulin from at least three separate experiments from the following tubulin concentrations: 0 mM MgCl2: 5.3, 7.4, 10.5 µM; 1 mM MgCl2: 4.4, 4.9, 5.0, 6.6, 7.1, 8.1, 8.8 µM; 3.5 mM MgCl2: 5.2, 5.9, 7.1, 7.7 µM; 5 mM MgCl2: 4.8, 5.4, 5.8, 7.0, 7.2 µM; 10 mM MgCl2: 4.6, 5.1, 5.9, 6.9 µM. (B) Average depolymerization rate for each concentration of magnesium. Plots represent mean ± 95% CI. Data pooled from multiple tubulin concentrations listed for A. (C) Cumulative distribution of microtubule length lost before rescue. Lines are 5 mM MgCl2 without (black) or with 10 µM CaCl2 (black-dashed), and red lines are 1 mM MgCl2 with and without 10 µM CaCl2 (red and red-dashed, respectively). Each line represents at least 39 lengths from at least 25 microtubules pooled from at least three separate experiments from the following tubulin concentrations: 5 mM MgCl2 − CaCl2: 4.8, 5.4, 5.8, 7.0, 7.2 µM tubulin; 5 mM MgCl2 + CaCl2: 5.3, 6.4, 6.9; 1 mM MgCl2 − CaCl2: 4.4, 4.9, 5.0, 6.6, 7.1, 8.1, 8.8 µM tubulin; 1 mM MgCl2 + CaCl2: 4.8, 6.2, 8.8. (D) Rescue position relative to catastrophe site. Bars represent mean ± 95% CI from at least 39 length measurements from 25 microtubules, pooled from at least three separate experiments from the tubulin concentrations listed for A and C. (E) Rescue frequency as a function of depolymerization time. Bars represent mean ± SEP for each condition. Data pooled from at least 87 microtubules from at least three separate experiments from the tubulin concentrations listed for A and C. (F) Percent of rescues that occur repeatedly, as in Figure 4B. Bars represent mean ± SEP. (E) Significance determined by Fishers exact test. All other panels: significance determined by Mann-Whitney U test. *: p < 0.01; **: p ≪ 0.001; ns: not significant.
FIGURE 6:
FIGURE 6:
Rescue activity is determined during depolymerization. (A) Representative kymograph of wash-in experiment. Dashed line denotes the wash-in timepoint. Dashed line denotes the preexisting lattice before wash-in. The first termination site after wash-in (FT) denoted with arrow (see D–F). Image acquisition was paused during wash-in and resumed immediately afterward (see Materials and Methods). Images were collected at 1-s intervals. Tubulin concentration: 3.2 µM, pre-wash-in = 5 mM MgCl2 and post-wash-in = 5 mM MgCl2, vertical scale bar = 30 s and horizontal scale bar = 1 µm. (B) Polymerization rates of microtubules before (black bars) and after (gray bars) wash-in for each condition. Bars represent mean ± 95% CI of pooled data from at least 43 polymerization rates from 30 microtubules and a minimum of three separate experiments from the following tubulin concentrations: 5.3, 5.7, 5.9, 6.1, 6.3, 6.6, 6.9, 7.6, 8.0 µM. Significance denotes differences between rates before and after wash-in. (C) Depolymerization rates of microtubules before (black bars) and after (gray bars) wash-in for each condition from tubulin concentrations listed for B. (D) Percent of first catastrophes after wash-in that depolymerize to the stabilized seed and did not rescue. Bars in D–F represent mean ± SEP from data pooled from tubulin concentrations listed for B. (E) Percent of first catastrophes after wash-in that rescue within the preexisting lattice. (F) Percent of first catastrophes after wash-in that rescue within lattice added after wash-in. **: p ≪ 0.001; *: p < 0.05; ns: not significant. Significance determined by Fisher’s exact (D–F) and Mann-Whitney U test (B and C).
FIGURE 7:
FIGURE 7:
Rescue activity is determined during depolymerization. (A) Under rescue-promoting conditions, depolymerization is inhibited by rescue sites in the microtubule lattice, and the microtubule end returns to a polymerizing state. These sites may include, but are not limited to, regions of missing subunits (i.e., “protofilament gaps”) and subunits that maintain GTP at the E-site (i.e., “GTP islands”). (B) Under rescue-inhibiting conditions, divalent cations promote depolymerization and inhibit the activity of rescue sites in the lattice. Here we depict a proposed role for magnesium ions in promoting the outward curling of protofilaments.

Similar articles

Cited by

References

    1. Aher A, Akhmanova A. (2018). Tipping microtubule dynamics, one protofilament at a time. Curr Opin Cell Biol , 86–93. - PubMed
    1. Al-Bassam J, Kim H, Brouhard G, van Oijen A, Harrison SC, Chang F. (2010). CLASP promotes microtubule rescue by recruiting tubulin dimers to the microtubule. Dev Cell , 245–258. - PMC - PubMed
    1. Arnal I, Heichette C, Diamantopoulos GS, Chrétien D. (2004). CLIP-170/tubulin-curved oligomers coassemble at microtubule ends and promote rescues. Curr Biol , 2086–2095. - PubMed
    1. Aumeier C, Schaedel L, Gaillard J, John K, Blanchoin L, Théry M. (2016). Self-repair promotes microtubule rescue. Nat Cell Biol , 1054–1064. - PMC - PubMed
    1. Bers DM, Patton CW, Nuccitelli R. (2010). A practical guide to the preparation of Ca2+buffers. Methods Cell Biol , 1–26. - PubMed

Publication types

LinkOut - more resources