Clinical Trial
. 2019 Jan 22;26(4):825-835.e7.
doi: 10.1016/j.celrep.2018.12.107.

Neurons with Complex Karyotypes Are Rare in Aged Human Neocortex

Affiliations
Clinical Trial

Neurons with Complex Karyotypes Are Rare in Aged Human Neocortex

William D Chronister et al. Cell Rep. .

Abstract

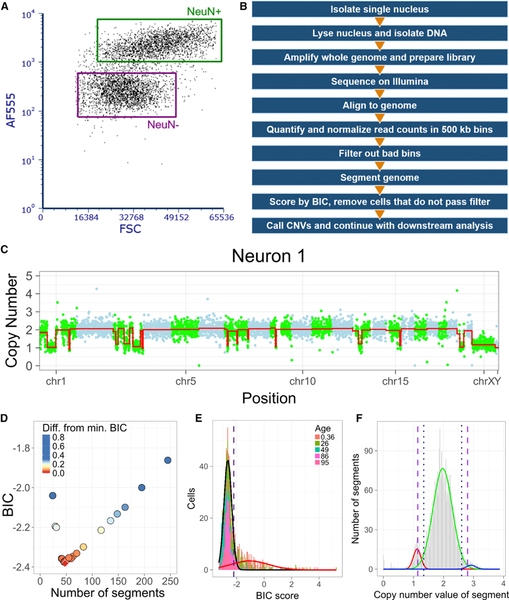
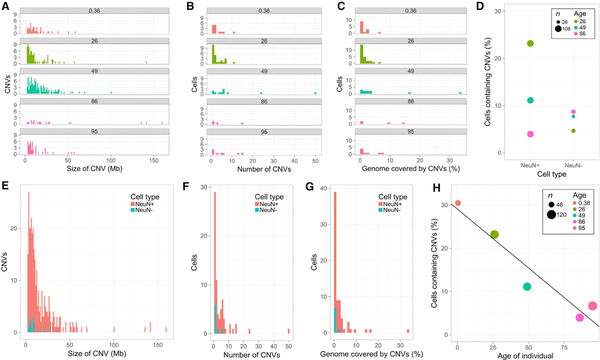
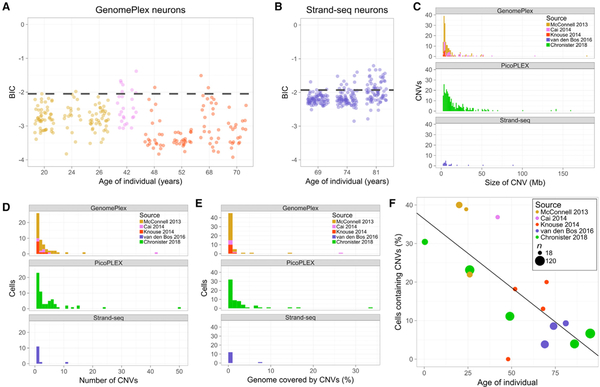
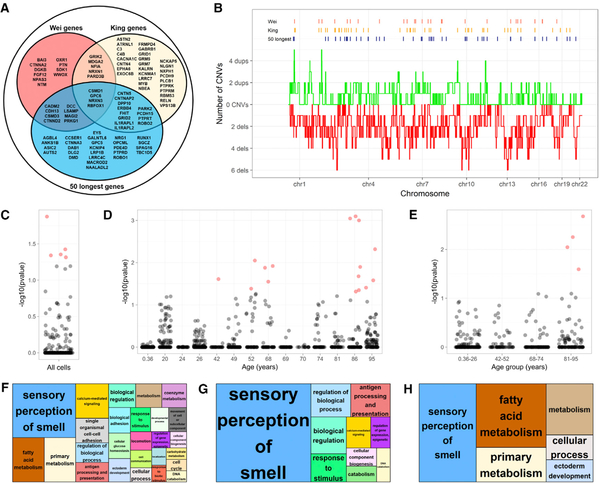
A subset of human neocortical neurons harbors complex karyotypes wherein megabase-scale copy-number variants (CNVs) alter allelic diversity. Divergent levels of neurons with complex karyotypes (CNV neurons) are reported in different individuals, yet genome-wide and familial studies implicitly assume a single brain genome when assessing the genetic risk architecture of neurological disease. We assembled a brain CNV atlas using a robust computational approach applied to a new dataset (>800 neurons from 5 neurotypical individuals) and to published data from 10 additional neurotypical individuals. The atlas reveals that the frequency of neocortical neurons with complex karyotypes varies widely among individuals, but this variability is not readily accounted for by tissue quality or CNV detection approach. Rather, the age of the individual is anti-correlated with CNV neuron frequency. Fewer CNV neurons are observed in aged individuals than in young individuals.


Conflict of interest statement

DECLARATION OF INTERESTS

The authors declare no competing interests.

Figures

Figure 1.
Figure 1.. Optimization of Single-Cell CNV Detection
(A and B) Representative NeuN+/− FANS (A) and summary of analysis pipeline (B). (C) CNV profileoftest Neuron 1. Read depth-derived CN values of genomic bins are colored alternately (green, blue) by chromosome. Red line indicates DNAcopy segmentation. (D) BIC scores for Neuron 1 across DNAcopy parameter space. Red diamond indicates lowest BIC score. (E) Histogram of BIC scores for new dataset. Gaussian distributions (black and red) were used to establish BIC cutoff (−2.21). (F) Segmentation output displays integer-like CN states (red, green, and blue) from which stringent (<1.14; >2.80; long dashes) and lenient (<1.34; >2.60; short dashes) CN state thresholds were established.
Figure 2.
Figure 2.. Mosaic CNVs Contribute to Neuronal Diversity
(A–C) Megabase-scale neuronal CNVs are observed across the human lifespan (ages 0.36–95 years) with varying size (A), number per cell (B), and percent genome coverage (C). (D) Divergent CNV neuron (NeuN+), but similar non-neuronal (NeuN), frequencies in 3 individuals. (E–G) CNVs have an increased impact on genetic architecture in neuronal genomes compared to non-neuronal genomes, as measured by size (E), number per cell (F), and percent genome coverage (G). (H) Significant anti-correlation between age and CNV neuron frequency (linear fit, R2 = 0.9224, p = 0.0094). Lenient CN state thresholds throughout figure.
Figure 3.
Figure 3.. Brain CNV Atlas
(A and B) BIC scores established from population distribution of GenomePlex (A, <−2.05) and Strand-seq (B, <− 1.93) WGA approaches. (C–E) CNV attributes including size (C), number per cell (D), and percent genome coverage (E) were similar regardless of WGA approach. (F) Significant atlas-wide anti-correlation between age and CNV neuron frequency (linear fit, R2 = 0.5521, p = 0.00097) Lenient CN state thresholds throughout figure.
Figure 4.
Figure 4.. Long Gene Enrichment in Brain CNV Atlas
(A) Venn diagram to define putative hotspots. (B) Bin-level summary (lenient CN state threshold) of deletion (red) and duplication (green) occurrence in brain CNV atlas. (C–E) Enrichment results for hotspots from all cells (C), individuals (D), and age groups (E). p values < 0.05 are red. (F–H) REViGO plots of enriched Gene Ontology (GO) terms for all of the data analyzed. The relative size of each category reflects significance; the largest groups have the lowest p values. GO enrichment determined using PANTHER analysis of CNV-affected genes in all neural data (F), and neurons from age groups 68–74 (G) and 81–95 years old (H).

References

    1. Anacker C, and Hen R (2017). Adult hippocampal neurogenesis and cognitive flexibility - linking memory and mood. Nat. Rev. Neurosci 18, 335–346. - PMC - PubMed
    1. Bae T, Tomasini L, Mariani J, Zhou B, Roychowdhury T, Franjic D, Pletikos M, Pattni R, Chen BJ, Venturini E, et al. (2018). Different mutational rates and mechanisms in human cells at pregastrulation and neurogenesis. Science 359, 550–555. - PMC - PubMed
    1. Baillie JK, Barnett MW, Upton KR, Gerhardt DJ, Richmond TA, De Sapio F, Brennan PM, Rizzu P, Smith S, Fell M, et al. (2011). Somatic retrotransposition alters the genetic landscape of the human brain. Nature 479, 534–537. - PMC - PubMed
    1. Bedrosian TA, Quayle C, Novaresi N, and Gage FH (2018). Early life experience drives structural variation of neural genomes in mice. Science 359, 1395–1399. - PubMed
    1. Benaglia T, Chauveau D, Hunter DR, and Young DS (2009). mixtools: an R Package for Analyzing Mixture Models. J. Stat. Softw 32, 29.

Publication types