. 2019 Jan 22;26(4):984-995.e6.
doi: 10.1016/j.celrep.2018.12.094.

Impaired LXRα Phosphorylation Attenuates Progression of Fatty Liver Disease

Affiliations

Impaired LXRα Phosphorylation Attenuates Progression of Fatty Liver Disease

Natalia Becares et al. Cell Rep. .

Abstract

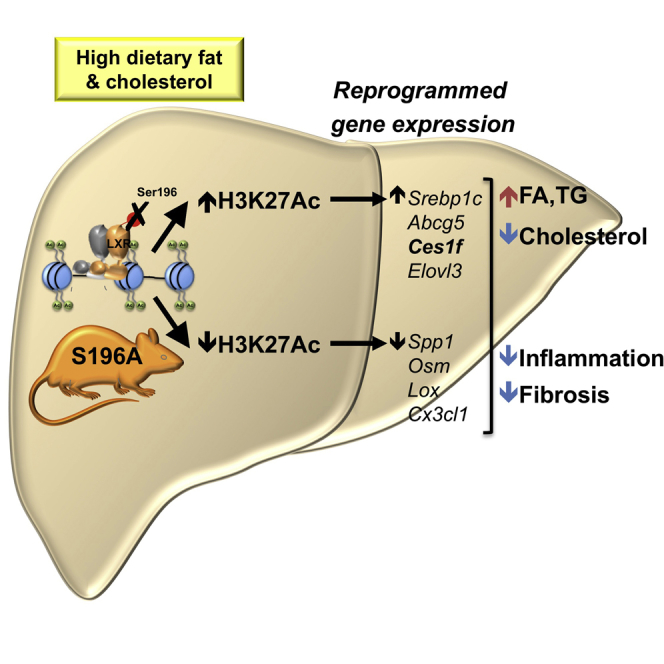
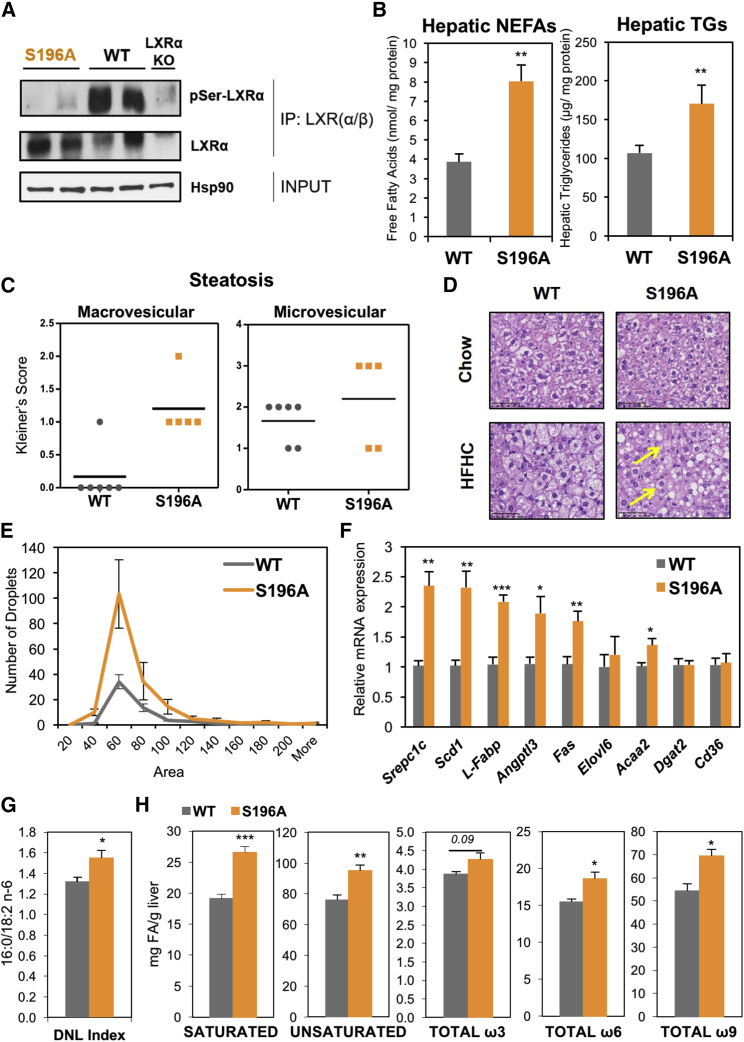
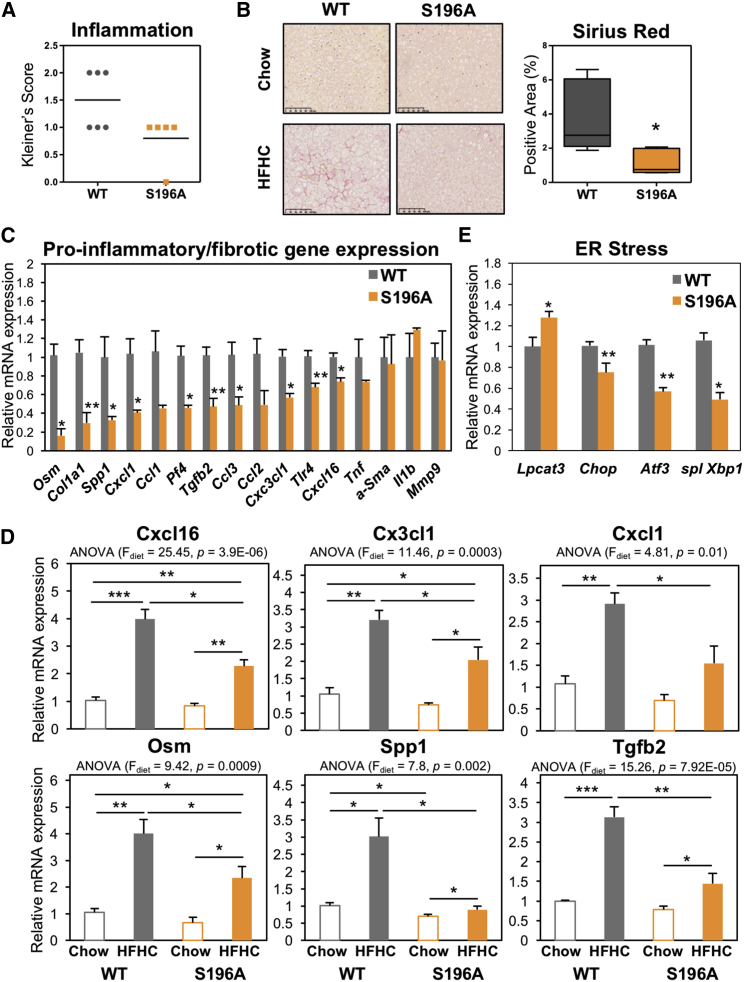
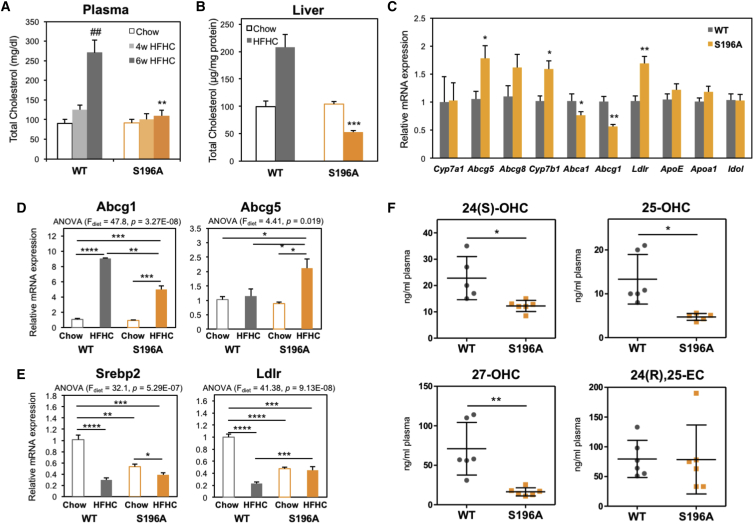
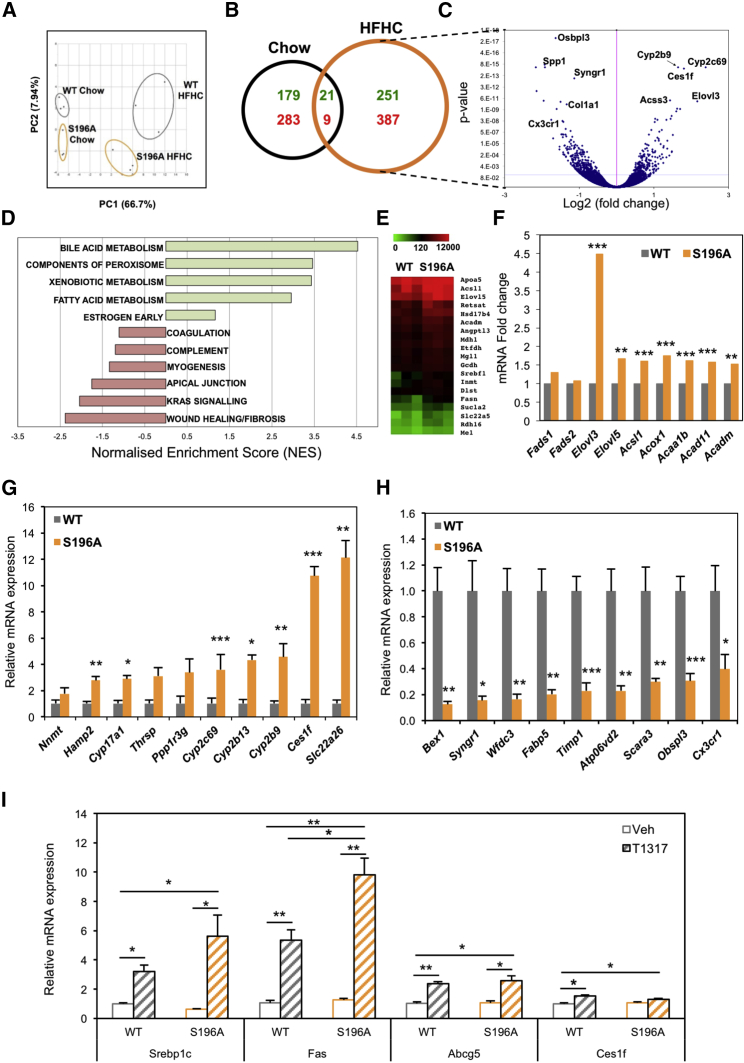
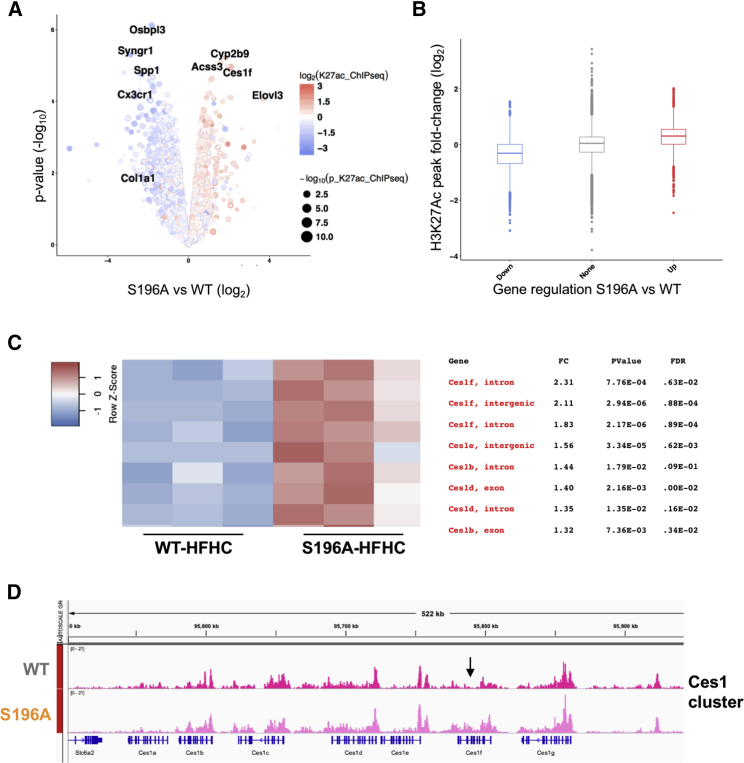
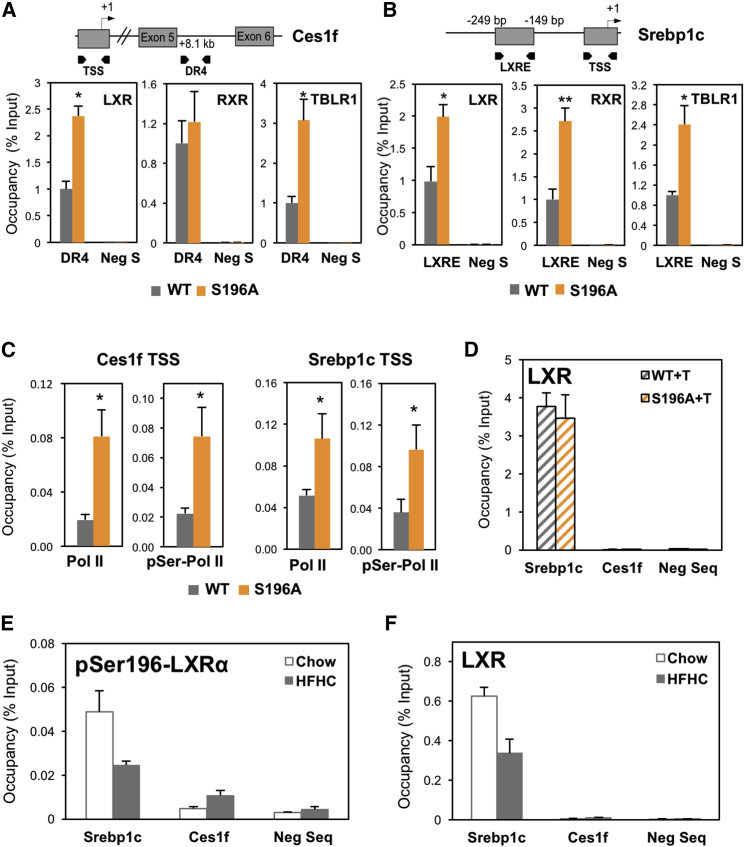
Non-alcoholic fatty liver disease (NAFLD) is a very common indication for liver transplantation. How fat-rich diets promote progression from fatty liver to more damaging inflammatory and fibrotic stages is poorly understood. Here, we show that disrupting phosphorylation at Ser196 (S196A) in the liver X receptor alpha (LXRα, NR1H3) retards NAFLD progression in mice on a high-fat-high-cholesterol diet. Mechanistically, this is explained by key histone acetylation (H3K27) and transcriptional changes in pro-fibrotic and pro-inflammatory genes. Furthermore, S196A-LXRα expression reveals the regulation of novel diet-specific LXRα-responsive genes, including the induction of Ces1f, implicated in the breakdown of hepatic lipids. This involves induced H3K27 acetylation and altered LXR and TBLR1 cofactor occupancy at the Ces1f gene in S196A fatty livers. Overall, impaired Ser196-LXRα phosphorylation acts as a novel nutritional molecular sensor that profoundly alters the hepatic H3K27 acetylome and transcriptome during NAFLD progression placing LXRα phosphorylation as an alternative anti-inflammatory or anti-fibrotic therapeutic target.

Keywords: fibrosis; inflammation; lipid metabolism; liver; liver X receptor; non-alcoholic fatty liver disease; phosphorylation; transcription.


Figures

None
Graphical abstract
Figure 1
Figure 1
LXRα-S196A Mice Develop Enhanced Steatosis on a High-Cholesterol Diet (A) LXRα-Ser196 phosphorylation analyzed by LXRα/β immunoprecipitation of liver homogenates and immunoblotting with a phospho-S196-LXRα-specific antibody. Global LXRα expression was assessed. Expression of Hsp90 as input loading control is shown. (B) Hepatic non-esterified fatty acids (NEFAs) and triglycerides (TGs) in mice fed an HFHC diet (n = 6/group) normalized to liver protein levels. (C) Kleiner’s scores for steatosis (0–3) of liver sections (n ≥ 5/group). (D) Representative images of H&E-stained liver sections from mice fed chow or HFHC diet. Arrows point at examples of microvesicular steatosis. Scale bar, 50 μM. (E) Distribution of lipid droplets by area in H&E-stained liver sections (n = 6/group). Area distribution was compared by chi-square test for trend (p = 0.0003). (F) Hepatic gene expression in mice fed an HFHC diet (n = 6/group). Normalized data are shown relative to WT, set as 1. (G) De novo lipogenesis (DNL) index measured as the ratio of 16:0 (Palmitate) and 18:2 n-6 (Linoleic) content in liver (n = 6/group). (H) Hepatic fatty acid levels (n = 6/group). Data are means ± SEM. p < 0.05, ∗∗p < 0.005 or ∗∗∗p < 0.005 relative to WT.
Figure 2
Figure 2
LXRα-S196A Alleviates Diet-Induced Hepatic Inflammation and Fibrosis (A) Kleiner’s scores for lobular inflammation (0–3) from liver sections of mice (n = 6/group). (B) Representative images of Picrosirius-Red-stained liver sections (left). Scale bar, 100 μM. Quantification of stained areas by ImageJ (n = 6/group) (right). Values are the average of positively stained area. (C) Hepatic gene expression (n = 6/group). Normalized data are shown relative to WT. Data are means ± SEM. ∗p < 0.05, ∗∗p < 0.005 relative to WT. (D) Hepatic gene expression in mice fed chow (n = 4/group) or HFHC diet (n = 6/group). Normalized data are shown relative to WT chow group. p < 0.05, ∗∗p < 0.005, ∗∗∗p < 0.0005, relative to WT chow. Data are means ± SEM. ∗p < 0.05, ∗∗p < 0.005 relative to WT. (E) Hepatic gene expression (n = 6/group). Values shown are normalized to cyclophilin and relative to WT.
Figure 3
Figure 3
LXR Phosphorylation-Deficient Mice Show Reduced Cholesterol Levels in Response to an HFHC Diet (A) Plasma total cholesterol levels in mice fed a chow (n = 4/group) or an HFHC diet (n ≥ 5/group). (B) Hepatic total cholesterol levels in mice fed a chow (n = 4/group) or HFHC diet (n = 6/group). Values shown are normalized to protein levels in tissue homogenates. (C) Hepatic gene expression in mice fed an HFHC diet (n = 6/group). Normalized data are shown relative to WT. (D and E) Abcg1 and Abcg5 (D) and Srebp2 and Ldlr (E) hepatic gene expression in mice fed chow (n = 4) or an HFHC diet (n = 6). Normalized data are shown relative to WT chow group. Significance of comparisons between HFHC WT and S196A genotypes is shown in C). (F) Quantification of free oxysterols in plasma of mice fed an HFHC diet (n = 6/group). Data are means ± SEM. p < 0.05, ∗∗p < 0.005, ∗∗∗p < 0.0005, ∗∗∗∗p < 0.00005 relative to WT. ##p < 0.005, 4 versus 6 weeks.
Figure 4
Figure 4
Changes in LXRα Phosphorylation Reprogram Hepatic Gene Expression (A) Principal-component (PC) analysis plot showing RNA-seq samples analyzed by diet and genotype. (B) Venn diagram of genes regulated by LXRαS196A compared to LXRαWT (±1.3-fold, p < 0.05) in the indicated diets. Numbers of upregulated and downregulated genes are depicted in green and red, respectively. (C) Volcano plot of log2 ratio versus p value of differentially expressed genes comparing S196A and WT livers exposed to an HFHC (n = 3/group). Blue line indicates adjusted p value of 0.04 (Wald test for logistic regression). (D) GSEA analysis showing enriched pathways in S196A livers with p < 0.5 (100 permutations) derived from HALLMARK gene sets. (E) Heatmaps of hepatic RNA-seq raw gene counts (n = 3/genotype) for fatty acid and triglyceride metabolism. (F) Fold change of hepatic RNA-seq gene counts in S196A compared to WT mice fed an HFHC diet (n = 3/genotype). (G and H) Hepatic gene expression by qPCR of top (G) upregulated and (H) downregulated genes from the RNA-seq analysis on experimentally independent WT and S196A livers (n = 6/genotype). (I) Hepatic gene expression from WT and S196A mice treated with vehicle or 50 mg/kg T0901317 (n = 4/group). Data are normalized to cyclophilin and shown relative to WT vehicle set as 1. Significance was determined using single variance ANOVA followed by Student’s t test. Normalized data are shown relative to WT as mean ± SEM. p < 0.05, ∗∗p < 0.005 or ∗∗∗p < 0.005
Figure 5
Figure 5
LXRα Phosphorylation at S196 Affects Global H3K27 Acetylation and LXR and TBLR1 Occupancy in the Ces1f Gene (A) Volcano plot comparing differences in gene expression and H3K27Ac enriched sites shows log2 ratio versus –log10 p value of differentially expressed genes in S196A versus WT livers exposed to HFHC (n = 3). Colors show changes in H3K27Ac enrichment, and dot size depicts the p value. (B) Boxplot showing the distribution of signal changes of altered H3K27Ac sites (p < 0.05) annotated to the upregulated (red), downregulated (blue), and unchanged (gray) genes in S196A versus WT livers by RNA-seq analysis. (C) Heatmaps of H3K27Ac ChIP-seq counts (n = 3/genotype) for Ces family genes. Location, fold change (FC), p value, and false discovery rate (FDR) value are indicated for each peak. (D) H3K27Ac ChIP-seq read alignment tracks in WT and S196A livers for Ces family gene cluster. The arrow marks location of identified DR4.
Figure 6
Figure 6
Identification of LXR Binding Sites in LXRα Phosphorylation/Diet-Sensitive Genes (A and B) LXR, RXR, and TBLR1 occupancy at Ces1f newly identified DR4 (A) and Srebp-1c LXRE (B) sequences or a region within a gene desert (Neg S) in livers of WT and S196A mice fed an HFHC for 6 weeks (n ≥ 3/group). (C) RNA Pol II and pSer2-Pol II occupancy at Ces1f and Srebp-1c transcription start site (TSS) in livers of WT and S196A mice fed an HFHC diet (n ≥ 3). (D) LXR occupancy at Srebp-1c LXRE, Ces1f DR4, and non-specific negative sequences in livers of WT and S196A mice treated with T0901317 (+T) (n = 3/group). (E and F) pSer196-LXRα (E) and LXR occupancy (F) at Srebp1c LXRE, Ces1f putative DR4 and non-specific negative sequences in livers of WT mice fed a chow or HFHC diet for 6 weeks (n = 3/group). Results are normalized to input values. For (A)–(C), results are normalized to input values and shown relative to WT, set as 1. Data represent means ± SEM. p < 0.05, ∗∗p < 0.005 determined by Student’s t test.

References

    1. Aguilar-Olivos N.E., Carrillo-Córdova D., Oria-Hernández J., Sánchez-Valle V., Ponciano-Rodríguez G., Ramírez-Jaramillo M., Chablé-Montero F., Chávez-Tapia N.C., Uribe M., Méndez-Sánchez N. The nuclear receptor FXR, but not LXR, up-regulates bile acid transporter expression in non-alcoholic fatty liver disease. Ann. Hepatol. 2015;14:487–493. - PubMed
    1. Ahn S.B., Jang K., Jun D.W., Lee B.H., Shin K.J. Expression of liver X receptor correlates with intrahepatic inflammation and fibrosis in patients with nonalcoholic fatty liver disease. Dig. Dis. Sci. 2014;59:2975–2982. - PubMed
    1. Anders S., Huber W. Differential expression analysis for sequence count data. Genome Biol. 2010;11:R106. - PMC - PubMed
    1. Babicki S., Arndt D., Marcu A., Liang Y., Grant J.R., Maciejewski A., Wishart D.S. Heatmapper: Web-enabled heat mapping for all. Nucleic Acids Res. 2016;44:W147–W153. - PMC - PubMed
    1. Beaven S.W., Wroblewski K., Wang J., Hong C., Bensinger S., Tsukamoto H., Tontonoz P. Liver X receptor signaling is a determinant of stellate cell activation and susceptibility to fibrotic liver disease. Gastroenterology. 2011;140:1052–1062. - PMC - PubMed

Publication types

MeSH terms