. 2019 Jan 23;17(1):e3000102.
doi: 10.1371/journal.pbio.3000102. eCollection 2019 Jan.

Evolutionary dynamics of bacteria in the gut microbiome within and across hosts

Affiliations

Evolutionary dynamics of bacteria in the gut microbiome within and across hosts

Nandita R Garud et al. PLoS Biol. .

Abstract

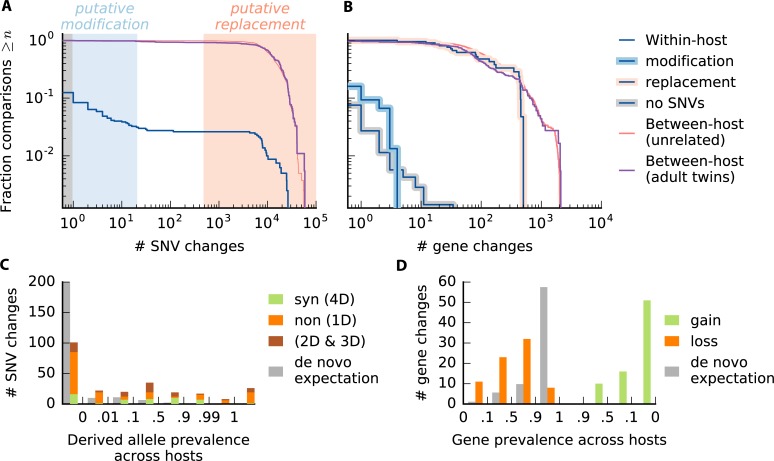
Gut microbiota are shaped by a combination of ecological and evolutionary forces. While the ecological dynamics have been extensively studied, much less is known about how species of gut bacteria evolve over time. Here, we introduce a model-based framework for quantifying evolutionary dynamics within and across hosts using a panel of metagenomic samples. We use this approach to study evolution in approximately 40 prevalent species in the human gut. Although the patterns of between-host diversity are consistent with quasi-sexual evolution and purifying selection on long timescales, we identify new genealogical signatures that challenge standard population genetic models of these processes. Within hosts, we find that genetic differences that accumulate over 6-month timescales are only rarely attributable to replacement by distantly related strains. Instead, the resident strains more commonly acquire a smaller number of putative evolutionary changes, in which nucleotide variants or gene gains or losses rapidly sweep to high frequency. By comparing these mutations with the typical between-host differences, we find evidence that some sweeps may be seeded by recombination, in addition to new mutations. However, comparisons of adult twins suggest that replacement eventually overwhelms evolution over multi-decade timescales, hinting at fundamental limits to the extent of local adaptation. Together, our results suggest that gut bacteria can evolve on human-relevant timescales, and they highlight the connections between these short-term evolutionary dynamics and longer-term evolution across hosts.


Conflict of interest statement

The authors have declared that no competing interests exist.

Figures

Fig 1
Fig 1. Genetic diversity within hosts.
Bacteroides vulgatus is shown as an example in panels A–E; examples for 24 other species are shown in S1 Fig, S2 Fig, and S3 Fig. (A–D) The distribution of major allele frequencies at synonymous sites in the core genome for four different samples, with the median read depth D¯ listed above each panel. Major allele frequencies are estimated by max{f,1−f}, where f is the frequency of the base on the reference genome (S1A Text, part iii). To emphasize the distributional patterns, the vertical axis is scaled by an arbitrary normalization constant in each panel, and it is truncated for visibility. The white region denotes the intermediate frequency range used for the polymorphism calculations below. (E) The average fraction of synonymous sites in the core genome with major allele frequencies ≤80% (white region in A–D), for all samples with D¯20. Vertical lines denote 95% posterior confidence intervals based on the observed number of counts (S1B Text). The letters indicate the corresponding values for the samples in panels (A–D) for comparison. (F) The distribution of quasi-phaseable (QP) samples among the 35 most prevalent species, arranged by descending prevalence; the distribution across hosts is shown in S7 Fig. For comparison, panels (C) and (D) are classified as QP, while panels (A) and (B) are not.
Fig 2
Fig 2. Between-host divergence across prevalent species of gut bacteria.
(A) Schematic illustration. For a given pair of hosts (h1, h2), core-genome nucleotide divergence (d) is computed for each species (s1, s2, etc.) that is quasi-phaseable (QP) in both hosts. (B) Distribution of d across all pairs of unrelated hosts for a panel of prevalent species. Species are sorted according to their phylogenetic distances [33], with the number of QP hosts indicated in parentheses; species were only included if they had at least 33 QP hosts (>500 QP pairs). Symbols denote the median (dash), 1 percentile (small circle), and 0.1 percentile (large circle) of each distribution and are connected by a red line for visualization; for distributions with <103 data points, the 0.1 percentile is estimated by the second-lowest value. The shaded region denotes our ad hoc definition of "closely related" divergence, d≤2×10⁻⁴. (C) The distribution of the number of species with closely related strains in distinct hosts present in the same or different continents. The null distribution is obtained by randomly permuting hosts within each species. Although the observed values are significantly different than the null (P<10−4), the large contribution from different continents shows that closely related strains are not solely a product of geographic separation. (D) The distribution of the number of species with closely related strains for each pair of hosts. The null distribution is obtained by randomly permuting hosts independently within each species (n = 103 permutations, P≈0.9). This shows that there is no tendency for the same pairs of hosts to have more closely related strains than expected under the null distribution above.
Fig 3
Fig 3. Signatures of selective constraint within species as a function of core-genome divergence.
Ratio of divergence at nondegenerate nonsynonymous sites (dN) and 4-fold degenerate synonymous sites (dS) as a function of dS (S1D Text) for all species × host1 × host2 combinations in Fig 2 (gray circles). Crosses (x) denote species-wide estimates obtained from the ratio of the median dN and dS within each species. The red line denotes the theoretical prediction from the purifying selection null model in S1D Text. Inset shows the ratio between the cumulative private dN and dS values for all quasi-phaseable host pairs with core-genome-wide synonymous divergence less than dS. The narrow shaded region denotes 95% confidence intervals estimated by Poisson resampling (S1D Text), which shows that dN/dS≲1, even for low dS.
Fig 4
Fig 4. Recombination between strains across hosts.
(A) Phylogenetic inconsistency between individual single nucleotide variants (SNVs) and core-genome-wide divergence for each of the species in Fig 2. The fraction of inconsistent SNVs is plotted for all 4-fold degenerate synonymous SNVs in the core genome with estimated age ≤d (S1E Text, part i). Singleton SNVs are excluded, because inconsistency can only be assessed for SNVs with ≥2 minor alleles. (B, inset) Linkage disequilibrium (LD) (σd2) as a function of distance (l) between pairs of 4-fold degenerate synonymous sites in the same core gene (S1F Text). Individual data points are shown for distances <100 bp, while the solid line shows the average in sliding windows of 0.2 log units. The gray line indicates the values obtained without controlling for population structure, while the blue line is restricted to the largest top-level clade (S2 Table, S1E Text, part ii). The solid black line denotes the neutral prediction from S1F Text; the only free parameters in this model are vertical and horizontal scaling factors, which have been shifted to enhance visibility. For comparison, the core-genome-wide estimate for SNVs in different genes is depicted by the dashed line and circle. (B) Summary of LD in the largest top-level clade for all species with ≥10 quasi-phaseable hosts. Species are sorted phylogenetically as in Fig 2B. For each species, the three dashes denote the value of σd2(l) for intragenic distances of l=9, 99, and 2,001 bp, respectively, while the core-genome-wide values are depicted by circles. Points belonging to the same species are connected by vertical lines for visualization.
Fig 5
Fig 5. Within-host changes across prevalent species of gut bacteria.
(a) Within-host nucleotide differences over 6-month timescales. The blue line shows the distribution of the number of single nucleotide variant (SNV) differences between consecutive quasi-phaseable (QP) time points for different combinations of species, host, and nonoverlapping time interval (if more than two samples are available) for the 45 prevalent species in S20 Fig. The distribution of the number of sites tested in each comparison is shown in S18 Fig. For comparison, the red line shows a matched distribution of the number of SNV differences between each initial time point and a randomly selected Human Microbiome Project host, and the purple line shows the distribution of the number of SNV differences between QP lineages in pairs of adult twins. The shaded regions indicate replacement events (light red, 3% of all within-host comparisons), modification events (light blue, 9% of within-host comparisons), and no detected changes (gray, 88% of within-host comparisons); these ad hoc thresholds were chosen to be conservative in calling modifications. (B) Within-host gene content differences (gains + losses). The blue lines show the distribution of the number of gene content differences within hosts for the samples in (A), with the putative modifications highlighted in light blue, the putative replacements highlighted in light red, and the samples with no SNV changes highlighted in gray. The distribution of the number of genes tested in each comparison is shown in S18 Fig. For comparison, the corresponding between-host and twin distributions are shown as in (A). (C) The total number of nucleotide differences at nondegenerate nonsynonymous sites (1D), 4-fold degenerate synonymous sites (4D), and other sites (2D and 3D) aggregated across the modification events in (A). Sites are stratified based on their prevalence across hosts (S1H Text). For comparison, the gray bars indicate the expected distribution for random de novo mutations (S1H text, part i). (D) The total number of gene loss and gain events among the gene content differences in (B), stratified by the prevalence of the gene across hosts. The de novo expectation for gene losses is computed as in (C); by definition, there are no de novo gene gains.

Comment in

References

    1. David LA, Maurice CF, Carmody RN, Gootenberg DB, et al. Diet rapidly and reproducibly alters the human gut microbiome. Nature. 2013;505:559–563. 10.1038/nature12820 - DOI - PMC - PubMed
    1. Seedorf H, Griffin NW, Ridaura VK, Reyes A, et al. Bacteria from Diverse Habitats Colonize and Compete in the Mouse Gut. Cell. 2014;159:253–266. 10.1016/j.cell.2014.09.008 - DOI - PMC - PubMed
    1. Rakoff-Nahoum S, Foster KR, Comstock LE. The evolution of cooperation within the gut microbiota. Nature. 2016;533:255–259. 10.1038/nature17626 - DOI - PMC - PubMed
    1. Verster AJ, Ross BD, Radey MC, Bao Y, et al. The Landscape of Type VI Secretion across Human Gut Microbiomes Reveals Its Role in Community Composition. Cell Host & Microbe. 2017;22:411–419. - PMC - PubMed
    1. Bradley PH, Nayfach S, Pollard KS. Phylogeny-corrected identification of microbial gene families relevant to human gut colonization. PLoS Comput Biol. 2018;14(8):e1006242 10.1371/journal.pcbi.1006242 - DOI - PMC - PubMed

Publication types