. 2019 Apr;76(7):1397-1417.
doi: 10.1007/s00018-019-03008-5. Epub 2019 Jan 23.

Mitochondrial stress triggers a pro-survival response through epigenetic modifications of nuclear DNA

Affiliations

Mitochondrial stress triggers a pro-survival response through epigenetic modifications of nuclear DNA

Lía Mayorga et al. Cell Mol Life Sci. 2019 Apr.

Abstract

Mitochondrial dysfunction represents an important cellular stressor and when intense and persistent cells must unleash an adaptive response to prevent their extinction. Furthermore, mitochondria can induce nuclear transcriptional changes and DNA methylation can modulate cellular responses to stress. We hypothesized that mitochondrial dysfunction could trigger an epigenetically mediated adaptive response through a distinct DNA methylation patterning. We studied cellular stress responses (i.e., apoptosis and autophagy) in mitochondrial dysfunction models. In addition, we explored nuclear DNA methylation in response to this stressor and its relevance in cell survival. Experiments in cultured human myoblasts revealed that intense mitochondrial dysfunction triggered a methylation-dependent pro-survival response. Assays done on mitochondrial disease patient tissues showed increased autophagy and enhanced DNA methylation of tumor suppressor genes and pathways involved in cell survival regulation. In conclusion, mitochondrial dysfunction leads to a "pro-survival" adaptive state that seems to be triggered by the differential methylation of nuclear genes.

Keywords: Apoptosis; Autophagy; DNA methylation; Mitochondrial diseases; Mitochondrial dysfunction; Stress response; Survival.


Conflict of interest statement

The authors declare no competing interests.

Figures
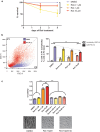
Fig. 1
Fig. 1
High-dose rotenone (Rot) treated cells survive and undergo striking changes in shape, size and complexity. aCell survival curve in 4-day Rot treatment surveillance, **p < 0.01 log-rank (Mantel–Cox) test, Square Chi 9.177; # experiments = 16 DMSO, 13 Rot-0.1 µM, 13 Rot-1 µM and 16 Rot-10 µM. bChanges in cellular size and complexity assessed by flow cytometry using the forward scatter area (FSC-A) for size and side scatter area (SSC-A) for complexity (intra-cellular granularity) measurement. Results for 4-day treated cells are shown. For quantification, the dot plot was divided into two populations: P1 (small and complex), P2 (large and not complex). **p < 0.01, Friedman test + Dunn’s multiple comparison test; #experiments = 4. cChanges in cell shape with Rot 4-day treatment and reversibility (rev) assays quantified by Image J’s circularity parameter ***p < 0.001, Kruskal–Wallis test + Dunn’s multiple comparison test; #experiments = 3
Fig. 2
Fig. 2
High-dose 4-day rotenone (Rot) treatment triggers an autophagy-dependent pro-survival response. aCell death assays of cells treated 4 days with Rot by flow cytometry using Annexin V (FITC-A: apoptosis) and TO-PRO-3 (Alexa 647-A: necrosis).  % of apoptotic cells are shown and quantified as Q2 + Q3. *p < 0.05, Friedman test + Dunn’s multiple comparison test; # experiments = 3. bLC3 and p62 Western Blot of 4-day Rot treated cells. LC3-II/LC3-I ratio and p62/vinculin are shown to reflect autophagic activity. Values were normalized to the control (DMSO). In the LC3 WB, the bands that are shown are from the same gel and electrophoretic run, the image was cut because in between there were other conditions not shown. ***p < 0.001, *p < 0.05, Kruskal–Wallis test + Dunn’s multiple comparison test; LC3 #experiments = 3 with 4 conditions plus 5 DMSO + Rot-10 µM experiments. The most abundant p62 form in these cells is a ~ 37 kDa isoform or cleaved protein [44, 45], so the quantification was done for this band (*p < 0.05, One-tailed, One sample T-test) p62 # experiments = 3. cApoptosis assay using Annexin V-FITC in controls (DMSO) and Rot-10 µM treated cells ± Bafilomycin B1 (Baf) for 4 days. Using a threshold based on autofluorescence in the Annexin V-FITC histogram, cells were designated as apoptosis (+) or (−) for quantification. *p < 0.05, Friedman test + Dunn’s multiple comparison test; # experiments = 3
Fig. 3
Fig. 3
DNA methylation is necessary for the autophagy depending pro-survival response in high-dose rotenone (Rot) treated cells. aApoptosis assay by flow cytometry using Annexin V-FITC in control (DMSO) and Rot-10 µM treated cells ± 5-Aza-2′-deoxycytidine (5-Aza) 10 µM for 1 day. Using a threshold based on autofluorescence in the Annexin V-FITC histogram, cells were separated as apoptosis (+) and apoptosis (−) for quantification. *p < 0.05 Friedman test + Dunn’s multiple comparison test; #experiments = 3. The shown control condition (DMSO) presented a high basal apoptotic level (~ 20%); this could be due to a higher DMSO concentration needed to compare with the Rot + Aza condition; despite this the Rot + Aza condition exhibited a significantly higher apoptosis rate. bLC3 Western Blot of control and 1-day Rot-10 µM treated cells ± 5-Aza. LC3-I (17 kDa approx), LC3-II (15 kDa approx). LC3-II/β-actin normalized to the control condition (DMSO) is shown to reflect autophagic activity. *p < 0.05 One-tailed paired Student’s T tests; #experiments = 4
Fig. 4
Fig. 4
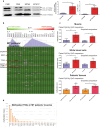
Increased autophagy and methylation of Tumor suppressor genes (TSGs) in patients with mitochondrial diseases (MT patients). aLC3 Western Blot of skeletal muscle samples from mitochondrial disease patients (MTM) and controls (CM). All bands shown here are from the same gel and electrophoretic run. The image was cut, since in between there were other conditions. We had to use more than one WB assay for quantification. To do this correctly, we normalized to CM8 that was run on every gel. *p < 0.05, one-tailed Mann–Whitney tests. bHeat map of the MS-MLPA methylation analysis results + unsupervised hierarchical clustering of samples according to their methylation level of 102 CpG sites in 54 TSGs. 14 muscle samples (9 MT patients = MTMs + 5 control muscles = CMs) and 12 leukocyte samples (6 MT patients = MTLs + 6 controls = CLs). 8 of the 9 MTM samples clustered together with 100% support (Pearson’s correlation + average linkage), on the left part of the chart marked with red arrows are the significantly hypermethylated genes in patient muscles. cQuantification of the methylation level of the different sample types by paired CpG-by-CpG comparison (two-tailed paired Student’s T test) and by unpaired mean comparison (two-tailed unpaired Student’s T test) *p < 0.05, **p < 0.01, ***p < 0.001. dCpGs hypermethylated in patient muscle are shown in a descendent order, marked with **p < 0.01/*p < 0.05 are the CpGs with a significant hypermethylation in patients when compared to control muscle assessed by one-tailed unpaired Student’s T test
Fig. 5
Fig. 5
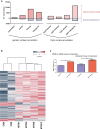
Mitochondrial disease patients’ muscles show hypermethylation of CpG-rich regions as determined by RRBS. aDistribution in the genome of differentially methylated CpGs using gene and CpG context annotations. bUnsupervised hierarchical clustering (Manhattan’s distance + average linkage) of DMRs’ z-score values from MT patient and control muscle samples. MTM (MT patient muscles) and CM (control muscles). Sample types cluster separately with 100% support. cComparison of the methylation of DMRs between MT patients and controls determined through DMR by DMR paired comparison (Wilcoxon matched pairs signed rank test) and unpaired mean comparison (unpaired Student’s T test). ***p < 0.001, **p < 0.01
Fig. 6
Fig. 6
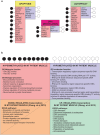
Bioinformatical pathway analysis of the RRBS results + comparison with transcriptional data available in the literature. aMetascape analysis of genes whose promoters were found hyper or hypomethylated in MT patients which have “membership” in apoptosis, autophagy or DNA methylation. Pink boxes expose the list of genes whose promoters are hypermethylated; blue boxes show the list of genes whose promoters are hypomethylated. bGREAT pathway analysis. Hyper (pink box) and hypomethylated (blue box) GO molecular functions/biological processes in MT patient muscles. Orange box crossed out with a pointed line exposes transcriptionally down-regulated and green and underlined box includes up-regulated KEGG pathways in MT patient muscles according to Zhang et al. [31]. In the figure, we only included pathways that involved general cellular processes and functions that could have important impact in muscle tissue. The complete list can be found in supplementary material. GEF guanine-nucleotide exchange factor, RNA pol II RNA polymerase II, TF transcription factor
Fig. 7
Fig. 7
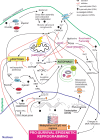
Integrative figure of cellular mitochondrial stress response. Mitochondrial dysfunction triggers a complex stress pro-survival response involving epigenetic, transcriptional, translational and post-translational check points. We have combined previously reported activation/inhibition pathways with transcriptional data [10, 31] and our new epigenetic and functional results in mitochondrial dysfunctional cells. The three main processes described in this paper (apoptosis, autophagy, and DNA methylation) are in colored squares with up/down filled arrows indicating their activation/inhibition in our experiments. In purple, we show known mitochondrial dysfunction metabolites. We selected some differentially methylated and transcribed genes/pathways/functions described in this work with potential influence in this stress situation. Differential methylation is marked with empty (hypomethylated) or filled (hypermethylated) circles. Proteins or pathways with differential transcription are marked underlined (up-regulated) or crossed out with a pointed line (down-regulated). The normal interactions are exposed as described in the literature. The impact of the alteration (hypo/hypermethylation; transcriptional up/down-regulation) is left for reader’s interpretation. We highlight the pathways that regulate apoptosis, autophagy and DNA methylation parting from a mitochondrial dysfunctional cell. The increased [AMP]/[ATP] ratio activates AMPK signaling that ultimately inhibits apoptosis and activates autophagy [46]. ROS are main messengers in energy-deficient conditions and through AKT phospho-activation they inhibit apoptosis and autophagy and induce de novo DNA methylation through DNMT3b activation [47] [20]. Depending on the concentration, they can also activate AMPK and, therefore, induce autophagy [48]. Also, they trigger Ca2+ influx and, in turn, activate CAMK2A that through BECN1 phosphorylation ends up inhibiting autophagy [49]. ROS and low ATP also reduce the cellular [SAM] and, therefore, the provision of methyl groups for DNA methylation [23]. Low [NAD+]/[NADH] ratio reduces the activity of Sirt1; hence, DNMT1’s activity is inhibited [22]. High Succinate and Fumarate concentrations inhibit TET enzymes [23], reducing DNA demethylation. Ras, through its Ras/PI3K/Akt pathway inhibits autophagy and activates proliferation through Raf/MEK/ERK/ETS [50]. FOXO target genes promote apoptosis and autophagy and inhibit proliferation [51]. In summary, this mitochondrial dysfunctional scenario triggers an epigenetic reprogramming that modifies transcription activity with the purpose of a pro-survival response. AMP adenosine monophosphate, ATP adenosine triphosphate, AMPK AMP-activated protein kinase, AKT AKT serine/threonine kinase 1, CAMK2A calcium/calmodulin dependent protein kinase IIα, DNMT1 DNA methyltransferase 1, DNMT3b DNA methyltransferase 3β, ERK (MAPK1) mitogen-activated protein kinase 1, ETS TF ETS transcription factor family, FOXO forkhead protein box O, GDP guanosine diphosphate, GTP guanosine triphosphate, LC3-II microtubule associated protein 1 light chain 3 (autophagosome form), MAPK8 mitogen-activated protein kinase 8, MEK mitogen-activated protein kinase 7, mTORC1 mammalian target of rapamycin kinase(mTOR) complex 1, NAD nicotinamide adenine dinucleotide, NADH reduced nicotinamide adenine dinucleotide, PI3K phosphatidylinositol biphosphate 3 kinase, Ras-GEF Ras-guanine nucleotide exchange factor, Rho-GEF Rho-guanine nucleotide exchange factor, Ras-GAP Ras-GTPase activating protein, RhoGAP: Rho-GTPase activating protein, ROCK: Rho kinase, ROS reactive oxygen species, SAM S-adenosyl methionine, Sirt1 sirtuin 1, TET ten-eleven translocation proteins, ULK1 unc-51 like autophagy activating kinase 1

Similar articles

Cited by

References

    1. Vojta A, Zoldoš V. Adaptation or malignant transformation: the two faces of epigenetically mediated response to stress. Biomed Res Int. 2013 doi: 10.1155/2013/954060. - DOI - PMC - PubMed
    1. Mizushima N, Komatsu M. Autophagy: renovation of cells and tissues. Cell. 2011;147:728–741. doi: 10.1016/j.cell.2011.10.026. - DOI - PubMed
    1. He C, Klionsky DJ. Regulation mechanisms and signaling pathways of autophagy. Annu Rev Genet. 2009;43:67–93. doi: 10.1146/annurev-genet-102808-114910. - DOI - PMC - PubMed
    1. Mancini D, Singh S, Ainsworth P, Rodenhiser D. Constitutively methylated CpG dinucleotides as mutation hot spots in the retinoblastoma gene (RB1) Am J Hum Genet. 1997;61:80–87. doi: 10.1086/513898. - DOI - PMC - PubMed
    1. Cooper DN, Youssoufian H. The CpG dinucleotide and human genetic disease. Hum Genet. 1988;78:151–155. doi: 10.1007/BF00278187. - DOI - PubMed

MeSH terms

LinkOut - more resources