

Freeware tool for analysing numbers and sizes of cell colonies
- PMID: 30673853
- PMCID: PMC6394662
- DOI: 10.1007/s00411-018-00772-z
Freeware tool for analysing numbers and sizes of cell colonies
Abstract
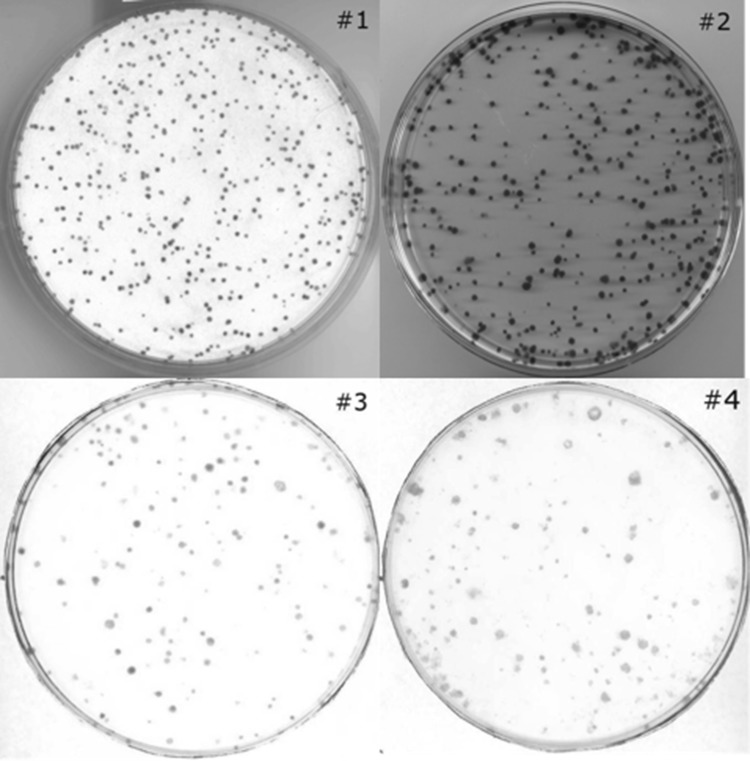
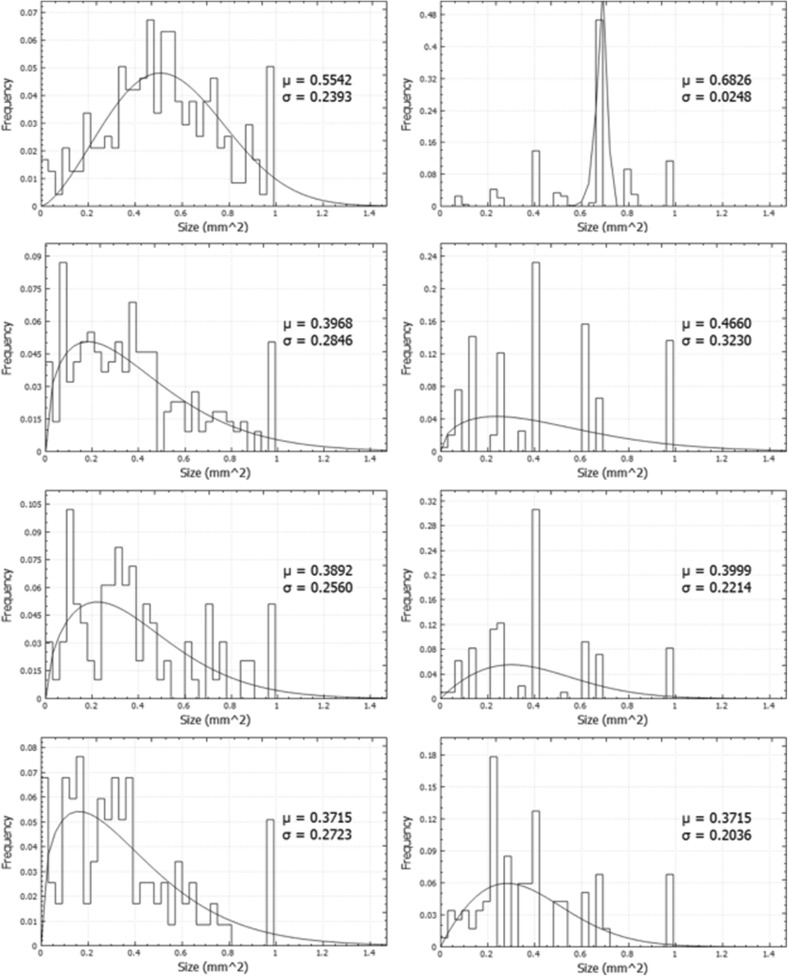
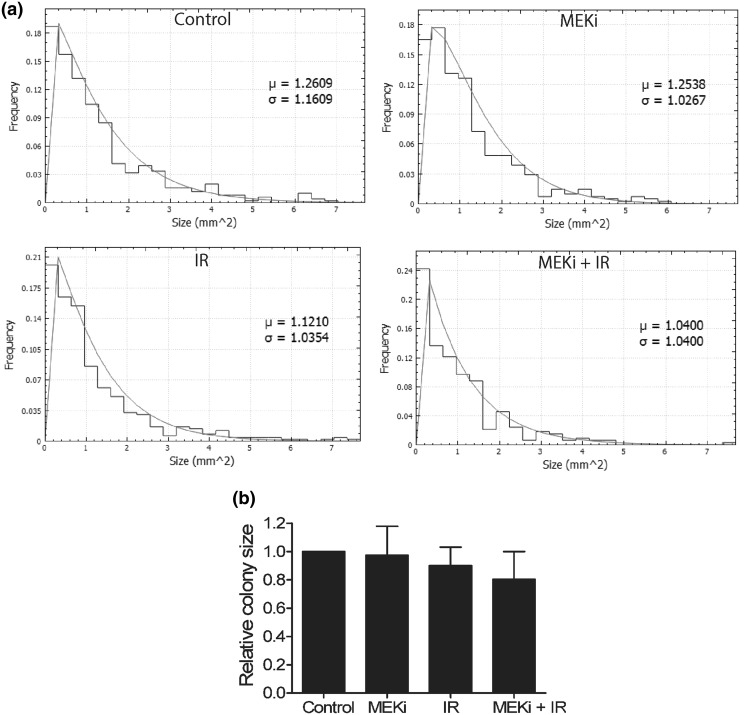
The clonogenic cell survival assay is a basic method to study the cytotoxic effect of radiation and chemical toxins. In large experimental setups, counting of colonies by eye is tiresome and prone to bias. Moreover, it is often interesting to quantify the size of individual colonies. Such analyses are largely facilitated by computerised image analysis systems. Although a number of such systems exist, they all focus on enumerating colonies and not on analysing the colony size. We have developed a new software package for both counting colonies and plotting their size distributions. The software called count and Plot HIstograms of Colony Size (countPHICS) consists of two parts: (1) a macro written for ImageJ which analyses computerised images of cell culture dishes or 6-well plates, counts colonies, estimates their size and saves the results in a text file; (2) a program written with QT Creator which reads the text file, plots histograms of colony size distribution and fits the best function. The full program is freely available at: http://www.fuw.edu.pl/~bbrzozow/FizMed/countPHICS.html . In conclusion, our new publically available software will facilitate colony counting and provide additional information on the colony growth rate, which is relevant especially for radiosensitisation studies.
Keywords: Clonogenic cell survival assay; Colony counter; Colony size histogram; countPHICS.
Conflict of interest statement
The authors declare that they have no conflict of interest.
Figures
Similar articles
-
Cell colony counter called CoCoNut.PLoS One. 2018 Nov 7;13(11):e0205823. doi: 10.1371/journal.pone.0205823. eCollection 2018. PLoS One. 2018. PMID: 30403680 Free PMC article.
-
An objective method to measure cell survival by computer-assisted image processing of numeric images of Petri dishes.Phys Med Biol. 2003 Jun 7;48(11):1551-63. doi: 10.1088/0031-9155/48/11/305. Phys Med Biol. 2003. PMID: 12817937
-
Counting colonies of clonogenic assays by using densitometric software.Radiat Oncol. 2007 Jan 9;2:4. doi: 10.1186/1748-717X-2-4. Radiat Oncol. 2007. PMID: 17212832 Free PMC article.
-
Optimized digital counting colonies of clonogenic assays using ImageJ software and customized macros: comparison with manual counting.Int J Radiat Biol. 2011 Nov;87(11):1135-46. doi: 10.3109/09553002.2011.622033. Int J Radiat Biol. 2011. PMID: 21913819
-
High-Throughput Method for Automated Colony and Cell Counting by Digital Image Analysis Based on Edge Detection.PLoS One. 2016 Feb 5;11(2):e0148469. doi: 10.1371/journal.pone.0148469. eCollection 2016. PLoS One. 2016. PMID: 26848849 Free PMC article.
Cited by
-
Formoterol Exerts Anti-Cancer Effects Modulating Oxidative Stress and Epithelial-Mesenchymal Transition Processes in Cigarette Smoke Extract Exposed Lung Adenocarcinoma Cells.Int J Mol Sci. 2023 Nov 8;24(22):16088. doi: 10.3390/ijms242216088. Int J Mol Sci. 2023. PMID: 38003276 Free PMC article.
-
BKCa channel as a novel regulator of cellular DNA damage response in human bronchial epithelial cells in the presence of particulate matter.Sci Rep. 2025 Jul 2;15(1):22789. doi: 10.1038/s41598-025-03824-9. Sci Rep. 2025. PMID: 40595727 Free PMC article.
-
NB compounds are potent and efficacious FOXM1 inhibitors in high-grade serous ovarian cancer cells.J Ovarian Res. 2024 May 4;17(1):94. doi: 10.1186/s13048-024-01421-4. J Ovarian Res. 2024. PMID: 38704607 Free PMC article.
-
HPV-18E6 Inhibits Interactions between TANC2 and SNX27 in a PBM-Dependent Manner and Promotes Increased Cell Proliferation.J Virol. 2022 Nov 23;96(22):e0136522. doi: 10.1128/jvi.01365-22. Epub 2022 Nov 3. J Virol. 2022. PMID: 36326272 Free PMC article.
-
The Protective Anticancer Effect of Natural Lycopene Supercritical CO2 Watermelon Extracts in Adenocarcinoma Lung Cancer Cells.Antioxidants (Basel). 2022 Jun 11;11(6):1150. doi: 10.3390/antiox11061150. Antioxidants (Basel). 2022. PMID: 35740047 Free PMC article.
References
-
- Beer JZ. Heritable lesions affecting proliferation of irradiated mammalian cells. Adv Radiat Biol. 1979;8:363–417. doi: 10.1016/B978-0-12-035408-5.50013-7. - DOI
Publication types
MeSH terms
LinkOut - more resources
Full Text Sources
