. 2019 Jan 23;11(1):3.
doi: 10.1186/s13073-019-0615-0.

Single-cell analysis reveals congruence between kidney organoids and human fetal kidney

Affiliations

Single-cell analysis reveals congruence between kidney organoids and human fetal kidney

Alexander N Combes et al. Genome Med. .

Abstract

Background: Human kidney organoids hold promise for studying development, disease modelling and drug screening. However, the utility of stem cell-derived kidney tissues will depend on how faithfully these replicate normal fetal development at the level of cellular identity and complexity.

Methods: Here, we present an integrated analysis of single cell datasets from human kidney organoids and human fetal kidney to assess similarities and differences between the component cell types.

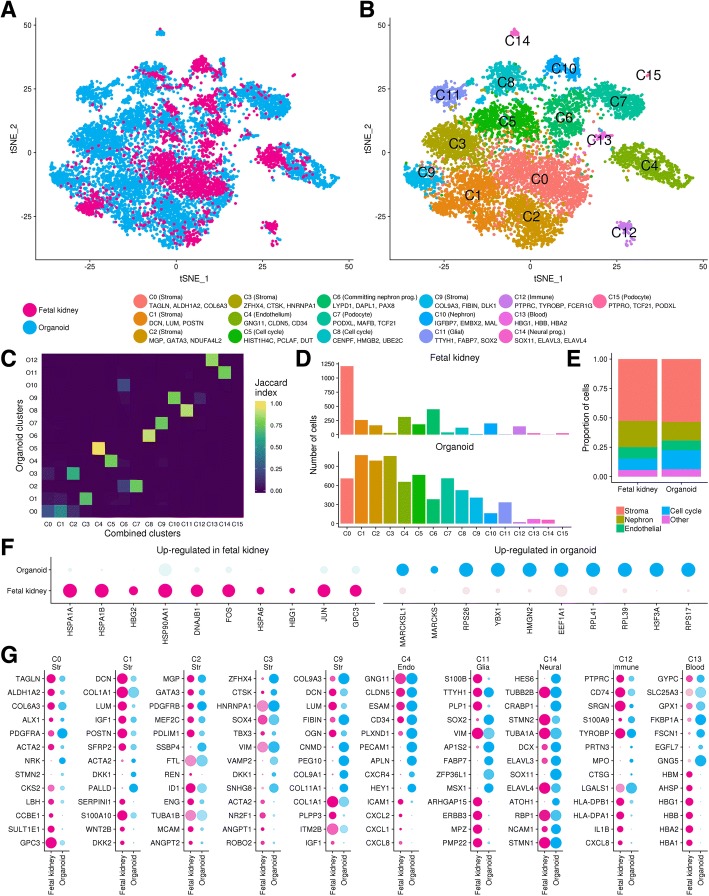
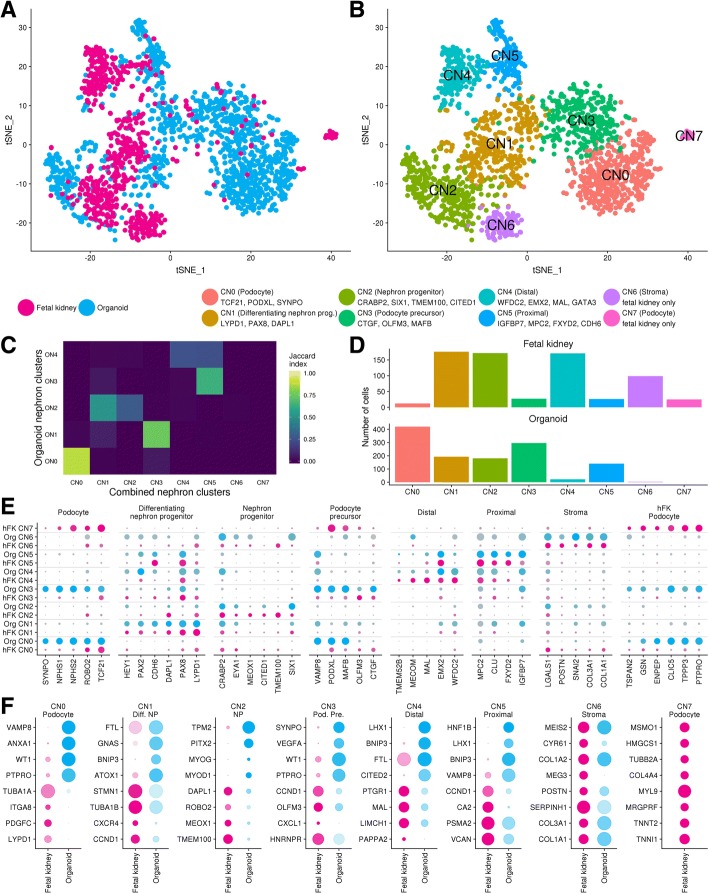
Results: Clusters in the combined dataset contained cells from both organoid and fetal kidney with transcriptional congruence for key stromal, endothelial and nephron cell type-specific markers. Organoid enriched neural, glial and muscle progenitor populations were also evident. Major transcriptional differences between organoid and human tissue were likely related to technical artefacts. Cell type-specific comparisons revealed differences in stromal, endothelial and nephron progenitor cell types including expression of WNT2B in the human fetal kidney stroma.

Conclusions: This study supports the fidelity of kidney organoids as models of the developing kidney and affirms their potential in disease modelling and drug screening.

Keywords: Human kidney organoids; Induced pluripotent cells; Organoids; Single-cell RNA sequencing; Stem cell-derived models.


Conflict of interest statement

Ethics approval and consent to participate

This study includes published, publically available data from consented, anonymized, human fetal tissue, obtained from elective terminations following review of the study by Keck School of Medicine of the University of Southern California’s Institutional Review Board and in accordance with the Declaration of Helsinki [10].

Consent for publication

Not applicable.

Competing interests

M.H.L. has consulted for and received funding from Organovo Holdings. The remaining authors declare that they have no competing interests.

Publisher’s Note

Springer Nature remains neutral with regard to jurisdictional claims in published maps and institutional affiliations.

Figures

Fig. 1
Fig. 1
Single-cell RNA-seq profiling of human kidney organoids reveals expected and off-target populations. a tSNE plot revealing 13 distinct clusters (cluster O0 to cluster O12) identified from largest to smallest population as labelled. Clusters depicted in this figure have been referred to as organoid (O) followed by cluster number. Cluster identity indicated in colour key which includes select marker genes and highest ranking GO term for top 30 genes with positive log fold change values in each cluster. b Re-clustering of organoid nephron lineage cells from clusters O2 and O9 in a results in five nephron sub clusters as labelled. Cluster labels followed by marker genes expressed within the cluster. Clusters from this analysis have been referred to as organoid nephron (ON) followed by the cluster number. c, d Pseudotime trajectory analysis of organoid nephron cells supports a progression from nephron progenitor to podocyte, and proximal and distal nephron end points on different branches. Plot in c coloured by cluster identity in b. Plot in D coloured by Monocle state. e Expression of representative podocyte, nephron progenitor and tubular marker genes across the pseudotime trajectory coloured by Monocle state. f Dot plot representing key cell type marker gene expression within organoid nephron clusters. Dot size indicates proportion of cells in cluster expressing a gene, shading indicates the relative level of expression (low to high reflected as light to dark)
Fig. 2
Fig. 2
Integration and comparison of kidney organoids and human fetal kidney scRNA-seq. a tSNE plot of combined organoid and hFK data coloured by sample type. b tSNE plot revealing 16 ‘combined’ (C) clusters identified from largest to smallest population (C0–C15). Cluster identity and select conserved marker genes shown next to cluster colour key. c Comparison of organoid cell clustering in ‘organoid only’ to ‘combined’ clusters. Overlap in samples between clusters from the different analyses is shown using the Jaccard Index with a score of 1 (yellow) indicating identical clusters and 0 (blue) indicating no cells in common. d Number of cells contributing to each cluster from hFK and organoid samples. e Comparison of general cell type composition between organoid and hFK samples. Stroma includes C0, C1, C2, C3, and C9; nephron includes C6, C7, and C10. f Differentially expressed genes with largest fold changes between all organoid and all hFK cells. g Top conserved markers and differentially expressed genes between datasets for clusters from the ‘combined’ analysis. Cell cycle clusters not displayed. Similar analysis for nephron clusters is presented in Fig. 3
Fig. 3
Fig. 3
Comparison of nephron cell types within kidney organoids and human fetal kidney. a, b Sample of origin and re-clustering of combined nephron (CN) lineage cells results in eight clusters. Cluster identity and select conserved marker genes shown next to cluster colour key. Cells for this analysis were selected from combined clusters C6, C7, C10 and C15. c Comparison of organoid cells between organoid nephron (ON) and combined nephron (CN) clusters. Colours show overlap in cells between clusters according to the Jaccard Index. d Number of cells in each combined nephron cluster by dataset. e Split dot plot showing relative expression for select marker genes within organoid and hFK cells in the combined nephron clusters. hFK data in pink, organoid in blue. Circle size represents the proportion of cells in the cluster expressing that gene, shading indicates expression level (low to high reflected as light to dark). f Top differentially expressed genes between datasets within combined nephron clusters. Chart colouring and shading as per e. Results for CN6 and CN7 are not differential expression results as few (CN6) or no (CN7) organoid cells are present within these clusters. These instead reflect top cluster markers (CN6) or markers enriched in CN7 but not CN0 or CN3. Organoid expression values for CN6 are derived from three organoid cells within this cluster

References

    1. McCauley HA, Wells JM. Pluripotent stem cell-derived organoids: using principles of developmental biology to grow human tissues in a dish. Development. 2017;144(6):958–962. - PMC - PubMed
    1. Takasato M, Er PX, Becroft M, Vanslambrouck JM, Stanley EG, Elefanty AG, et al. Directing human embryonic stem cell differentiation towards a renal lineage generates a self-organizing kidney. Nat Cell Biol. 2014;16(1):118–126. - PubMed
    1. Takasato M, Er PX, Chiu HS, Maier B, Baillie GJ, Ferguson C, et al. Kidney organoids from human iPS cells contain multiple lineages and model human nephrogenesis. Nature. 2015;526(7574):564–568. - PubMed
    1. Freedman BS, Brooks CR, Lam AQ, Fu H, Morizane R, Agrawal V, et al. Modelling kidney disease with CRISPR-mutant kidney organoids derived from human pluripotent epiblast spheroids. Nat Commun. 2015;6:8715. - PMC - PubMed
    1. Morizane R, Lam AQ, Freedman BS, Kishi S, Valerius MT, Bonventre JV. Nephron organoids derived from human pluripotent stem cells model kidney development and injury. Nat Biotechnol. 2015;33(11):1193–1200. - PMC - PubMed

Publication types