. 2019 Jan 24:8:e39304.
doi: 10.7554/eLife.39304.

An ancient germ cell-specific RNA-binding protein protects the germline from cryptic splice site poisoning

Affiliations

An ancient germ cell-specific RNA-binding protein protects the germline from cryptic splice site poisoning

Ingrid Ehrmann et al. Elife. .

Abstract

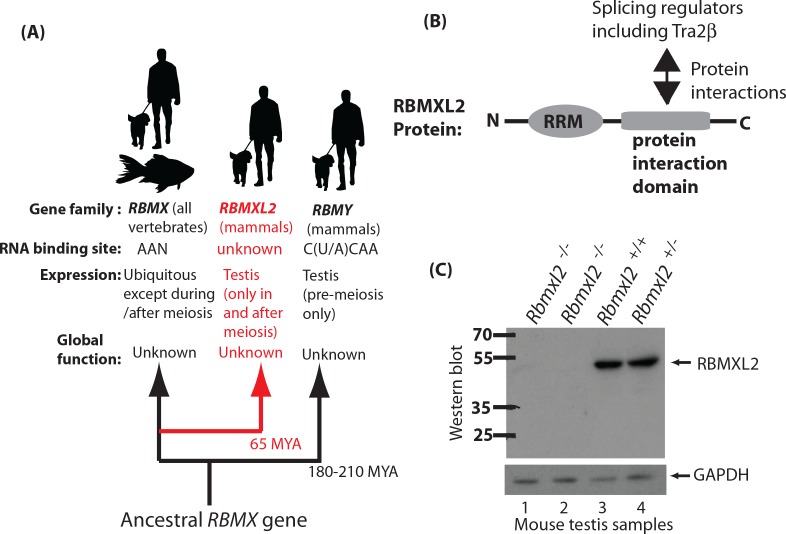
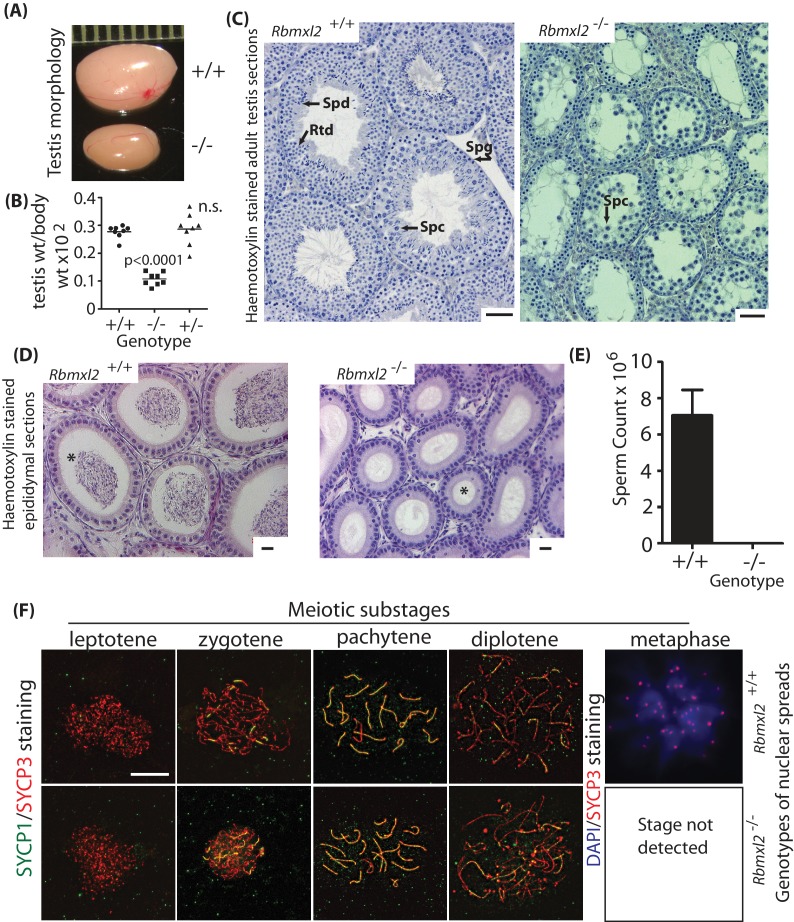
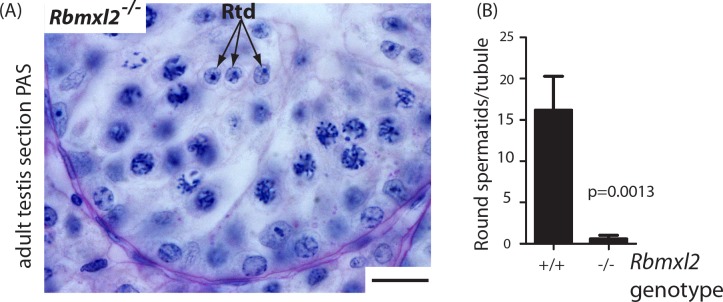
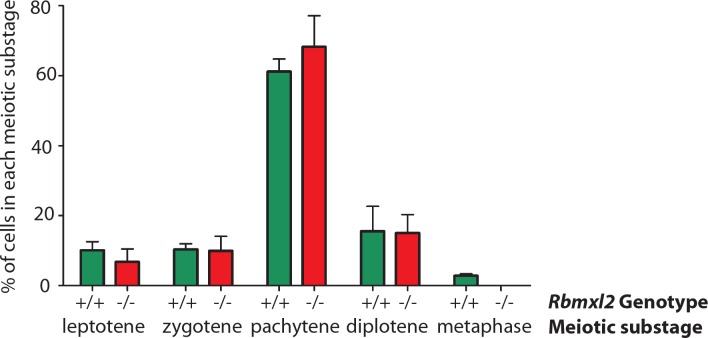
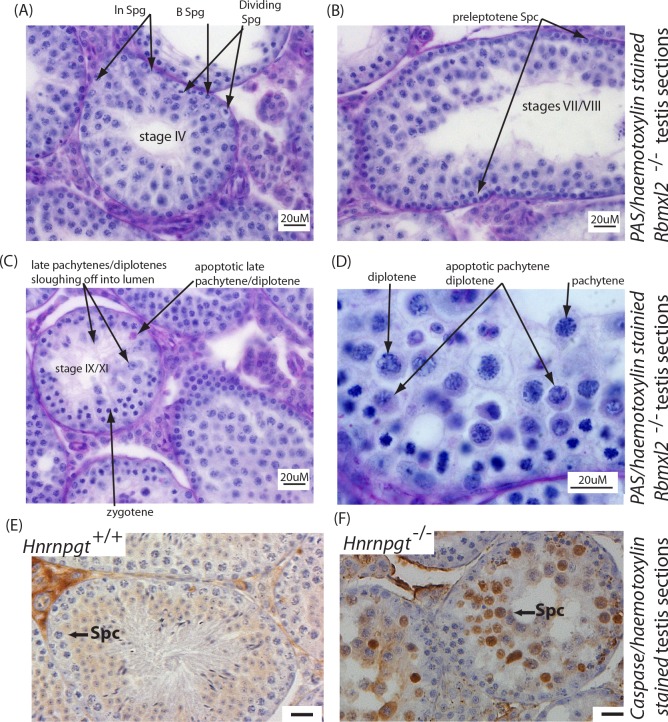
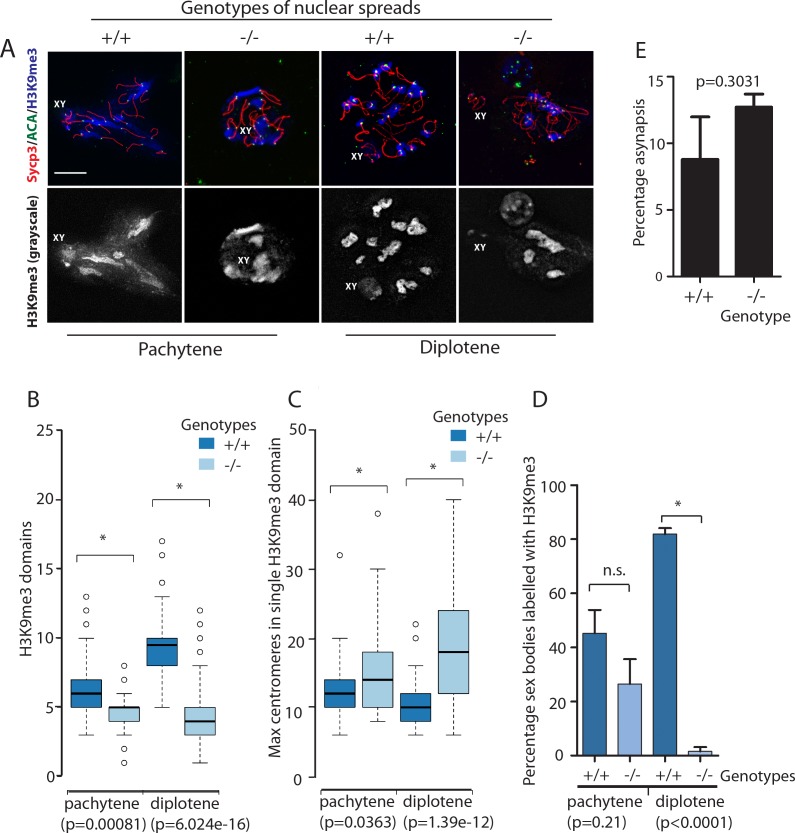
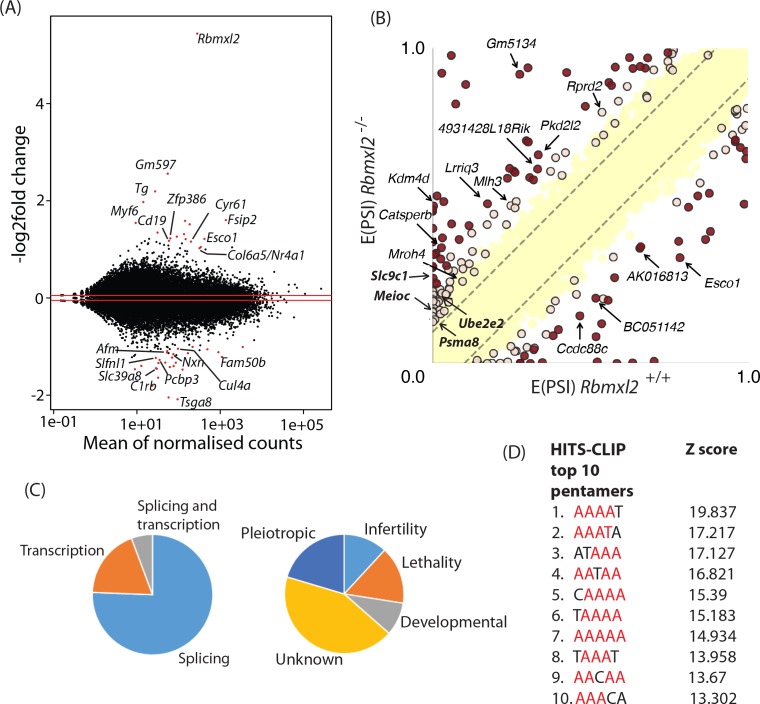
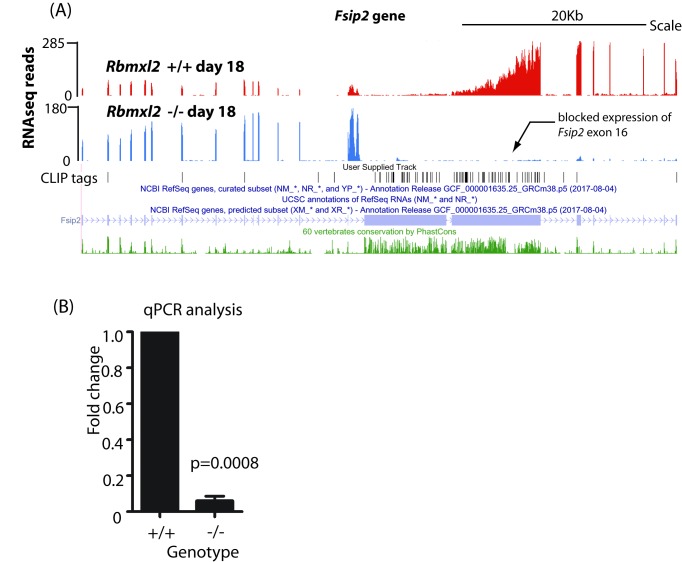
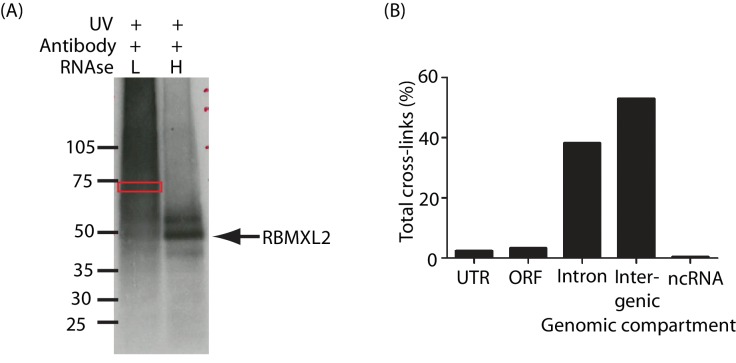
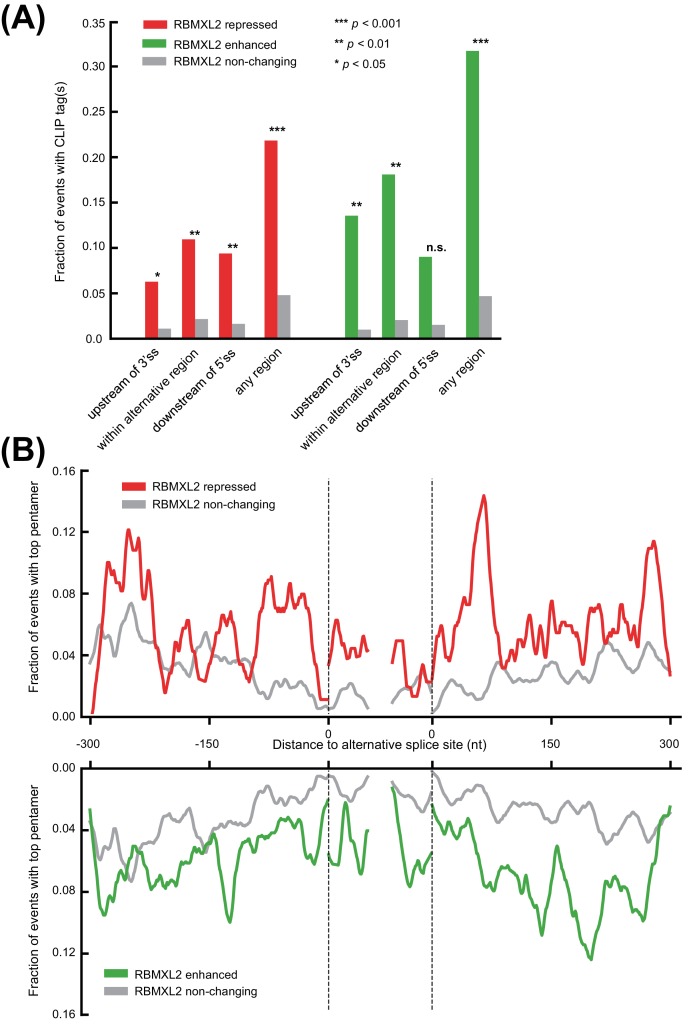
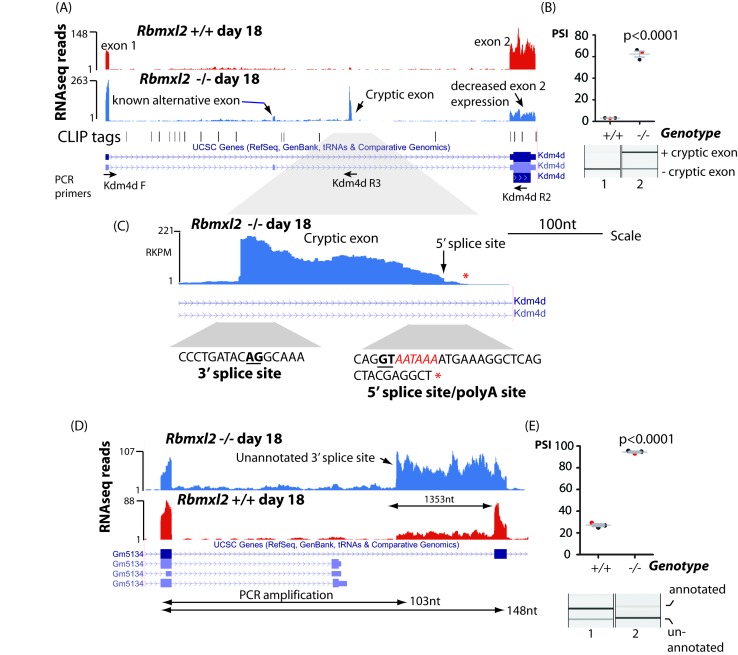
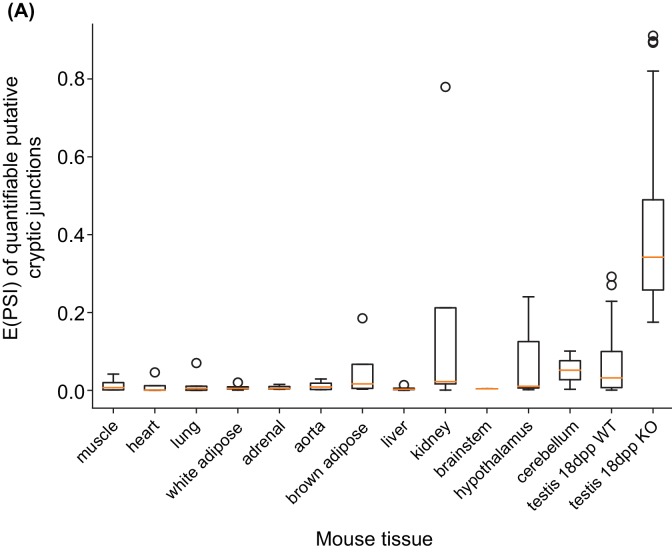
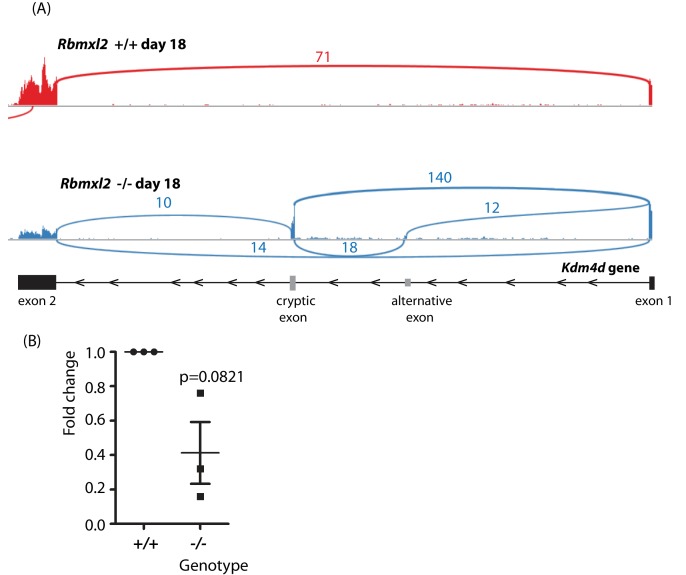
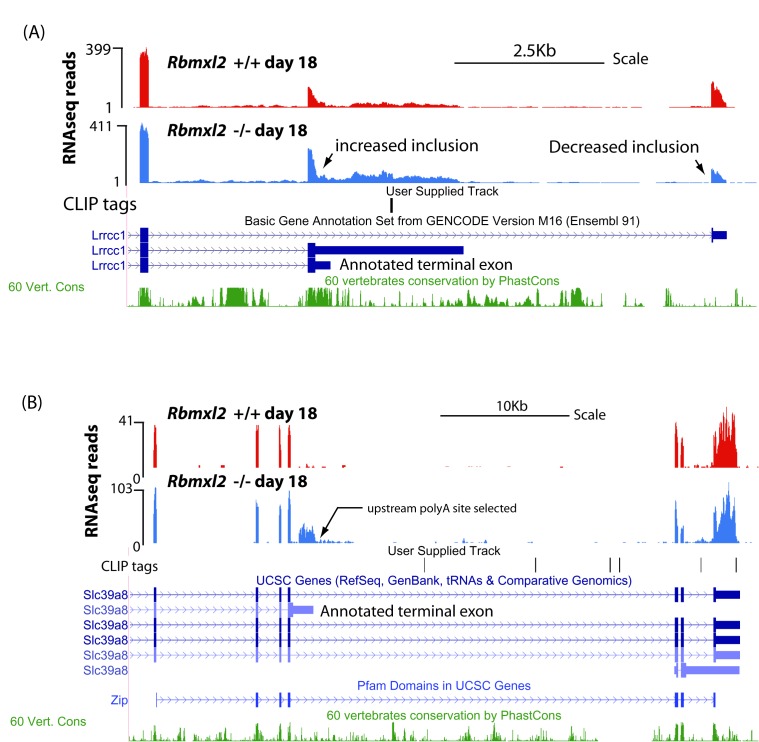
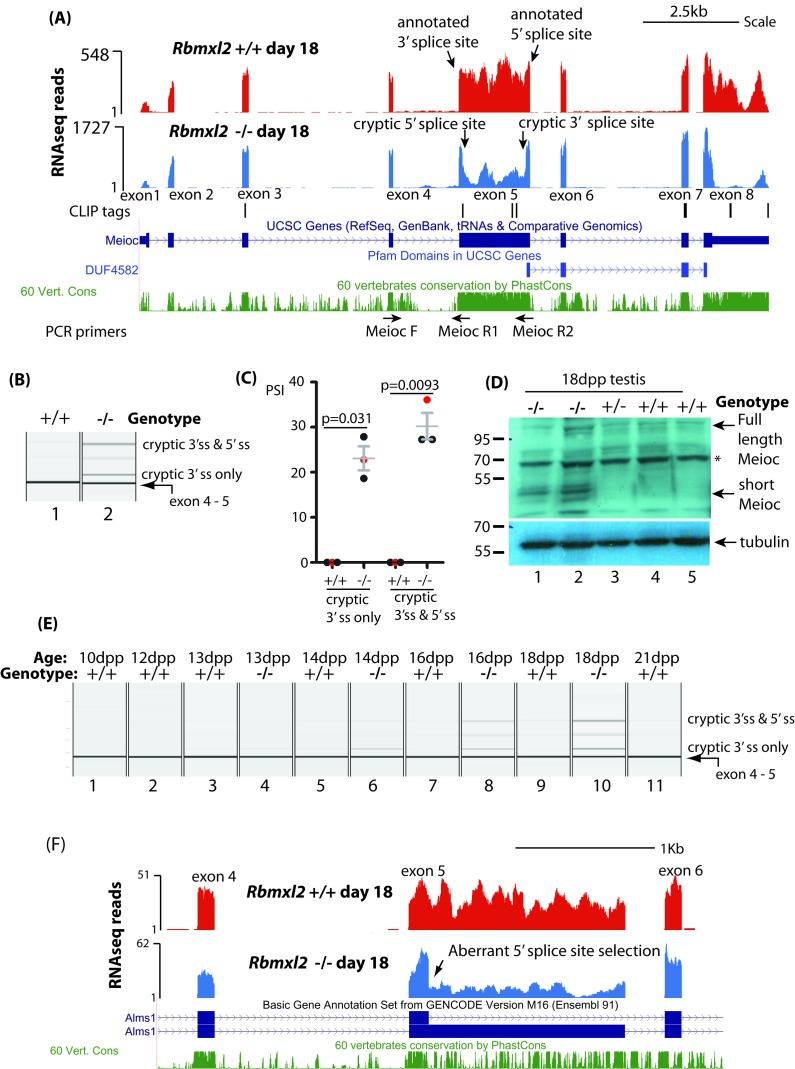
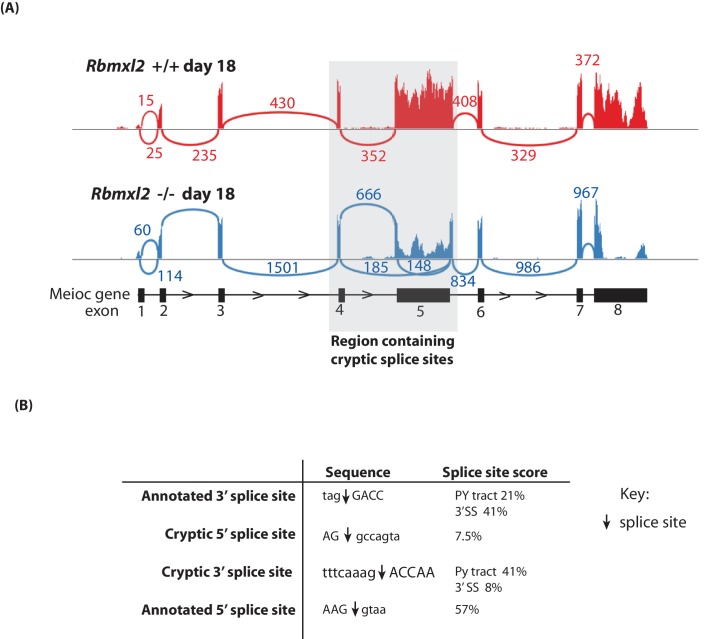
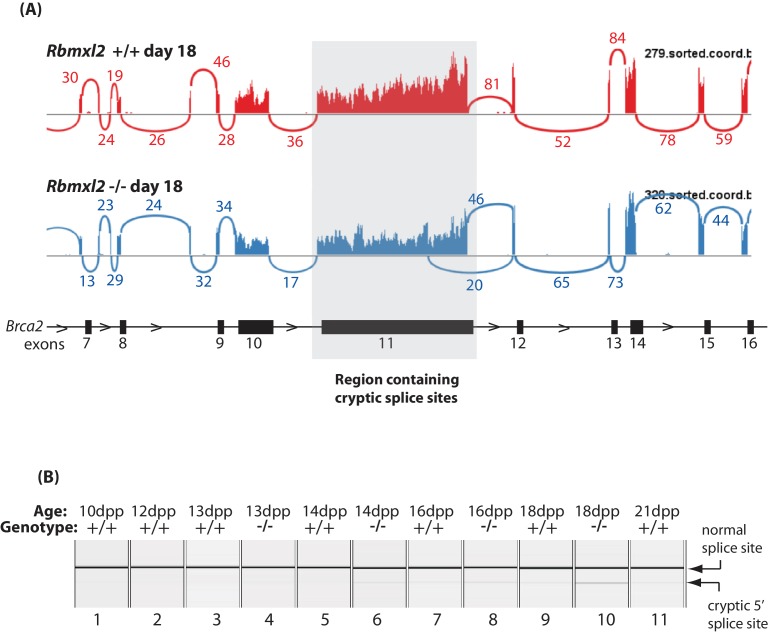
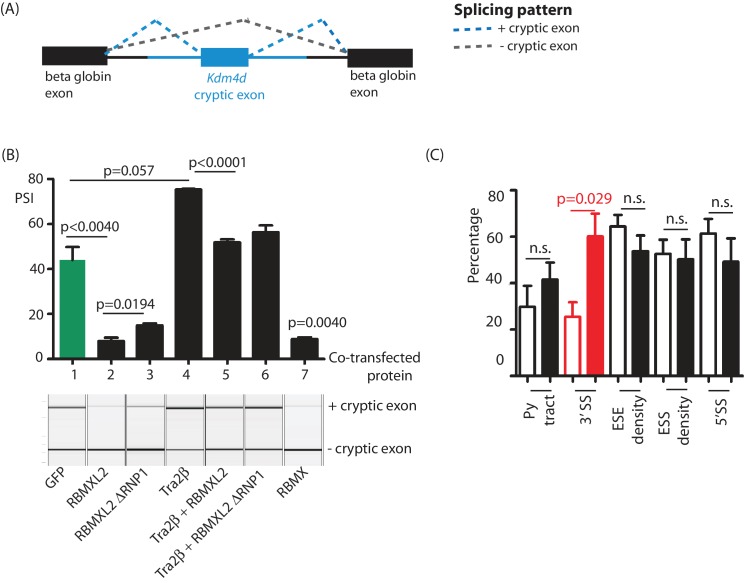
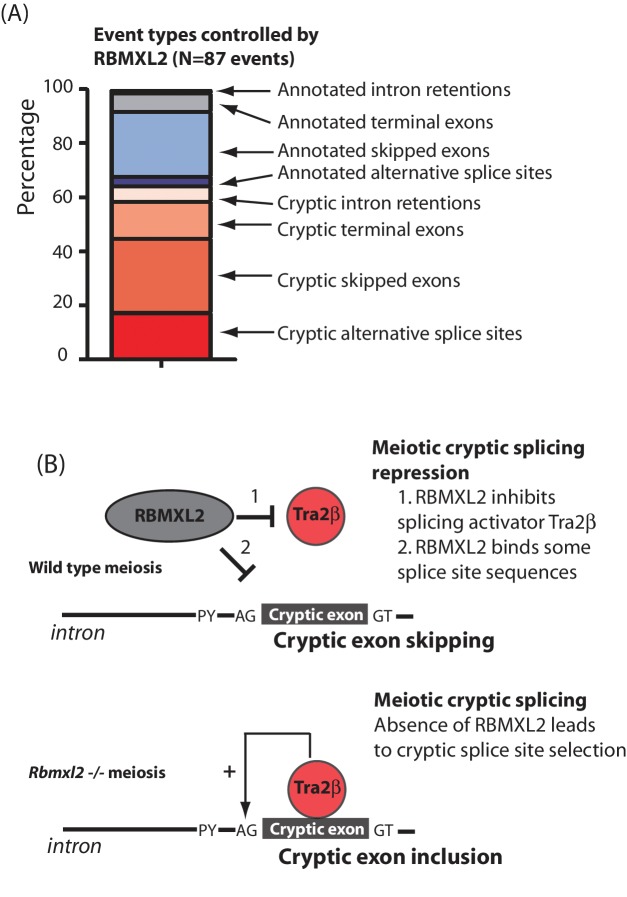
Male germ cells of all placental mammals express an ancient nuclear RNA binding protein of unknown function called RBMXL2. Here we find that deletion of the retrogene encoding RBMXL2 blocks spermatogenesis. Transcriptome analyses of age-matched deletion mice show that RBMXL2 controls splicing patterns during meiosis. In particular, RBMXL2 represses the selection of aberrant splice sites and the insertion of cryptic and premature terminal exons. Our data suggest a Rbmxl2 retrogene has been conserved across mammals as part of a splicing control mechanism that is fundamentally important to germ cell biology. We propose that this mechanism is essential to meiosis because it buffers the high ambient concentrations of splicing activators, thereby preventing poisoning of key transcripts and disruption to gene expression by aberrant splice site selection.

Keywords: RNA; alternative splicing; chromosomes; gene expression; meiosis; mouse; retrogene; spermatogenesis.


Conflict of interest statement

IE, JC, MG, KJ, YL, SG, TC, Dd, JS, SC, IA, YB, DE No competing interests declared

Figures

Figure 1.
Figure 1.. Creation of a mouse model which does not express the testis-specific RNA binding protein RBMXL2.
(A) The RBMXL2 gene evolved via retrotransposition of RBMX early in mammalian evolution. The cladogram shows three members of the gene family that derived from an ancestral RBMX gene, summarising their global functions, expression, and RNA binding sites of their encoded proteins. (B) Modular structure of the RBMXL2 protein, showing the known protein interaction with Tra2β. (C) Western blot confirming no RBMXL2 protein is made within 2 replicate samples of Rbmxl2-/- adult testis, compared to wild type (Rbmxl2+/+) and heterozygous (Rbmxl2+/-) adult testes.
Figure 1—figure supplement 1.
Figure 1—figure supplement 1.. Alignment of RBMXL2 with RBMX and RBMY.
(A) Visualization using MView (Brown et al., 1998) of Clustal Omega (version 1.2.4, [Sievers et al., 2011]) multiple sequence alignment of amino acid sequences of RBMXL2 (sequence 1, Uniprot ID O75526), RBMX (sequence 2, Uniprot ID P38159), and RBMY (sequence 3, Uniprot ID P0DJD3) highlighting overall identity to RBMXL2. The region of the alignment corresponding to the highly similar RRM (93.7% identity to RBMX and 77.2% identity to RBMY) is labelled.
Figure 1—figure supplement 2.
Figure 1—figure supplement 2.. Genomic organisation of different genotype mice.
(A–C) Genomic organisations of the different mouse genotypes were confirmed using Southern blotting (D).
Figure 2.
Figure 2.. RBMXL2 protein is important for mouse germ cells to progress past diplotene into metaphase I of meiosis.
(A) Testis morphologies of adult wild type and homozygous knockout (Rbmxl2-/-) mice (scale above testes shown in millimeters). (B) Testis:body weight ratios of different genotype mice. P values were calculated using a t test. (C) Micrographs of haemotoxylin-stained testis sections from wild type and Rbmxl2-/- mice. Abbreviations: Spg, spermatogonia; Spc, spermatocyte; Rtd, round spermatid; Spd, elongating spermatid. Scale bar = 20 um. (D) Epididymis of wild type and Rbmxl2-/- mice stained with haemotoxylin and eosin. Asterisk indicates lumen (note lumen is empty in Rbmxl2-/- section indicative of azoospermia, but contains multiple cells in the wild type). Scale bar = 20 um. (E) Epididymal sperm counts of wild type and Rbmxl2-/- mice (n = 4 of each genotype). The error bar represents SEM. (F) Meiotic prophase I stages detected in wild type and Rbmxl2-/- testis chromosome spreads stained for SYCP3 (pseudocoloured red) and SYCP1 (pseudocoloured green); and DAPI and SYCP3 (pseudocoloured blue and red respectively). No metaphase I nuclei were identified in the Rbmxl2-/- testes. Quantitative data are provided in Figure 2—figure supplement 2.
Figure 2—figure supplement 1.
Figure 2—figure supplement 1.. Germ cells occasionally progress through meiosis into the round spermatid stage.
(A) Occasional round spermatids were identified in the Rbmxl2-/- background. Rbmxl2-/-testis section stained with Periodic Acid Schiff (PAS). Scale bar = 20 um. (B) Numbers of round spermatids detected per tubule in wild type and Rbmxl2-/- testes at 21 dpp (n = 20 tubules counted at random from either genotype). Error bars represent the SEM, and p value was calculated using a t test.
Figure 2—figure supplement 2.
Figure 2—figure supplement 2.. Graphical analysis of meiotic chromosome spreads.
Percentage of SYCP3-positive meiosis I sub-stages that were detected within wild type and Rbmxl2-/- chromosome spreads. Data counted from N = 179 nuclei from three individual wild type adult testes; and N = 138 nuclei from three individual homozygous Rbmxl2-/- testes.
Figure 2—figure supplement 3.
Figure 2—figure supplement 3.. Detailed histological analysis of Rbmxl2-/- testes.
(A) Section of Rbmxl2-/- testis including a stage IV Rbmxl2-/- seminiferous tubule. This stage IV tubule has no identifiable problems, and is identified by presence of dividing Ln spermatogonia and newly born B spermatogonia. (B) Stage VII/VIII tubule from Rbmxl2-/-mouse. In this tubule the pachytene cells still look normal, recognised by the presence of preleptotene spermatocytes (abbreviated Spc). (C) Stage IX-XI tubule from Rbmxl2-/-mouse showing zygotene cells, but rather few late pachytenes/diplotenes. These latter cells are disappearing because of sloughing off through the lumen and/or apoptosis. (D) Higher magnification image of stage IX-XI tubule from Rbmxl2-/- mouse, showing many apoptotic pachytene/diplotene cells, some of which are indicated by arrows. Wild type and Rbmxl2-/-testis sections were stained with Periodic Acid Schiff (PAS). Abbreviations: Spg, spermatogonia; Spc, spermatocyte. (E–F) Caspase three expression detected by immunohistochemistry on (E) wild type and (F) Rbmxl2-/- testes sections. Scale bar = 20 um.
Figure 2—figure supplement 4.
Figure 2—figure supplement 4.. Organisation of H3K9me3 staining and centromere clusters within wild type and Rbmxl2-/- mice show defects arise during pachytene but become progressively worse by diplotene.
(A) Top panel: images for SCYP3 (red), anti-centromeric antibody (ACA, green), and H3K9me3 (blue). Bottom panel: greyscale images of the H3K9me3 channel alone, enabling the domains to be seen more clearly, and the XY body staining recognised (this is fainter than the staining of pericentromeric heterochromatin). Scale bar = 10 um. (B–C) Box and Whisker plots of (B) heterochromatic domain frequency and (C) centromere clustering from wild type and Rbmxl2-/- mice (pachytene analysis based on 73 nuclei scored from n = 3 wild type mice; and 65 nuclei scored from n = 3 Rbmxl2-/- mice. Diplotene analysis based on 66 nuclei scored from n = 3 wild type mice, and 66 nuclei from n = 3 Rbmxl2-/- mice). (D) Percentage of sex bodies labelled with H3K9me3 (error bar is the standard error of the mean, and statistical significance was calculated using a t test). (E) Percentage asynapsis measured in wild type (n = 108) and Rbmxl2-/- chromosome spreads (n = 92). Pachytene spermatocytes were judged to be those with at least one pair of fully synapsed autosomes, recognised by complete co-localisation of the axial element and transverse filament proteins SYCP3 and SYCP1. Asynapsed pachytene nuclei contain axial elements lacking transverse filament staining co-localisation in combination with fully synapsed autosomes.
Figure 3.
Figure 3.. RBMXL2 protein expression controls splicing patterns of important genes during meiosis.
(A) MAplot showing gene expression levels in 18dpp testis transcriptomes and how they change between wild type and Rbmxl2-/- mice. Genes with more than a 2-fold change in gene expression, and an adjusted p value of less than 0.05 are shown as red dots. All other genes are shown as black dots. This data given in full within Figure 3—source data 1. (B) Scatterplot showing splicing changes between the wild-type and Rbmxl2-/- testis detected by RNA-seq. The scatterplot shows expected percentage of exonic segment inclusion, or E(PSI) for wild-type and Rbmxl2-/- testis detected by RNA-seq using the bioinformatics programme MAJIQ (Vaquero-Garcia et al., 2016). Splicing changes in some genes are named and arrowed. High-confidence splicing changes (P(|ΔPSI| > V)>95%) are marked in dark red for a predicted change of V = 20%, and dark yellow for a predicted change of V = 10%, and are also listed in Figure 3—source data 2 All other quantified splice changes are in yellow (21,280 events examined). Dashed lines indicate ΔPSI of +/- 10%. (C) Left pie chart: Proportions of genes identified by RNAseq analysis to have defects at the splicing and transcriptional levels. Right pie chart: Proportions of phenotypes reported by whole gene knockout annotated for genes detected to have splicing defects in the absence of RBMXL2 protein (Smith et al., 2018) (see also Figure 3—source data 6). (D) The top 10 most frequently recovered pentamers after HITS-CLIP for RBMXL2 in the adult mouse testis (AA dinucleotides are shown in red).
Figure 3—figure supplement 1.
Figure 3—figure supplement 1.. Differential expression of the Fsip2 gene in the Rbmxl2-/- testis.
(A) RNAseq density mapping to the Fsip2 gene, visualised on the UCSC genome browser (Karolchik et al., 2014). (B) Quantitation of fold change from the 3′ end of the Fsip2 gene using qPCR (n = 3).
Figure 3—figure supplement 2.
Figure 3—figure supplement 2.. HITS-CLIP analysis of RBMXL2 in the adult mouse testis.
(A) Autoradiograph showing SDS-PAGE gel of 32P-labelled RNA crosslinked to endogenous RBMXL2 protein from mouse testis during a HITS-CLIP experiment. The area indicated by the red box was excised for further analysis. (B) Genome wide distribution of RBMXL2 HITS-CLIP tags.
Figure 3—figure supplement 3.
Figure 3—figure supplement 3.. RBMXL2 CLIP and motif enrichment around regulated splicing events.
(A) Barchart showing the fraction of RBMXL2 repressed events (red, n = 64); enhanced events (green, n = 22); or nonchanging events (grey, n = 192) that contain RBMXL2 HITS-CLIP tags proximal to alternatively splice regions (intronic regions within 300 nt up or downstream of a regulated junction, within the alternative exonic region, or the union of any of these regions). Significance was assessed by comparing regulated to non-changing events using a two-tailed Fisher’s exact test. (B) Motif map showing the per nucleotide frequency the top RBMXL2 HITS-CLIP defined pentamers (Figure 3D) around regulated and nonchanging events (colours as in (A)). A sliding mean of 20 nts was applied for smoothing. Dashed lines indicate the 3′ss and 5′ss with up to 50 nucleotides of the exonic regions shown.
Figure 4.
Figure 4.. RBMXL2 protein represses splicing inclusion of exons that would compromise gene expression patterns.
(A) Screenshot from the UCSC genome browser (Karolchik et al., 2014) showing high inclusion levels for a novel cryptic exon in the Kdm4d gene in the Rbmxl2-/- testis transcriptome. (B) Experimental confirmation of Kdm4d splicing changes using RT-PCR and capillary gel electrophoresis (lower panel), and data from 3 Rbmxl2-/- and 3 wild type 18dpp mouse testes. Individual samples shown in the capillary gel electrophoretogram are indicated as red dots. The mean PSI is shown as a grey bar with SEM as error bar. The p value was calculated using a t test. (C) Higher resolution screenshot (Karolchik et al., 2014) of the Rbmxl2-/- testis transcriptome showing RNAseq read density in the genomic region of the Kdm4d cryptic exon. The position of the cryptic 5′ splice site is indicated by a red arrow. Splice junction sequences are shown underneath with the consensus polyadenylation site AATAAA in red. Some RNAseq reads terminate downstream of the Kdm4d cryptic exon 5′ splice site. The final RNAseq read coverage detected downstream of this exon is shown as a red asterix. (D) UCSC genome browser screenshot (Karolchik et al., 2014) showing increased splicing selection of an cryptic 3′ splice site within the Gm5134 mRNA in the Rbmxl2-/- testis transcriptome. (E) Chart showing experimental confirmation of the splicing switch in the Gm5134 gene in 3 Rbmxl2-/- and 3 wild type 18dpp mouse testes. The individual samples shown in the capillary gel electrophoretogram are shown in the chart as red dots.
Figure 4—figure supplement 1.
Figure 4—figure supplement 1.. Distribution of putative cryptic splice sites across a panel of mouse tissue samples.
(A) Boxplots showing the distribution of E(PSI) values for the putative cryptic splice junctions identified in 18 dpp Rbmxl2-/- KO testis across a panel of mouse tissue samples. The first twelve mouse tissues contain eight samples each (Zhang et al., 2014) and the testes samples are from this study. Not all events were deemed quantifiable in these tissues, likely due to tissue-restricted gene expression. The following number of junctions were assessed in non-testes tissues: muscle 12; heart 12; lung 21; white adipose 14; adrenal 12; aorta 11; brown adipose 18; liver 11; kidney 14; brainstem 8; hypothalamus 18; cerebellum 20.
Figure 4—figure supplement 2.
Figure 4—figure supplement 2.. (A) Sashimi plots of Kdm4d gene in the Rbmxl2-/- and Rbmxl2 +/+ mice.
(B) qPCR analysis of Kdm4d exon two expression levels in Rbmxl2-/- and Rbmxl2 +/+ testes.
Figure 4—figure supplement 3.
Figure 4—figure supplement 3.. Examples of genes that select upstream terminal exons in the Rbmxl2 -/- testis.
(A) UCSC screenshot (Karolchik et al., 2014) showing an annotated terminal exon within the Lrrcc1 gene that is activated in the Rbmxl2-/- testis (notice decreased utilisation of downstream terminal exon in the wild type mouse). (B) UCSC screenshot (Karolchik et al., 2014) showing selection of an annotated terminal exon in the Slc39a8 gene in representative wild type and Rbmxl2-/- testes, use of which is predicted to disrupt a known Pfam domain.
Figure 5.
Figure 5.. RBMXL2 protein is important to prevent splicing of long exons becoming disrupted during meiosis.
(A) Screenshot from the UCSC genome browser (Karolchik et al., 2014) showing splicing pattern of Meioc exon five in wild type and Rbmxl2-/- testis. RNAseq read density from Rbmxl2-/- testis are shown in blue; RNAseq read density from wild type testis in red; the genomic positions of HITS-CLIP tags are mapped underneath. Splice sites for exon five are arrowed, and the binding sites for RT-PCR primers are shown. (B) Representative capillary gel electrophoretogram showing RT-PCR validation of the changing Meioc splicing pattern. This RT-PCR analysis used three primers in multiplex (MeiocF- MeiocR1 detects splicing of exon 4 to exon 5, and MeiocF-MeiocR2 detects splicing from exon four to the cryptic 3′ splice site within exon 5, or splicing of exon 4 to exon five after complete exitron removal. Detection of full length Meioc exon five inclusion by this latter primer combination is precluded by the large size of the amplicon. (C) Chart showing percentage splicing inclusion (PSI) of different splice variants of Meioc exon 5. PSI data were generated by RT-PCR from three wild type (WT) and 3 Rbmxl2-/- mice, with the individual samples shown in the capillary gel electrophoretogram in part (B) indicated as red dots. Error bars represent the SEM, and p values were calculated using t tests. (D) Western blot of 18dpp mouse testes protein probed with an antibody specific to Meioc protein (Abby et al., 2016). A non-specific protein that was also detected in mouse spleen as well as 18dpp testis is indicated by an asterisk. (E) Capillary gel electrophoretogram showing patterns of Meioc exon 5 splicing between 10dpp and 21dpp in the first wave of mouse spermatogenesis. (F) UCSC screenshot (Karolchik et al., 2014) showing that splicing of Alms1 exon five is disrupted in Rbmxl2-/- testes via selection of an internal 5′ splice site.
Figure 5—figure supplement 1.
Figure 5—figure supplement 1.. Further splicing analysis of the Meioc gene.
(A) Sashimi plot showing exon junction reads across the Meioc gene. (B) Strengths of splice sites associated with Meioc exon 5. The actual splice sites are indicated in the sequences by downward facing arrows. Average annotated and cryptic splice site strengths were calculated using Sroogle (Schwartz et al., 2009).
Figure 5—figure supplement 2.
Figure 5—figure supplement 2.. Further splicing analysis of the Meioc gene.
(A) Sashimi plot showing exon junction reads across the Brca2 gene. (B) Capillary gel electrophoretogram showing patterns of Brca2 splicing between 10dpp and 21dpp in the first wave of mouse spermatogenesis.
Figure 6.
Figure 6.. Ectopic expression of RBMXL2 protein represses cryptic exon splicing in vitro.
(A) Schematic of the Kdm4d minigene, in which the Kdm4d cryptic exon and flanking introns (shown in blue) are inserted between two beta globin exons in the vector pXJ41 (Bourgeois et al., 1999). (B) Bar chart (upper panel) showing data from biological triplicate experiments after quantitation using capillary gel electrophoresis (n = 3 for each transfection). Capillary gel electrophoretogram (lower panel) showing splicing patterns in HEK293 cells. The minigene containing the Kdm4d cryptic exon and flanking intron sequences were transfected with expression plasmids encoding either GFP, RBMXL2, RBMXL2 ΔRNP1, Tra2β, RBMX or combinations of these. Splicing patterns were analysed using RT-PCR. (C) Bar chart showing average annotated and cryptic splice site strengths from a panel of internal cryptic exons that were activated in Rbmxl2-/- testes. Splice site strengths were quantitated as a percentile of the average value for an alternative exon using Sroogle (Schwartz et al., 2009). Open bars show percentile values for cryptic exons, shaded bars (black or red) show percentile values for downstream exons. Error bars represent the SEM, and p values were calculated using t tests.
Figure 7.
Figure 7.. RBMXL2 protein is needed to enable production of proper splice isoform patterns during meiosis.
(A) Stacked bar chart summarising percentage types of splicing event mis-regulated in the Rbmxl2-/- testes. Details of the individual genes contributing to this list are given in Figure 3—source data 3. (B) Models for RBMXL2 function. In wild type mice, RBMXL2 protein may block cryptic exon splicing through: 1. Inhibition of splicing regulator proteins including Tra2β protein via protein-protein interactions (Venables et al., 2000); or 2. Direct RNA protein interactions of RBMXL2 with important splicing regulatory sequences in the pre-mRNA. In the Rbmxl2-/- background the absence of this buffering would result in an increase in splicing inclusion of some cryptic exons which contain Tra2β binding sites.

References

    1. Abby E, Tourpin S, Ribeiro J, Daniel K, Messiaen S, Moison D, Guerquin J, Gaillard JC, Armengaud J, Langa F, Toth A, Martini E, Livera G. Implementation of meiosis prophase I programme requires a conserved retinoid-independent stabilizer of meiotic transcripts. Nature Communications. 2016;7:10324. doi: 10.1038/ncomms10324. - DOI - PMC - PubMed
    1. Adamson B, Smogorzewska A, Sigoillot FD, King RW, Elledge SJ. A genome-wide homologous recombination screen identifies the RNA-binding protein RBMX as a component of the DNA-damage response. Nature Cell Biology. 2012;14:318–328. doi: 10.1038/ncb2426. - DOI - PMC - PubMed
    1. Anders S, Huber W. Differential expression analysis for sequence count data. Genome Biology. 2010;11:R106. doi: 10.1186/gb-2010-11-10-r106. - DOI - PMC - PubMed
    1. Arsov T, Silva DG, O'Bryan MK, Sainsbury A, Lee NJ, Kennedy C, Manji SS, Nelms K, Liu C, Vinuesa CG, de Kretser DM, Goodnow CC, Petrovsky N. Fat aussie--a new Alström syndrome mouse showing a critical role for ALMS1 in obesity, diabetes, and spermatogenesis. Molecular Endocrinology. 2006;20:1610–1622. doi: 10.1210/me.2005-0494. - DOI - PubMed
    1. Bellvé AR, Cavicchia JC, Millette CF, O'Brien DA, Bhatnagar YM, Dym M. Spermatogenic cells of the prepuberal mouse. Isolation and morphological characterization. The Journal of Cell Biology. 1977;74:68–85. doi: 10.1083/jcb.74.1.68. - DOI - PMC - PubMed

Publication types