An official website of the United States government
The .gov means it’s official.
Federal government websites often end in .gov or .mil. Before
sharing sensitive information, make sure you’re on a federal
government site.
The site is secure.
The https:// ensures that you are connecting to the
official website and that any information you provide is encrypted
and transmitted securely.
1 Masonic Cancer Center, Department of Pediatrics, and Center for Genome Engineering, University of Minnesota, Minneapolis, Minnesota.
2 Cancer Research UK, Cambridge Institute, University of Cambridge, Cambridge, England, United Kingdom.
3 Department of Biomedical Engineering, University of Minnesota, Minneapolis, Minnesota.
4 Department of Molecular and Cellular Biology, University of California, Berkeley, Berkeley, California.
5 Department of Bioengineering, California Institute of Technology, Pasadena, California.
6 Tumor Initiation and Maintenance Program, NCI-Designated Cancer Center, Sanford Burnham Prebys Medical Discovery Institute, La Jolla, California.
7 Department of Pathology, Brigham and Women's Hospital, Harvard Medical School, Boston, Massachusetts.
8 Department of Pediatric Neuro-Oncogenomics, German Cancer Research Center (DKFZ) and German Cancer Consortium (DKTK), Heidelberg, Germany.
9 Department of Pediatric Oncology, Hematology, and Clinical Immunology, Medical Faculty, University Hospital Düsseldorf, Düsseldorf, Germany.
10 Division of Neurosurgery, Arthur and Sonia Labatt Brain Tumor Research Center, The Hospital for Sick Children, Toronto, Ontario, Canada.
11 Division of Neuropathology, Johns Hopkins Hospital, Baltimore, Maryland.
12 McArdle Laboratory for Cancer Research, University of Wisconsin-Madison, Madison, Wisconsin.
13 Department of Biochemistry, Molecular Biology, and Biophysics, University of Minnesota, Minneapolis, Minnesota.
14 Department of Laboratory Medicine and Pathology, University of Minnesota, Minneapolis, Minnesota.
15 Department of Clinical Sciences, College of Medicine, Florida State University, Sarasota, Florida.
16 Department of Pathology, Ophthalmology and Oncology, The Johns Hopkins University School of Medicine, Baltimore, Maryland.
17 Department of Laboratory Medicine and Pathology, Mayo Clinic and Foundation, 200 First Street Southwest, Rochester, Minnesota.
18 Division of Hematology, The Hospital for Sick Children, Toronto, Ontario, Canada.
19 Masonic Cancer Center, Department of Pediatrics, and Center for Genome Engineering, University of Minnesota, Minneapolis, Minnesota. larga002@umn.edu.
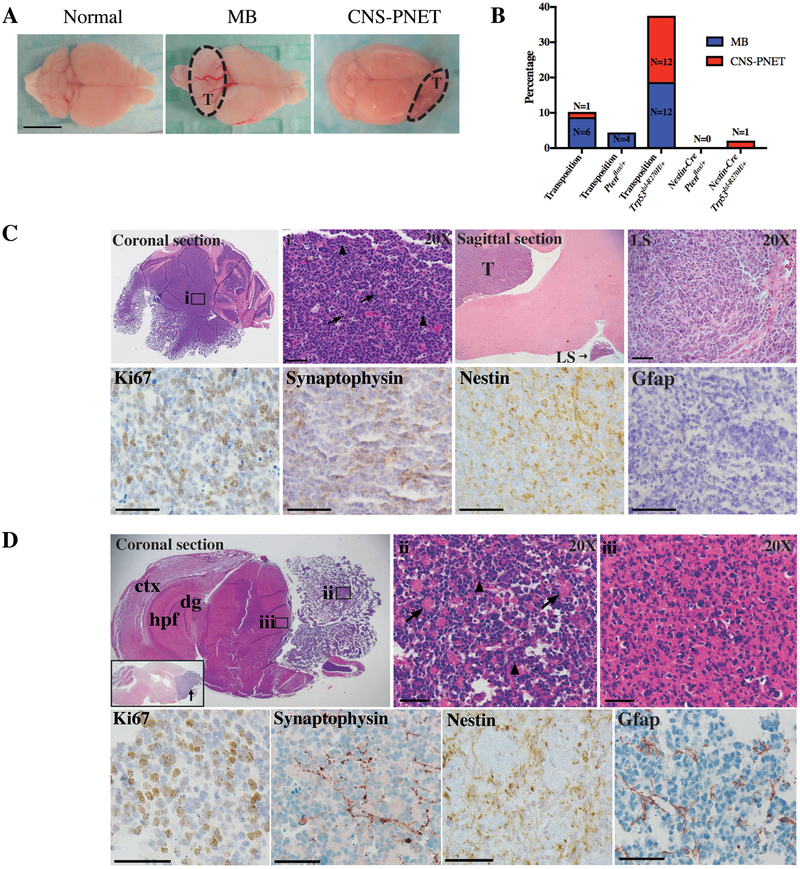
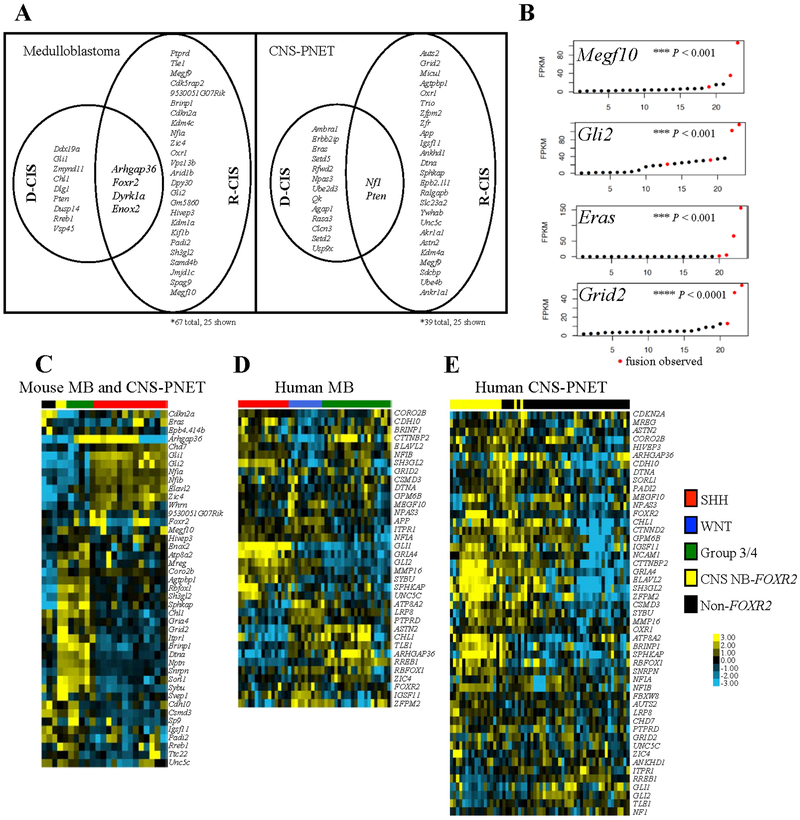
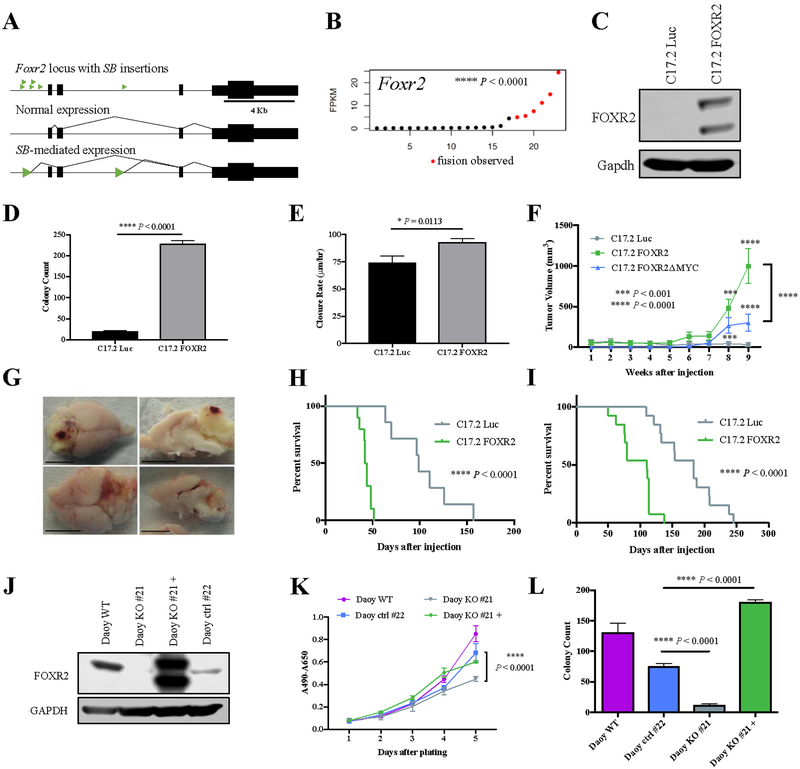
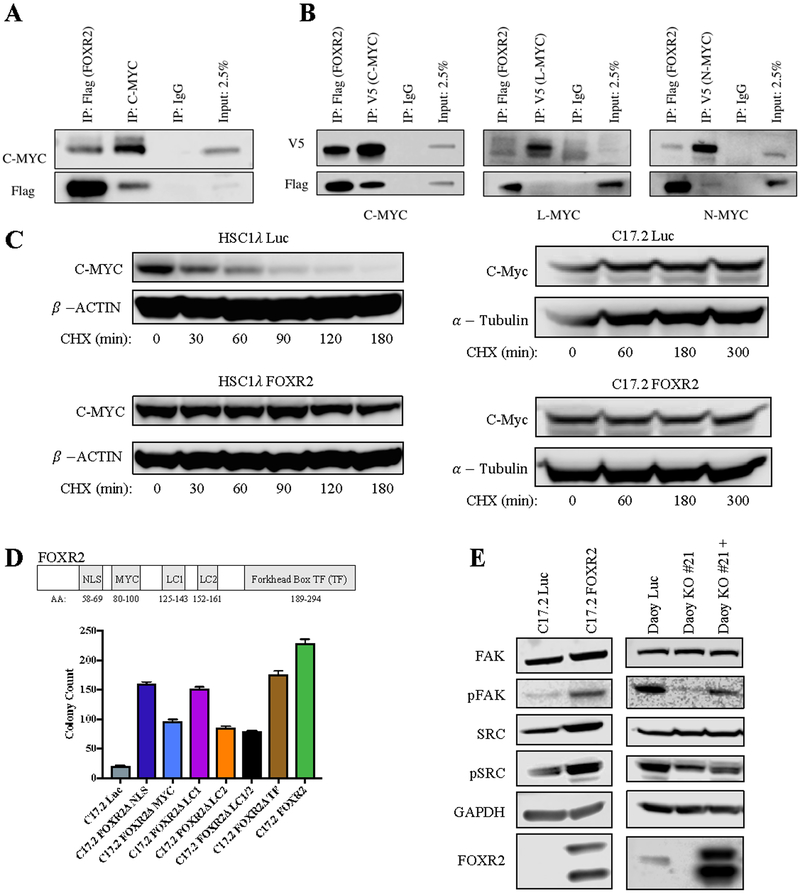
Medulloblastoma and central nervous system primitive neuroectodermal tumors (CNS-PNET) are aggressive, poorly differentiated brain tumors with limited effective therapies. Using Sleeping Beauty (SB) transposon mutagenesis, we identified novel genetic drivers of medulloblastoma and CNS-PNET. Cross-species gene expression analyses classified SB-driven tumors into distinct medulloblastoma and CNS-PNET subgroups, indicating they resemble human Sonic hedgehog and group 3 and 4 medulloblastoma and CNS neuroblastoma with FOXR2 activation. This represents the first genetically induced mouse model of CNS-PNET and a rare model of group 3 and 4 medulloblastoma. We identified several putative proto-oncogenes including Arhgap36, Megf10, and Foxr2. Genetic manipulation of these genes demonstrated a robust impact on tumorigenesis in vitro and in vivo. We also determined that FOXR2 interacts with N-MYC, increases C-MYC protein stability, and activates FAK/SRC signaling. Altogether, our study identified several promising therapeutic targets in medulloblastoma and CNS-PNET. SIGNIFICANCE: A transposon-induced mouse model identifies several novel genetic drivers and potential therapeutic targets in medulloblastoma and CNS-PNET.
Disclosures: DAL is the co-founder and co-owner of several biotechnology companies including NeoClone Biotechnologies, Inc., Discovery Genomics, Inc. (recently acquired by Immunsoft, Inc.), and B-MoGen Biotechnologies, Inc. He consults for Surrogen, Inc. Genentech, Inc. is funding some of his research. The business of all these companies is unrelated to the contents of this manuscript. Other authors have no conflicts of interest.
Figures
Figure 1.
SB -induced medulloblastoma and CNS-PNET…
Figure 1.
SB -induced medulloblastoma and CNS-PNET resemble human tumors. A, Macroscopic images of normal…
Figure 1.
SB-induced medulloblastoma and CNS-PNET resemble human tumors. A, Macroscopic images of normal brain and brains with SB-induced cerebellar medulloblastoma and CNS-PNET in the cerebral cortex and olfactory bulbs. T=tumor. B, Medulloblastoma and CNS-PNET frequency across genetic backgrounds. C, Upper panels: medulloblastoma H&E. i, Rosettes (arrows), mitotic nuclei (arrowheads). Primary medulloblastoma (T) with leptomeningeal spread (LS). Lower panels: medulloblastoma IHC. D, Upper panels: CNS-PNET H&E. Cerebral cortex (ctx), hippocampal formation (hpf), dentate gyrus (dg). Inset: CNS-PNET sagittal section, olfactory bulb (arrow). ii, Bulk tumor with rosette formations (arrows) and mitotic nuclei (arrowheads). iii, Tumor cell parenchyma infiltration. Lower panels: CNS-PNET IHC. Scale bars = 50 μm.
Figure 2.
SB -induced tumors resemble human…
Figure 2.
SB -induced tumors resemble human medulloblastoma and CNS-PNET transcriptionally. A , Hierarchical clustering…
Figure 2.
SB-induced tumors resemble human medulloblastoma and CNS-PNET transcriptionally. A, Hierarchical clustering of medulloblastoma transcription profiles(6). Red and green boxes denote transcripts in SHH and group 3/4, respectively (P-value <0.002, Fisher’s Exact Test (FET)). SHH, WNT, and group 3/4 designation indicated with red, black, and green toebars, respectively. B, Hierarchical clustering of CNS-PNET transcription profiles(6). Blue boxes denote transcripts in CNS NB-FOXR2 (P-value <1.0e-8, FET). CNS NB-FOXR2 and non-FOXR2 CNS-PNET designation are shown with blue and black toebars, respectively. Log-transformed and mean-centered data with variance >0.5 for murine RNA-Seq datasets and >2.0 for human array datasets were clustered using average linkage clustering. Clusters systematically identified with node correlation >0.2.
Figure 3.
CIS gene identification and expression…
Figure 3.
CIS gene identification and expression analysis in mouse and human tumors. A ,…
Figure 3.
CIS gene identification and expression analysis in mouse and human tumors. A, Medulloblastoma (MB) and CNS-PNET CIS genes. B, RNA-Seq expression levels in SB-induced tumors (Student t test, two-tailed). C-E, Expression of CIS genes with highest variability in mouse tumors(C), human medulloblastoma(5)(D), and human CNS-PNET(5)(E). Log-transformed and mean-centered data with variance >1.0 were clustered using average linkage clustering. Multiple human probes corresponding to CIS were averaged to obtain a single value.
Figure 4.
Increased Arhgap36 expression is associated…
Figure 4.
Increased Arhgap36 expression is associated with medulloblastoma. A , Arhgap36 locus with transposon…
Figure 4.
Increased Arhgap36 expression is associated with medulloblastoma. A, Arhgap36 locus with transposon insertions (green arrowheads). B, Arhgap36 expression by RNA-Seq in SB-induced medulloblastomas (Student t test, two-tailed). C, Arhgap36 IHC in SB-induced medulloblastoma. Primary tumor (*), leptomeningeal spread (arrowhead). Nuclear expression in control tumor (arrow) compared to normal granule neural cells (inset). D, Combined TMAs analyzed for ARHGAP36 by IHC. E, ARHGAP36 positivity by IHC across subgrouped Johns Hopkins TMA. F, Kaplan-Meier analysis of patients from Johns Hopkins TMA (Log rank Mantel-Cox test). Scale bars = 50mm.
Figure 5.
ARHGAP36 and Megf10 promote tumorigenesis. …
Figure 5.
ARHGAP36 and Megf10 promote tumorigenesis. A , Soft agar assay comparing C17.2 Luc…
Figure 5.
ARHGAP36 and Megf10 promote tumorigenesis. A, Soft agar assay comparing C17.2 Luc and C17.2 ARHGAP36 (Student t test, two-tailed). B, Flank tumor volume of NU/J mice injected with C17.2 Luc or C17.2 ARHGAP36 (N=5, Sidak’s multiple comparisons test). C, Survival of NU/J mice injected intracranially with C17.2 Luc or C17.2 ARHGAP36 (N=7, Log rank Mantel-Cox test). D, IHC showing cerebellar and cerebral location of GFP+ C17.2 Luc or C17.2 ARHGAP36 injected into NU/J mice. E, Tritiated thymidine (3H-Td) incorporation assay in transduced GNPs (N=3, Benjamini, Krieger, and Yekutieli multiple comparisons test). F, Upper panel: qRT-PCR for Gli1 in C17.2 Luc and C17.2 ARHGAP36 (Sidak’s multiple comparison’s test). Gli1 expression is normalized to Gapdh. Lower panel: RNA-Seq of SB-induced medulloblastomas showing expression of indicated genes. G, MTS assay of C17.2 Luc and C17.2 Megf10 (Sidak’s multiple comparisons test). H, Soft agar assay of C17.2 Luc and C17.2 Megf10 (Student t test, two-tailed). I, Flank tumor volume of NU/J mice injected with C17.2 Luc (N=7) or C17.2 Megf10 (N=8)(Sidak’s multiple comparisons test). Error bars, SEM. Scale bars = 100mm.
Figure 6.
FOXR2 promotes transformation in human…
Figure 6.
FOXR2 promotes transformation in human and mouse cells. A , Transposon insertions (green…
Figure 6.
FOXR2 promotes transformation in human and mouse cells. A, Transposon insertions (green arrowheads) in the Foxr2 locus. B, Foxr2 expression by RNA-Seq in SB-induced medulloblastoma (Student t test, two-tailed). C, Western blot showing FOXR2 expression in C17.2 Luc and C17.2 FOXR2. D, Soft agar assay comparing C17.2 Luc and C17.2 FOXR2 (Student t test, two-tailed). E, Wound closure rate of C17.2 Luc (N=14) and C17.2 FOXR2 (N=15)(Student t test, two-tailed). F, Flank tumor volume of NU/J mice injected with C17.2 Luc (N=7), C17.2 FOXR2ΔMYC (N=6) or C17.2 FOXR2 (N=8)(Sidak’s multiple comparison’s test). G, Whole and halved brains from NU/J mice injected intracranially with C17.2 FOXR2. Scale bars = 1 cm. H, Survival of NU/J mice injected intracranially with C17.2 Luc (N=7) or C17.2 FOXR2 (N=10)(Log rank Mantel-Cox test). I, Survival of NRG mice injected intracranially with C17.2 Luc or C17.2 FOXR2 (N=13)(Log rank Mantel-Cox test). J, Western blot of Daoy WT, Daoy #21 (FOXR2 KO), Daoy #21+ (FOXR2 KO with rescue FOXR2 cDNA), and Daoy #22 (has integrated CRISPR/Cas9 vector but no FOXR2 mutation). K, MTS assay of Daoy WT, Daoy #21, Daoy #21+ and Daoy #22 (Dunnett’s multiple comparison’s test). L, Soft agar assay of Daoy WT, Daoy #21, Daoy #21+ and Daoy #22 (Dunnett’s multiple comparison’s test). Error bars, SEM.
Figure 7.
FOXR2 interacts with C-MYC and…
Figure 7.
FOXR2 interacts with C-MYC and N-MYC and activates FAK/SRC signaling. A , CoIP…
Figure 7.
FOXR2 interacts with C-MYC and N-MYC and activates FAK/SRC signaling. A, CoIP of endogenous C-MYC with flag-tagged FOXR2 in HSC1λ. B, CoIP of V5-tagged C-MYC, L-MYC and N-MYC with flag-tagged FOXR2 in HEK293T. C, Western blot showing cycloheximide (CHX)-treated HSC1λ and C17.2 with and without FOXR2. CHX treatment (100 ug/ml in DMSO) was done for time indicated. D, Upper panel: putative FOXR2 protein domains. Lower panel: soft agar assay of C17.2 Luc or indicated FOXR2 deletion mutants. Error bars, SEM. E, Western blot showing effects of FOXR2 expression changes on FAK/SRC signaling.
Ostrom QT, Gittleman H, Farah P, Ondracek A, Chen Y, Wolinsky Y, et al. CBTRUS statistical report: Primary brain and central nervous system tumors diagnosed in the United States in 2006–2010. Neuro Oncol 2013;15 Suppl 2:ii1–56 doi 10.1093/neuonc/not151.
-
DOI
-
PMC
-
PubMed
Louis DN, Ohgaki H, Wiestler OD, Cavenee WK, Burger PC, Jouvet A, et al. The 2007 WHO classification of tumours of the central nervous system. Acta Neuropathol 2007;114(2):97–109 doi 10.1007/s00401-007-0243-4.
-
DOI
-
PMC
-
PubMed
Chan TSY, Wang X, Spence T, Taylor MD, Huang A Embryonal brain tumors. New York: Springer; 2015.
Northcott PA, Buchhalter I, Morrissy AS, Hovestadt V, Weischenfeldt J, Ehrenberger T, et al. The whole-genome landscape of medulloblastoma subtypes. Nature 2017;547(7663):311–7 doi 10.1038/nature22973.
-
DOI
-
PMC
-
PubMed
Picard D, Miller S, Hawkins CE, Bouffet E, Rogers HA, Chan TS, et al. Markers of survival and metastatic potential in childhood CNS primitive neuro-ectodermal brain tumours: an integrative genomic analysis. Lancet Oncol 2012;13(8):838–48 doi 10.1016/S1470-2045(12)70257-7.
-
DOI
-
PMC
-
PubMed