. 2019 Mar;29(3):464-471.
doi: 10.1101/gr.238923.118. Epub 2019 Jan 23.

JACKS: joint analysis of CRISPR/Cas9 knockout screens

Affiliations

JACKS: joint analysis of CRISPR/Cas9 knockout screens

Felicity Allen et al. Genome Res. 2019 Mar.

Abstract

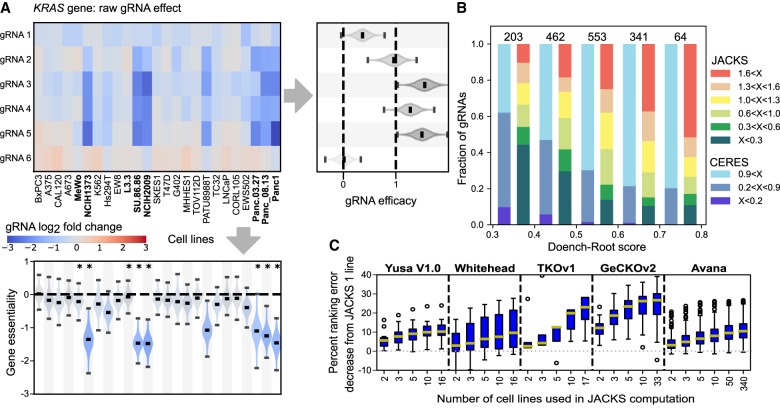
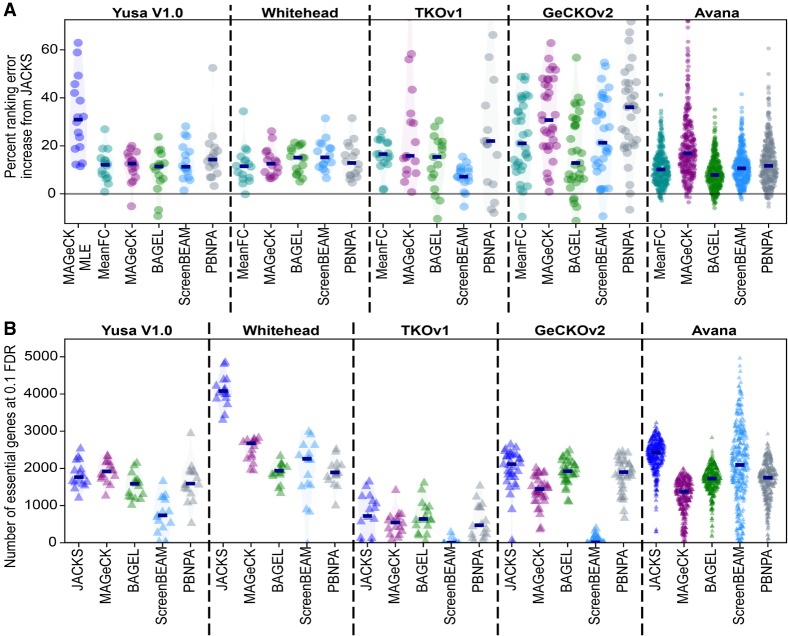
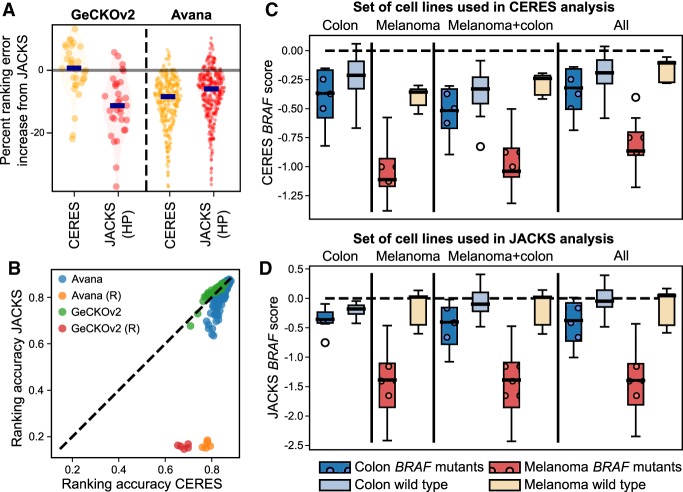
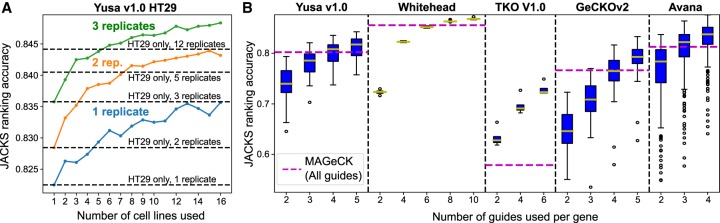
Genome-wide CRISPR/Cas9 knockout screens are revolutionizing mammalian functional genomics. However, their range of applications remains limited by signal variability from different guide RNAs that target the same gene, which confounds gene effect estimation and dictates large experiment sizes. To address this problem, we report JACKS, a Bayesian method that jointly analyzes screens performed with the same guide RNA library. Modeling the variable guide efficacies greatly improves hit identification over processing a single screen at a time and outperforms existing methods. This more efficient analysis gives additional hits and allows designing libraries with a 2.5-fold reduction in required cell numbers without sacrificing performance compared to current analysis standards.


Figures

Figure 1.
Figure 1.
Joint analysis of several CRISPR/Cas9 knockout screens. (A) JACKS inferred decomposition of median-normalized log2 fold change (heatmap) for six gRNAs targeting the KRAS gene (y-axis, GeCKOv2 library) in 25 cancer cell lines from Aguirre et al. (2016) (x-axis). The inferred gRNA efficacies and gene essentialities (with uncertainty) are displayed to the right and below the heatmap, respectively. Lines with KRAS driver mutations are highlighted in bold and indicated with an asterisk. (B) Fraction of gRNAs (y-axis) targeting Hart essential genes (Hart et al. 2014) in each range of Doench–Root score (Doench et al. 2016) (x-axis) for specified ranges of CERES and JACKS inferred gRNA efficacy scores (“X”; colors). Number of gRNAs in each column is marked above the bar. (C) Percentage of ranking error (fraction of area above the ROC curve below 0.2 false-positive rate; Methods) decrease (y-axis; median, quartiles, and 95th deciles marked in box plot) for increasing number of experiments in JACKS model (x-axis) for five different libraries.
Figure 2.
Figure 2.
JACKS outperforms existing approaches. (A) JACKS outperforms existing alternatives at distinguishing essential genes. Percentage of ranking error increase (y-axis) compared to JACKS for five to six alternative analysis methods (x-axis) on five different libraries (panels). Every marker represents one cell line or time point sample; median increase is marked with a dark blue line segment, and estimated distributions are shaded. (B) JACKS identifies more essential genes compared with existing methods. Number of essential genes identified at a 0.1 false-discovery rate (y-axis) for JACKS and alternative analysis methods (x-axis). Every marker represents one cell line or time point sample.
Figure 3.
Figure 3.
Assuming similar gene essentiality across experiments biases results. (A) Methods that assume similar gene essentialities across cell lines perform favorably compared to JACKS. Percentage of ranking error increase compared to JACKS (y-axis) for CERES (yellow) and JACKS with a hierarchical prior (HP) (red) for the GeCKOv2 and Avana libraries. Markers and shading as in Figure 2A. (B) CERES identifies essential genes from random data. Ranking accuracy of CERES (x-axis) compared to JACKS (y-axis) on cell lines (individual markers) from the Avana (blue) and GeCKOv2 (green) libraries, as well as five randomized experiments (yellow and red markers) included for comparison. Dashed line, y = x. (C) CERES’ preference for a common gene response across cell lines results in more similar scores for differentially essential genes, whereas (D) JACKS maintains differential signal between cell lines. CERES (C) and JACKS (D) gene essentiality scores for the BRAF gene in melanoma and colon cancer cell lines (colors) when processed with selections of cell lines (panels) from the Avana data set, grouped by BRAF mutation status (shading and patterns).
Figure 4.
Figure 4.
JACKS enables reduced screen size and cost. (A) Average JACKS ranking accuracy (y-axis) on HT29 cell line for increasing numbers of coprocessed cell lines (x-axis), and different number of technical replicates (colors). Two hundred cell lines were randomly sampled for each point on the graph and results averaged. As a reference, the same metric is plotted in increasing numbers of HT29 replicates (y-axis) processed by JACKS without the other cell lines (dashed lines). (B) JACKS ranking accuracy (y-axis) for increasing numbers of gRNAs (x-axis) from five different libraries (panels) using two replicates per cell line, compared to MAGeCK used on all five gRNAs and all available (two to four per cell line) replicates (dashed line). Box plot as in Figure 1C.

References

    1. Aguirre AJ, Meyers RM, Weir BA, Vazquez F, Zhang CZ, Ben-David U, Cook A, Ha G, Harrington WF, Doshi MB, et al. 2016. Genomic copy number dictates a gene-independent cell response to CRISPR-Cas9 targeting. Cancer Discov 6: 914–929. 10.1158/2159-8290.CD-16-0154 - DOI - PMC - PubMed
    1. Bae S, Kweon J, Kim HS, Kim JS. 2014. Microhomology-based choice of Cas9 nuclease target sites. Nat Methods 11: 705–706. 10.1038/nmeth.3015 - DOI - PubMed
    1. Barretina J, Caponigro G, Stransky N, Venkatesan K, Margolin AA, Kim S, Wilson CJ, Lehár J, Kryukov GV, Sonkin D, et al. 2012. The Cancer Cell Line Encyclopedia enables predictive modelling of anticancer drug sensitivity. Nature 483: 603–607. 10.1038/nature11003 - DOI - PMC - PubMed
    1. Benjamini Y, Hochberg Y. 1995. Controlling the false discovery rate: a practical and powerful approach to multiple testing. J R Stat Soc B 57: 289–300. 10.2307/2346101 - DOI
    1. Chapman PB, Hauschild A, Robert C, Haanen JB, Ascierto P, Larkin J, Dummer R, Garbe C, Testori A, Maio M, et al. 2011. Improved survival with vemurafenib in melanoma with BRAF V600E mutation. N Engl J Med 364: 2507–2516. 10.1056/NEJMoa1103782 - DOI - PMC - PubMed

Publication types