. 2019 Feb 4;216(2):384-406.
doi: 10.1084/jem.20180595. Epub 2019 Jan 23.

Immune regulation by glucocorticoids can be linked to cell type-dependent transcriptional responses

Affiliations

Immune regulation by glucocorticoids can be linked to cell type-dependent transcriptional responses

Luis M Franco et al. J Exp Med. .

Abstract

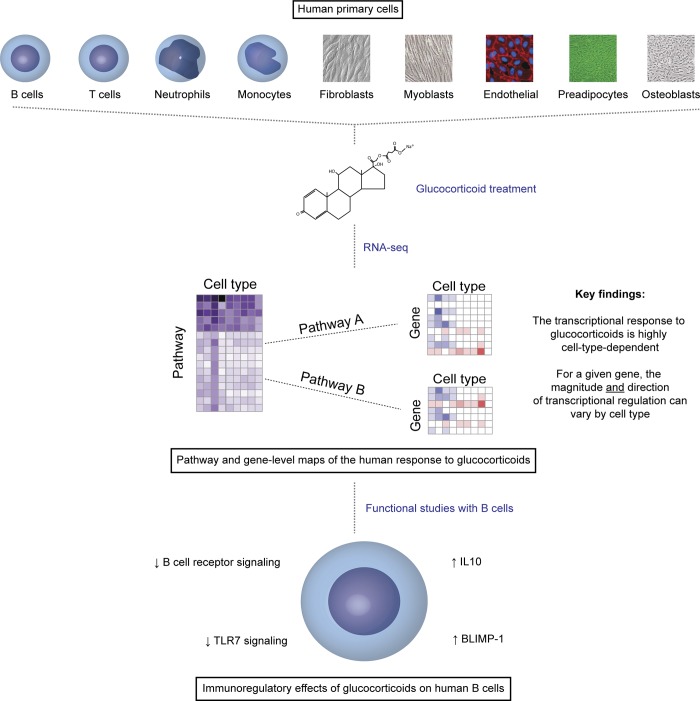
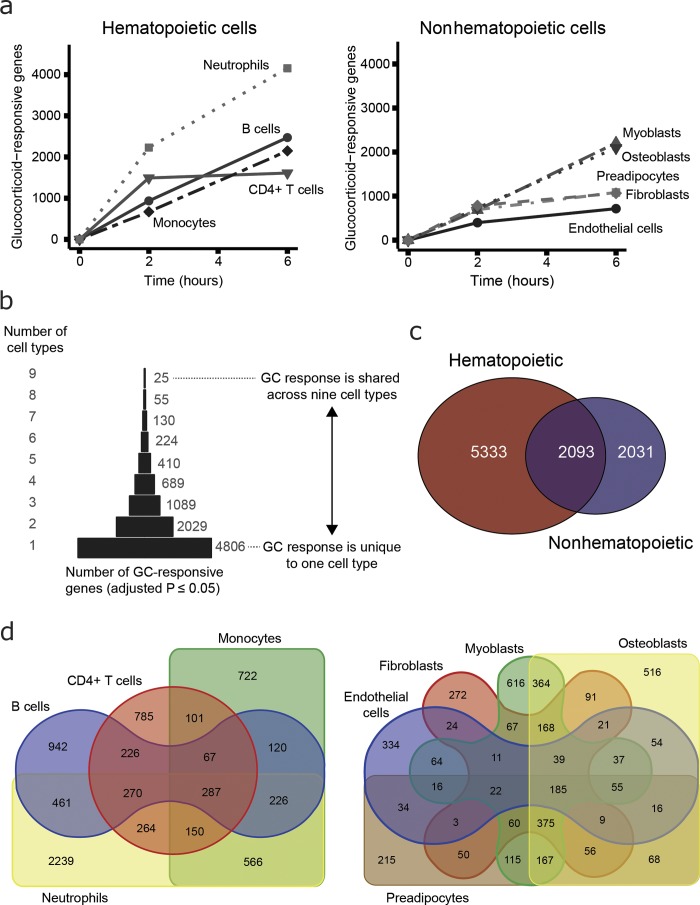
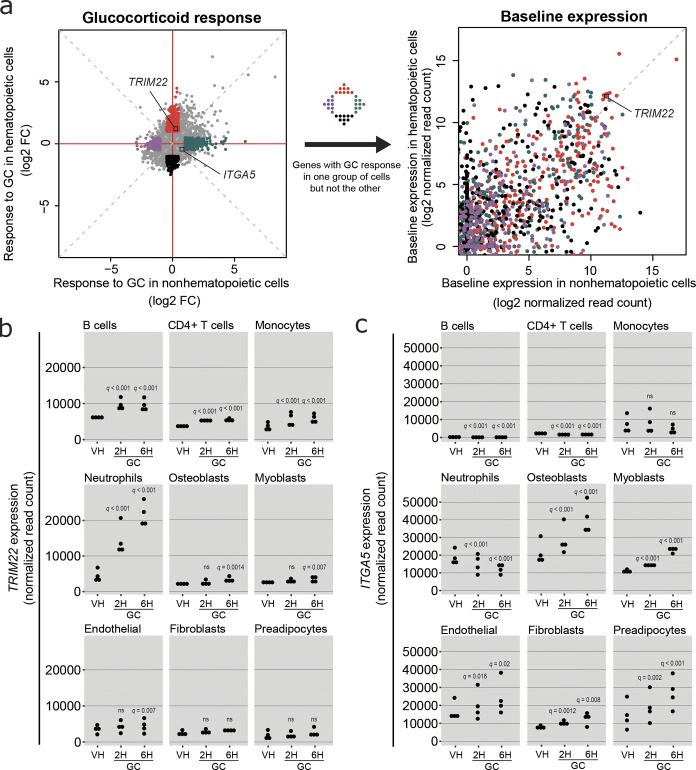
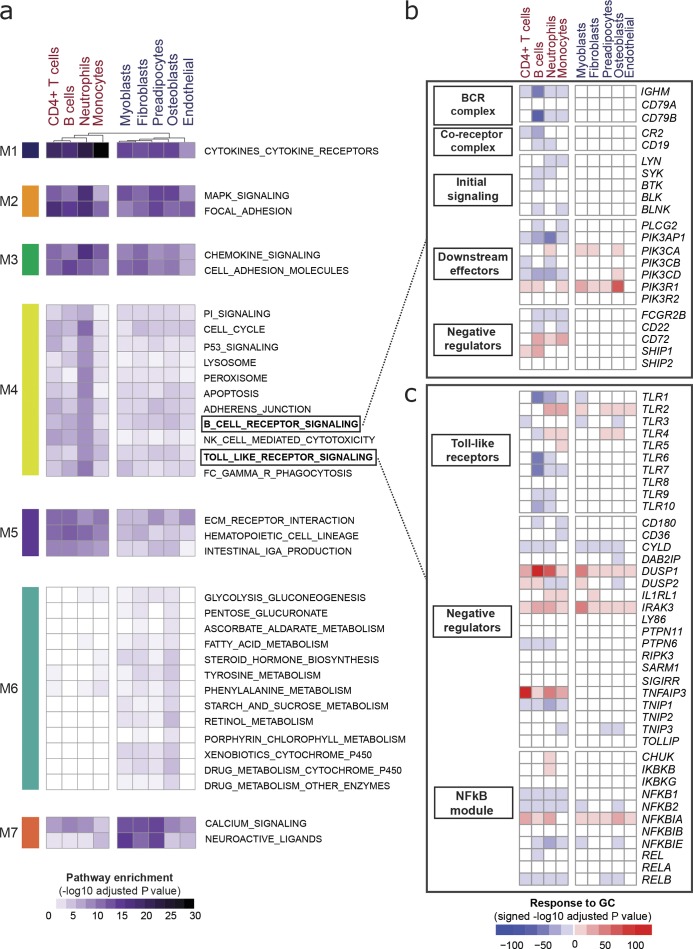
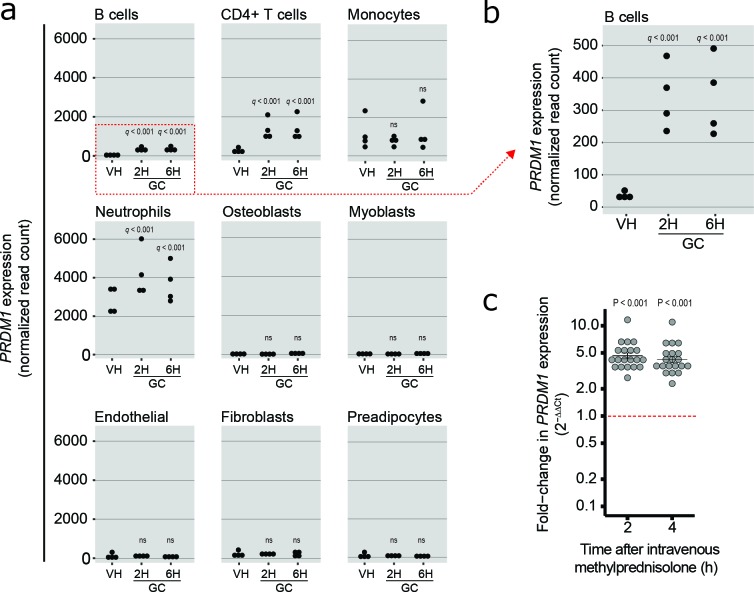
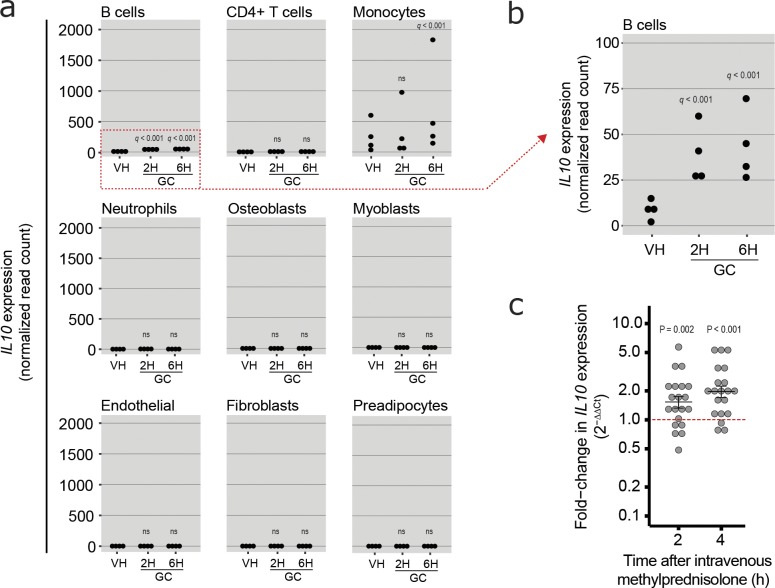
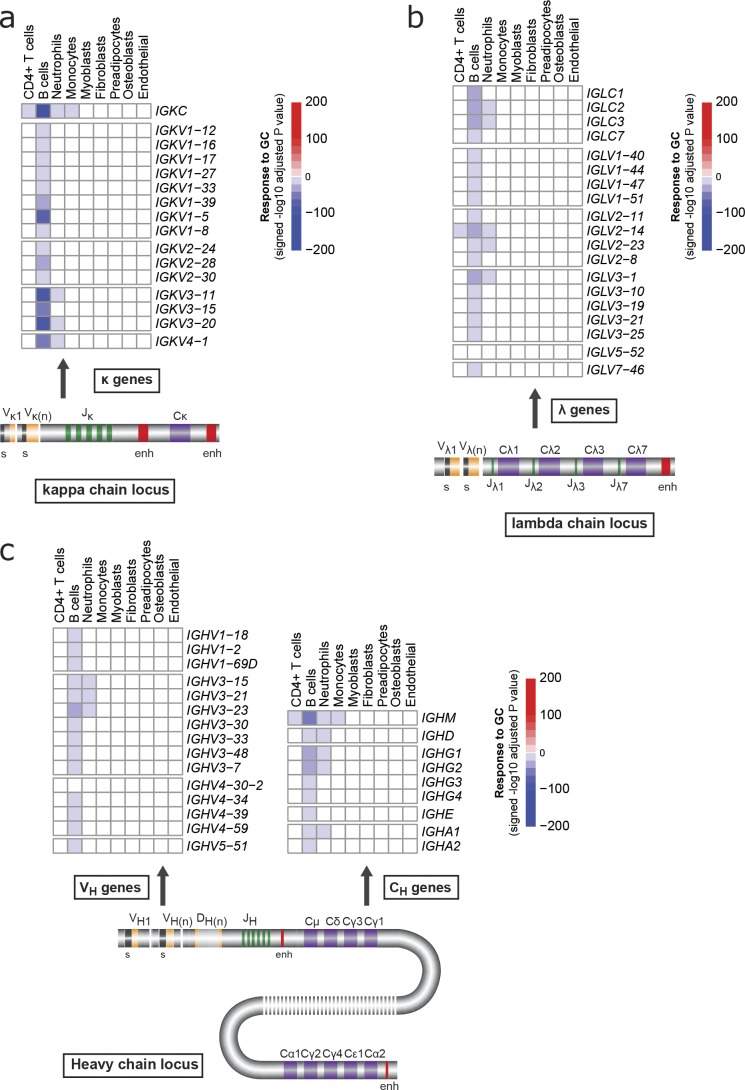
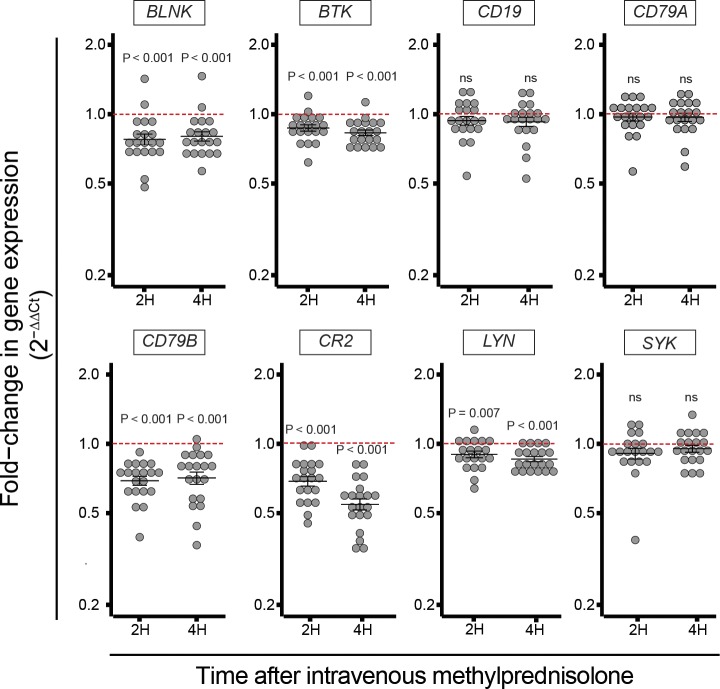
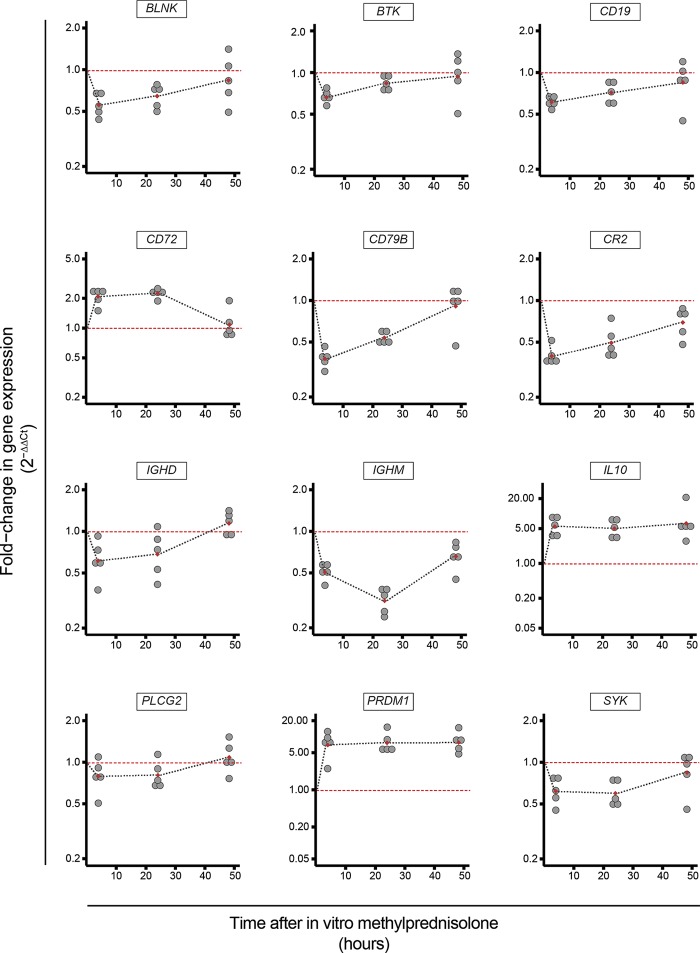
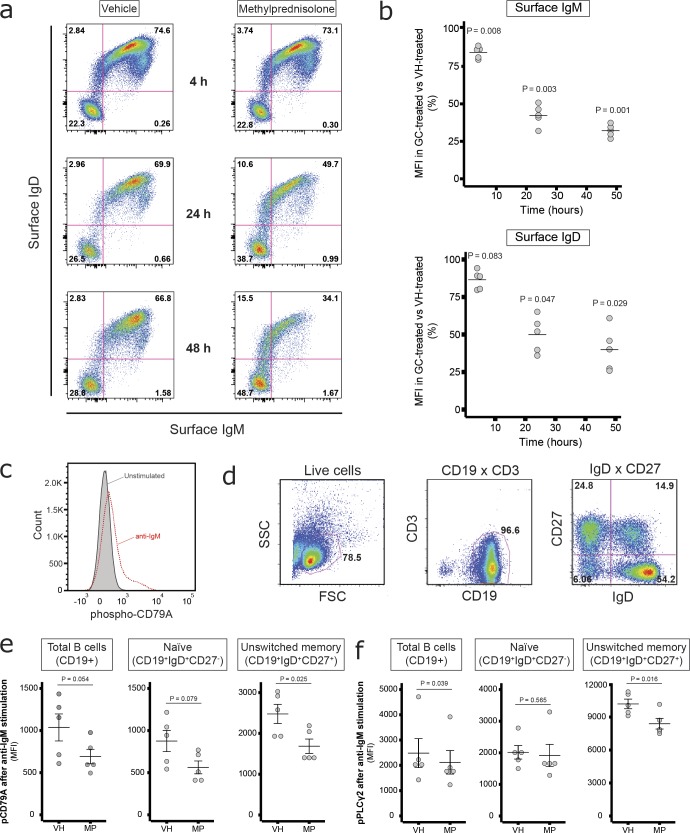
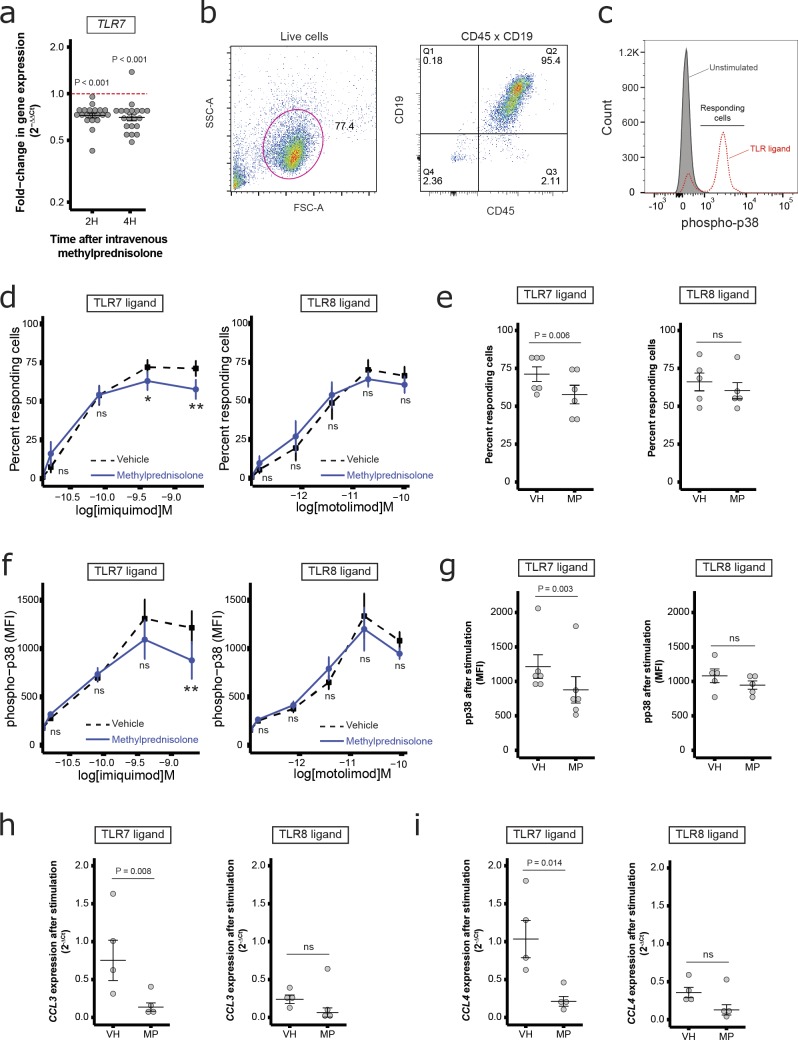
Glucocorticoids remain the most widely used immunosuppressive and anti-inflammatory drugs, yet substantial gaps exist in our understanding of glucocorticoid-mediated immunoregulation. To address this, we generated a pathway-level map of the transcriptional effects of glucocorticoids on nine primary human cell types. This analysis revealed that the response to glucocorticoids is highly cell type dependent, in terms of the individual genes and pathways affected, as well as the magnitude and direction of transcriptional regulation. Based on these data and given their importance in autoimmunity, we conducted functional studies with B cells. We found that glucocorticoids impair upstream B cell receptor and Toll-like receptor 7 signaling, reduce transcriptional output from the three immunoglobulin loci, and promote significant up-regulation of the genes encoding the immunomodulatory cytokine IL-10 and the terminal-differentiation factor BLIMP-1. These findings provide new mechanistic understanding of glucocorticoid action and emphasize the multifactorial, cell-specific effects of these drugs, with potential implications for designing more selective immunoregulatory therapies.


Figures

None
Graphical abstract
Figure 1.
Figure 1.
The transcriptional response to glucocorticoids varies greatly by cell type. Four primary human hematopoietic cell types and five primary human nonhematopoietic cell types were studied. For each cell type, cells from four unrelated healthy donors were independently cultured and treated with methylprednisolone (22.7 µM) or vehicle (0.08% ethanol). Total RNA was purified 2 and 6 h after in vitro treatment and RNA-seq was performed. Differential expression was assessed by comparing data from methylprednisolone-treated versus vehicle-treated cells in the four biological replicates. The statistical significance of differential expression was calculated with a Wald test, after accounting for dispersion, library size, and read count. The resulting P values for differential expression were adjusted for multiple testing by the method of Benjamini and Hochberg (1995). A glucocorticoid-responsive gene is defined as one with an adjusted P value for differential expression of ≤0.05. (a) Line plots of the number of glucocorticoid-responsive genes over time in each cell type. (b) Pyramid plot of glucocorticoid (GC)-responsive genes by the number of cell types in which the glucocorticoid response was observed. All genes with evidence of a glucocorticoid response at one or both time points in at least one cell type (9,457 genes) are included. Genes at the top were glucocorticoid responsive in the nine cell types studied. Genes at the bottom were glucocorticoid responsive in only one of the nine cell types. Other genes were glucocorticoid responsive in any combination of two to nine cell types. (c) Venn diagram of the number of glucocorticoid-responsive genes in hematopoietic versus nonhematopoietic cells. All genes with evidence of a glucocorticoid response at one or both time points (9,457 genes) are included. (d) Asymmetric Venn diagrams showing the distribution of glucocorticoid-responsive genes in hematopoietic (left) or nonhematopoietic cells (right).
Figure 2.
Figure 2.
The direction and magnitude of transcriptional regulation by glucocorticoids are cell type dependent. Four primary human hematopoietic cell types and five primary human nonhematopoietic cell types were studied. For each cell type, cells from four unrelated healthy donors were independently cultured and treated with methylprednisolone (22.7 µM) or vehicle (0.08% ethanol). Total RNA was purified 2 and 6 h after in vitro treatment and RNA-seq was performed. Differential expression was assessed by comparing data from methylprednisolone-treated versus vehicle-treated cells in the four biological replicates. The statistical significance of differential expression was calculated with a Wald test, after accounting for dispersion, library size, and read count. The resulting P values for differential expression were adjusted for multiple testing by the method of Benjamini and Hochberg (1995). (a) The left panel displays the transcriptional response to glucocorticoids in hematopoietic cells versus nonhematopoietic cells for each of 56,870 genes. The log2 fold change compares methylprednisolone-treated versus vehicle-treated cells after 6 h of in vitro treatment. Each dot represents one gene. The x-axis variable is the mean log2 fold change in the five nonhematopoietic cells (endothelial cells, fibroblasts, myoblasts, osteoblasts, and preadipocytes), and the y-axis variable is the mean log2 fold change (FC) in the four hematopoietic cells (B cells, CD4+ T cells, monocytes, and neutrophils). The four tails of the distribution are color-coded and represent genes with evidence of transcriptional response to glucocorticoid (defined here as a mean log2 fold change ≥ 0.5 or ≤ −0.5) in one group of cells but not in the other. The right panel displays the baseline expression levels in hematopoietic versus nonhematopoietic cells for the genes with strongest evidence of a transcriptional response to glucocorticoid in one group of cells but not in the other (genes at the four tails of the distribution, as defined above). The values displayed are the mean log2 normalized read count at baseline in nonhematopoietic cells (x axis) versus hematopoietic cells (y axis). (b) Transcriptional response of TRIM22 to in vitro glucocorticoid treatment in nine primary human cell types. (c) Transcriptional response of ITGA5 to in vitro glucocorticoid treatment in nine primary human cell types. In b and c, the values displayed are the normalized read counts in vehicle-treated cells (VH; average of 2 and 6 h) and in glucocorticoid-treated cells (GC; 2 or 6 h). Each dot represents one biological replicate (one donor). Multiple-testing-adjusted P values (q) are from comparisons of glucocorticoid-treated versus vehicle-treated cells at each of the two time points. ns, not significant (q > 0.05).
Figure 3.
Figure 3.
A pathway-level map reveals specific targets of glucocorticoid action on individual cell types. For each cell type, cells from four unrelated healthy donors were independently cultured and treated with methylprednisolone (22.7 µM) or vehicle (0.08% ethanol). Total RNA was purified 2 and 6 h after in vitro treatment and RNA-seq was performed. Differential expression was assessed by comparing data from methylprednisolone-treated versus vehicle-treated cells in the four biological replicates. (a) Heat map of gene set enrichment analysis results. For each cell type, the input for the analysis was a list of genes differentially expressed in response to in vitro methylprednisolone treatment for 6 h, ranked by the absolute value of the log2 fold change (methylprednisolone versus vehicle). The gene sets displayed in this plot are KEGG pathways, as defined in MSigDB v.6.2. For each pathway, the test assesses whether the genes in the pathway tend to be located near the top of the ranked list of differentially expressed genes. Enrichment P values are calculated with a Wilcoxon test, and multiple-testing correction is performed with the method of Benjamini and Hochberg (1995). Pathways that were significantly enriched for glucocorticoid-responsive genes (adjusted P value < 0.05) in at least one cell type are displayed. The values displayed are the −log10 adjusted P values for gene set enrichment. Each row represents one pathway, and each column represents one cell type. Higher values mean that a given pathway was more highly enriched for glucocorticoid-responsive genes in the respective cell type, regardless of the direction of change in gene expression. Column-wise clustering was performed by hierarchical clustering with Euclidean distances as the distance measure. Row-wise clustering was performed by k-means clustering with 100,000 starts and up to 100 iterations, partitioning the pathway enrichment results into 12 modules (M1–M12). The pathways within each module have a similar pattern of cell type specificity of the glucocorticoid response. The first seven modules are displayed here for ease of visualization, and the remaining five modules are displayed in Fig. S2. (b) Gene-level heat map showing the transcriptional effect of glucocorticoids on genes involved in BCR signaling. (c) Gene-level heat map showing the transcriptional effect of glucocorticoids on genes involved in TLR signaling. A subset of key TLR signaling genes is shown here for ease of visualization. Results for the entire set of TLR signaling genes are shown in Fig. S5. In b and c, each row represents one gene, and each column represents one cell type. The statistical significance of differential expression was calculated with a Wald test, after accounting for dispersion, library size, and read count. The resulting P values for differential expression were adjusted for multiple testing by the method of Benjamini and Hochberg (1995). The values displayed are the signed −log10 adjusted P values for differential expression. Higher positive values mean stronger evidence of up-regulation, and lower negative values mean stronger evidence of down-regulation, after 6 h of in vitro exposure to methylprednisolone.
Figure 4.
Figure 4.
Glucocorticoids up-regulate PRDM1 (BLIMP1) expression in human B cells, CD4+ T cells, and neutrophils. (a) Transcriptional response of PRDM1 to in vitro glucocorticoid treatment in nine primary human cell types. For each cell type, cells from four unrelated healthy donors were independently cultured and treated with methylprednisolone (22.7 µM) or vehicle (0.08% ethanol). Total RNA was purified 2 and 6 h after in vitro treatment and RNA-seq was performed. Differential expression was assessed by comparing data from methylprednisolone-treated versus vehicle-treated cells in the four biological replicates. The statistical significance of differential expression was calculated with a Wald test, after accounting for dispersion, library size, and read count. The resulting P values for differential expression were adjusted for multiple testing by the method of Benjamini and Hochberg (1995). The values displayed are the normalized read counts for the gene PRDM1 in vehicle-treated cells (VH; average of 2 and 6 h) and in glucocorticoid-treated cells (GC; 2 or 6 h). Each dot represents one biological replicate (one donor). The y-axis limits are fixed, to facilitate comparison of expression levels across cell types. Multiple-testing-adjusted P values (q) are from comparisons of glucocorticoid-treated versus vehicle-treated cells at each of the two time points. ns, not significant (q > 0.05). (b) Close-up of the PRDM1 response in B cells, with y-axis limits appropriate for the range of values. (c) In vivo validation of the transcriptional effect of glucocorticoids on PRDM1 expression in human B cells. 20 healthy volunteers were treated with a single intravenous dose of methylprednisolone (250 mg). Circulating B cells were purified before (baseline), 2 h after, and 4 h after medication administration. Gene expression was measured by real-time PCR. Results are presented as fold change in expression with respect to baseline, measured by the 2−ΔΔCt method. Each dot represents one biological replicate (one donor). Error bars display the geometric mean ± the standard error of the geometric mean. Statistical testing results are from paired (signed-rank) Wilcoxon tests, where paired values are the 2−ΔCt of glucocorticoid-treated and baseline cells from the same subject. The 2−ΔCt values at each time point are displayed in Fig. S4.
Figure 5.
Figure 5.
Glucocorticoids up-regulate IL10 expression in B cells and monocytes. (a) Transcriptional response of IL10 to in vitro glucocorticoid treatment in nine primary human cell types. For each cell type, cells from four unrelated healthy donors were independently cultured and treated with methylprednisolone (22.7 µM) or vehicle (0.08% ethanol). Total RNA was purified 2 and 6 h after in vitro treatment and RNA-seq was performed. The values displayed are the normalized read counts for the gene IL10 in vehicle-treated cells (VH; average of 2 and 6 h) and in glucocorticoid-treated cells (GC; 2 or 6 h). Each dot represents one biological replicate (one donor). The y-axis limits are fixed, to facilitate comparison of expression levels across cell types. Multiple-testing–adjusted P values (q) are from comparisons of glucocorticoid-treated versus vehicle-treated cells at each of the two time points. ns, not significant (q > 0.05). (b) Close-up of the IL10 response in B cells, with y-axis limits appropriate for the range of values. (c) In vivo validation of the transcriptional effect of glucocorticoids on IL10 expression in human B cells. 20 healthy volunteers were treated with a single dose of intravenous methylprednisolone (250 mg). Circulating B cells were purified before (baseline), 2 h after, and 4 h after medication administration. Gene expression was measured by real-time PCR. Results are presented as fold change in expression with respect to baseline, measured by the 2−ΔΔCt method. Each dot represents one biological replicate (one donor). Error bars display the geometric mean ± the standard error of the geometric mean. Statistical testing results are from paired (signed-rank) Wilcoxon tests, where paired values are the 2−ΔCt of glucocorticoid-treated and baseline cells from the same subject. The 2−ΔCt values at each time point are displayed in Fig. S4.
Figure 6.
Figure 6.
Glucocorticoids reduce transcriptional output from the three human immunoglobulin loci. (a–c) Heat maps of the transcriptional effect of glucocorticoids (GC) at each of the three human immunoglobulin loci: the kappa light chain locus at 2p11.2 (a), the lambda light chain locus at 22q11.22 (b), and the heavy chain locus at 14q32.33 (c). Each row represents one gene, and each column represents one cell type. For each cell type, cells from four unrelated healthy donors were independently cultured and treated with methylprednisolone (22.7 µM) or vehicle (0.08% ethanol). Total RNA was purified 2 and 6 h after in vitro treatment and RNA-seq was performed. Differential expression was assessed by comparing data from methylprednisolone-treated versus vehicle-treated cells in the four biological replicates. The statistical significance of differential expression was calculated with a Wald test, after accounting for dispersion, library size, and read count. The resulting P values for differential expression were adjusted for multiple testing by the method of Benjamini and Hochberg (1995). The values displayed are the signed −log10 adjusted P values for differential expression. Higher positive values mean stronger evidence of up-regulation, and lower negative values mean stronger evidence of down-regulation, after 6 h of in vitro exposure to methylprednisolone.
Figure 7.
Figure 7.
Glucocorticoids reduce expression of key BCR signaling genes in vivo. 20 unrelated healthy donors were treated with a single intravenous dose of methylprednisolone (250 mg). Circulating B cells were purified before (baseline), 2 h after, and 4 h after medication administration. Gene expression was measured by real-time PCR. Results are presented as fold change in expression with respect to baseline, measured by the 2−ΔΔCt method. Each dot represents one biological replicate (one donor). Error bars display the geometric mean ± the standard error of the geometric mean. Statistical testing results are from paired (signed-rank) Wilcoxon tests, where paired values are the 2−ΔCt of glucocorticoid-treated and baseline cells from the same subject. The 2−ΔCt values at each time point are displayed in Fig. S4.
Figure 8.
Figure 8.
The kinetics of the transcriptional response to glucocorticoid in key BCR signaling genes is locus dependent. Circulating B cells from five unrelated healthy donors were studied independently and on different days. B cells were purified from peripheral blood, incubated overnight, then treated with methylprednisolone (MP; 5.34 µM) or vehicle (VH; 0.08% ethanol) for 4, 24, or 48 h. RNA was purified at each time point, and gene expression was measured by real-time PCR. Each dot represents one biological replicate (one donor). The x-axis variable is the time, in hours, after treatment. The y-axis variable is the fold change in gene expression in glucocorticoid-treated versus vehicle-treated cells, calculated by the 2−ΔΔCt method. Values above the red line indicate higher expression in glucocorticoid-treated than in vehicle-treated cells, and values below the dotted red line indicate lower expression in glucocorticoid-treated than in vehicle-treated cells. The dotted gray line joins the mean fold change value at each time point and is intended to aid in visualization of the kinetics of the transcriptional response at each locus. MFI, mean fluorescence intensity.
Figure 9.
Figure 9.
Glucocorticoids functionally impair BCR signaling. (a) Surface immunoglobulin staining and assessment by flow cytometry after 4 (top), 24 (middle), and 48 h (bottom) of in vitro exposure of circulating human B cells to methylprednisolone (5.34 µM) or vehicle (0.08% ethanol). Representative plots with cells from the same subject are shown. (b) Quantification of surface immunoglobulin staining in glucocorticoid (GC)-treated versus vehicle (VH)-treated cells over time. Circulating B cells from five unrelated healthy donors were studied independently and on different days. B cells were purified from peripheral blood, incubated overnight, then treated with methylprednisolone (5.34 µM) or vehicle (0.08% ethanol) for 4, 24, or 48 h. At each time point, surface IgM and IgD were measured by flow cytometry. The x-axis variable is the time, in hours, after treatment. The y-axis variable is the proportion of the signal in glucocorticoid-treated versus vehicle-treated cells, expressed as a percentage. Horizontal bars display the mean at each time point. Statistical testing results are from a paired t test, where paired values are the MFI in glucocorticoid-treated and vehicle-treated cells from the same subject. MFI, mean flourescence intensity. (c) Distribution of fluorescence intensity for phospho-CD79A in purified circulating B cells, before and after IgM-BCR stimulation. B cells were purified from peripheral blood, incubated overnight, then treated in vitro for 4 h with vehicle (0.08% ethanol), then stimulated for 2 min with 10 µg/ml goat F(ab′)2 anti-human IgM. Unstimulated cells from the same subject, cultured in parallel, are shown as a negative control. A representative plot from one subject is shown. The pattern of response was consistent across subjects. (d) Gating strategy for circulating human B cells. IgD was used instead of IgM for surface staining because anti-IgM antibody was employed for BCR stimulation. (e and f) Phospho-CD79A (e) and phospho-PLCγ2 (f) after IgM-BCR stimulation in the presence or absence of glucocorticoid. Circulating B cells from five unrelated healthy donors were studied independently and on different days. B cells were purified from peripheral blood, incubated overnight, then treated in vitro for 4 h with vehicle (0.08% ethanol) or methylprednisolone (MP; 5.34 µM), then stimulated for 2 min with 10 µg/ml goat F(ab′)2 anti-human IgM. Phosphorylation was measured by flow cytometry. Separate plots show MFI for total B cells, naive, and unswitched memory B cells, as defined by gating in d. Each dot represents one biological replicate (one donor). Error bars display the mean ± SEM. Statistical testing results are from a paired t test, where paired values are the MFI for glucocorticoid-treated and vehicle-treated cells from the same subject.
Figure 10.
Figure 10.
Glucocorticoids selectively impair TLR7 signaling. (a) In vivo examination of the transcriptional effect of glucocorticoids on TLR7. 20 unrelated healthy donors were treated with a single intravenous dose of methylprednisolone (250 mg). Circulating B cells were purified before (baseline), 2 h after, and 4 h after medication administration. Gene expression was measured by real-time PCR. Results are presented as fold change in expression with respect to baseline, measured by the 2−ΔΔCt method. Each dot represents one biological replicate (one donor). Error bars display the geometric mean ± the standard error of the geometric mean. Statistical testing results are from a paired t test, where paired values are the ΔCt of glucocorticoid-treated and vehicle-treated cells from the same donor. (b) Flow cytometry of purified circulating total B cells. Purity was defined as the proportion of CD19+ among CD45+ events. (c) Distribution of fluorescence intensity for phospho-p38 MAPK in purified B cells before and after 15 min of in vitro stimulation with the TLR7 agonist imiquimod. A representative plot from one subject is shown. Unstimulated cells from the same subject, cultured in parallel, are shown as a negative control. The bimodal pattern of response was consistent across subjects. (d–g) Dose–response relationships for in vitro TLR7 or TLR8 stimulation of primary human B cells in the presence of glucocorticoid or vehicle. Circulating B cells from six unrelated healthy donors were studied independently and on different days. B cells were purified from peripheral blood, incubated overnight in the presence of methylprednisolone (MP; 5.34 µM) or vehicle (VH; 0.08% ethanol), then stimulated for 15 min with the appropriate TLR ligand. (d) The dose–response relationship when the x-axis variable is the molar concentration of the ligand (expressed as a natural logarithm), and the y-axis variable is the percent of cells that responded to TLR stimulation. For the TLR7 ligand imiquimod, the five concentrations used for stimulation were 0, 5, 10, 20, and 40 µg/ml (0, 18, 36.1, 72.2, and 144.4 µM). For the TLR8 ligand motolimod, the six concentrations used for stimulation were 0, 1.25, 2.5, 5, 10, and 20 µg/ml (0, 2.7, 5.5, 10.9, 21.8, and 43.6 µM). Error bars display the mean and SEM. Statistical testing results are from paired t tests at each ligand concentration, where paired values are the percent of responding cells for glucocorticoid-treated or vehicle-treated cells from the same subject. (e) Percent of cells that responded to saturating concentrations of TLR7 (imiquimod 144.4 µM) or TLR8 (motolimod 43.6 µM) agonists, after overnight incubation with methylprednisolone (MP) or vehicle (VH). Each dot represents one biological replicate (one donor). Error bars display the mean ± SEM. Statistical testing results are from paired t tests, where paired values are the percent of responding cells for glucocorticoid-treated and vehicle-treated cells from the same subject. (f) The dose–response relationship when the x-axis variable is the molar concentration of the ligand (expressed as a natural logarithm), and the y-axis variable is the signal intensity for phospho-p38 MAPK after TLR stimulation. For the TLR7 ligand imiquimod, the five concentrations used for stimulation were 0, 5, 10, 20, and 40 µg/ml (0, 18, 36.1, 72.2, and 144.4 µM). For the TLR8 ligand motolimod, the six concentrations used for stimulation were 0, 1.25, 2.5, 5, 10, and 20 µg/ml (0, 2.7, 5.5, 10.9, 21.8, and 43.6 µM). Error bars display the mean ± SEM. Statistical testing results are from paired t tests at each ligand concentration, where paired values are the MFI of glucocorticoid-treated and vehicle-treated cells from the same subject. MFI, mean fluorescence intensity. (g) Signal intensity for phospho-p38 MAPK at saturating concentrations of TLR7 (imiquimod 144 µM) or TLR8 (motolimod 43.6 µM) agonists, after overnight incubation with methylprednisolone or vehicle. (h and i) CCL3 (h) and CCL4 (i) gene expression after TLR7 or TLR8 stimulation. Circulating B cells from four unrelated healthy donors were studied independently and on different days. B cells were purified from peripheral blood, incubated overnight in the presence of methylprednisolone (5.34 µM) or vehicle (0.08% ethanol), then stimulated for 1 h with the appropriate TLR ligand. Gene expression was measured by real-time PCR and is displayed as the fold difference between the target gene and the reference gene (TBP). Each dot represents one biological replicate (one donor). Error bars display the geometric mean ± the standard error of the geometric mean. Statistical testing results are from a paired t test, where paired values are the ΔCt of glucocorticoid-treated and vehicle-treated cells. *, P ≤ 0.05; **, P ≤ 0.01; ns, not significant (P > 0.05).

Comment in

  • Glucocorticoid response mapped.
    McHugh J. McHugh J. Nat Rev Rheumatol. 2019 Apr;15(4):189. doi: 10.1038/s41584-019-0191-0. Nat Rev Rheumatol. 2019. PMID: 30824878 No abstract available.

Similar articles

Cited by

References

    1. Akdis C.A., Blesken T., Akdis M., Alkan S.S., Heusser C.H., and Blaser K.. 1997. Glucocorticoids inhibit human antigen-specific and enhance total IgE and IgG4 production due to differential effects on T and B cells in vitro. Eur. J. Immunol. 27:2351–2357. 10.1002/eji.1830270933 - DOI - PubMed
    1. Altonsy M.O., Sasse S.K., Phang T.L., and Gerber A.N.. 2014. Context-dependent cooperation between nuclear factor κB (NF-κB) and the glucocorticoid receptor at a TNFAIP3 intronic enhancer: a mechanism to maintain negative feedback control of inflammation. J. Biol. Chem. 289:8231–8239. 10.1074/jbc.M113.545178 - DOI - PMC - PubMed
    1. Bankó Z., Pozsgay J., Szili D., Tóth M., Gáti T., Nagy G., Rojkovich B., and Sármay G.. 2017. Induction and differentiation of IL-10-producing regulatory B cells from healthy blood donors and rheumatoid arthritis patients. J. Immunol. 198:1512–1520. 10.4049/jimmunol.1600218 - DOI - PubMed
    1. Bartholome B., Spies C.M., Gaber T., Schuchmann S., Berki T., Kunkel D., Bienert M., Radbruch A., Burmester G.R., Lauster R., et al. . 2004. Membrane glucocorticoid receptors (mGCR) are expressed in normal human peripheral blood mononuclear cells and up-regulated after in vitro stimulation and in patients with rheumatoid arthritis. FASEB J. 18:70–80. 10.1096/fj.03-0328com - DOI - PubMed
    1. Benjamini Y., and Hochberg Y.. 1995. Controlling the false discovery rate: A practical and powerful approach to multiple testing. J. R. Stat. Soc. Series B Stat. Methodol. 57:289–300.

Publication types

MeSH terms