. 2019 Apr 1;218(4):1182-1199.
doi: 10.1083/jcb.201808014. Epub 2019 Jan 23.

CDK1-CCNB1 creates a spindle checkpoint-permissive state by enabling MPS1 kinetochore localization

Affiliations

CDK1-CCNB1 creates a spindle checkpoint-permissive state by enabling MPS1 kinetochore localization

Daniel Hayward et al. J Cell Biol. .

Abstract

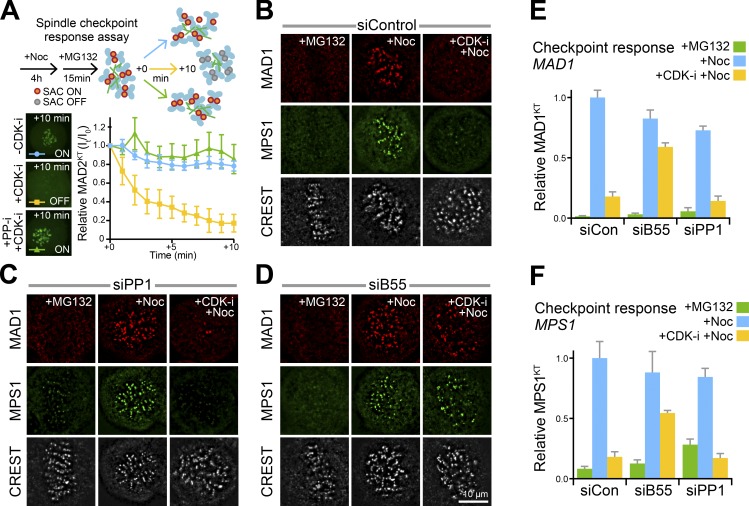
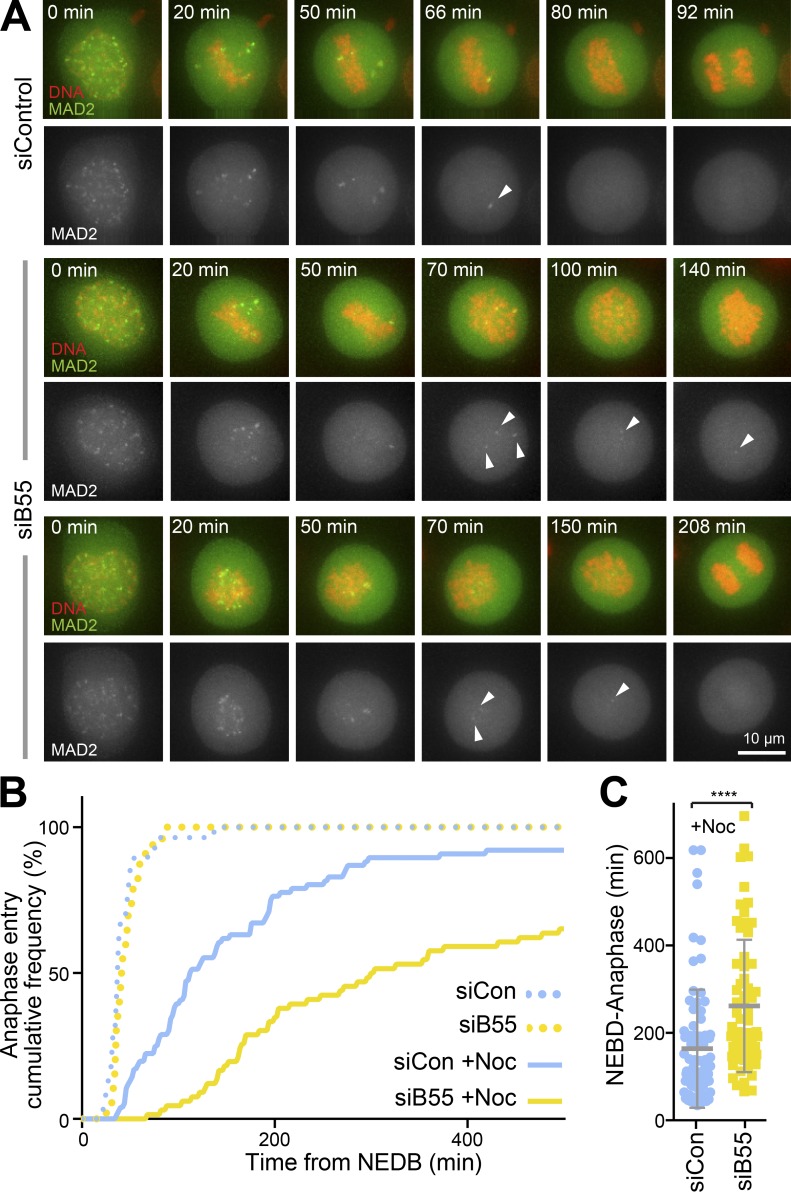
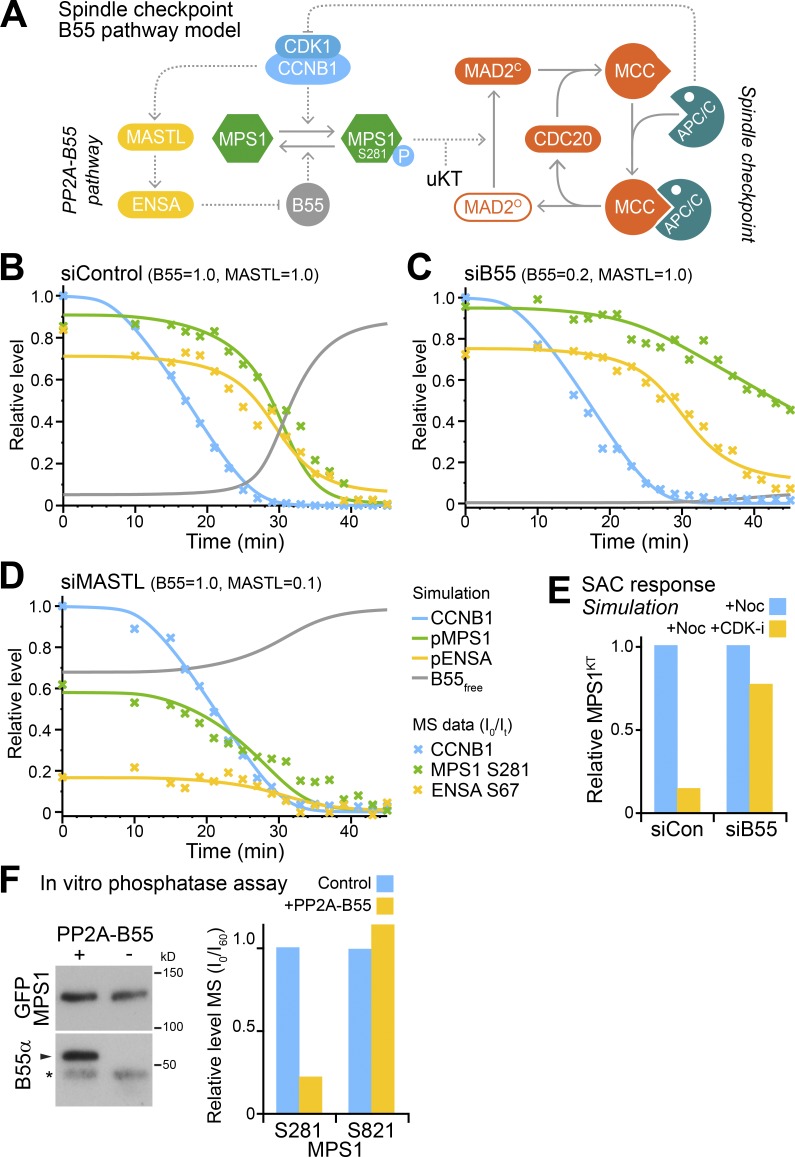
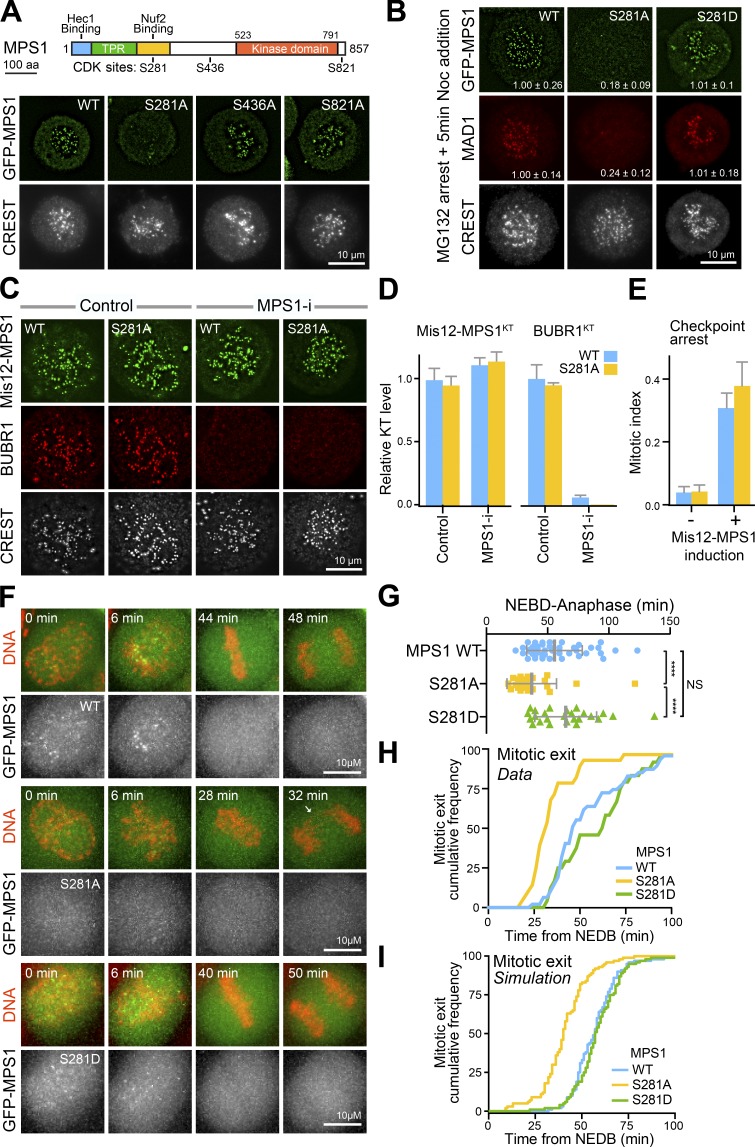
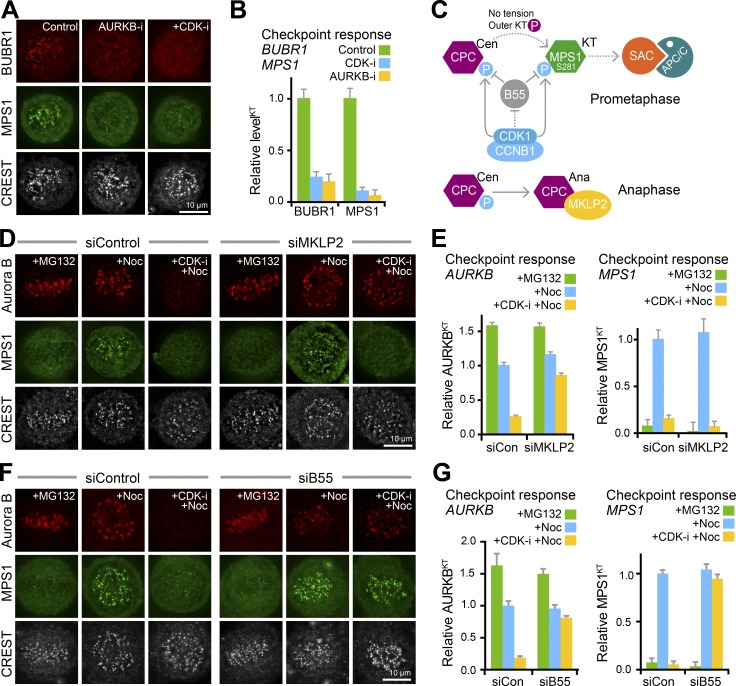
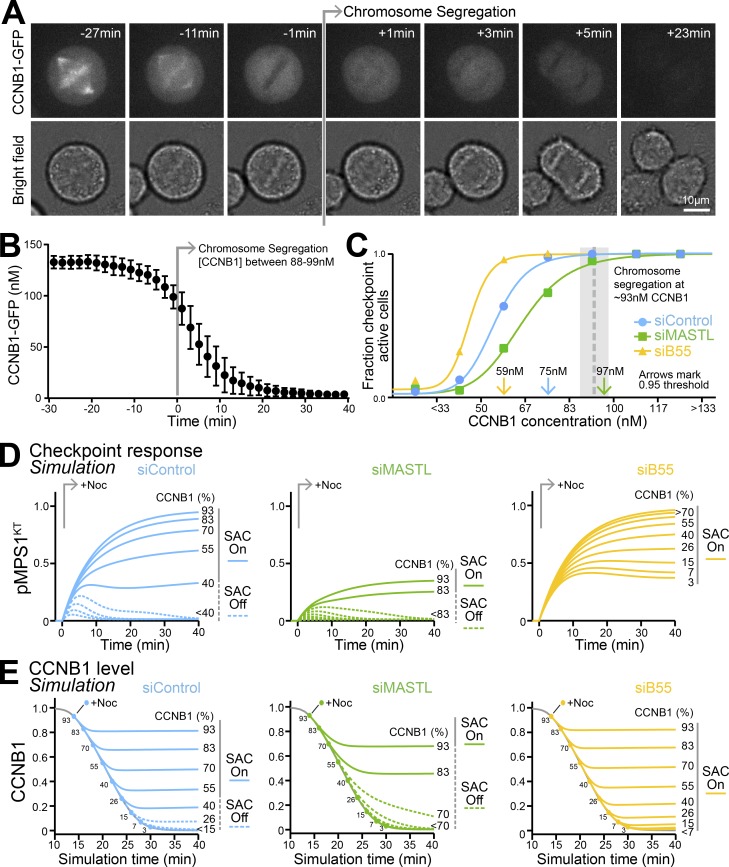
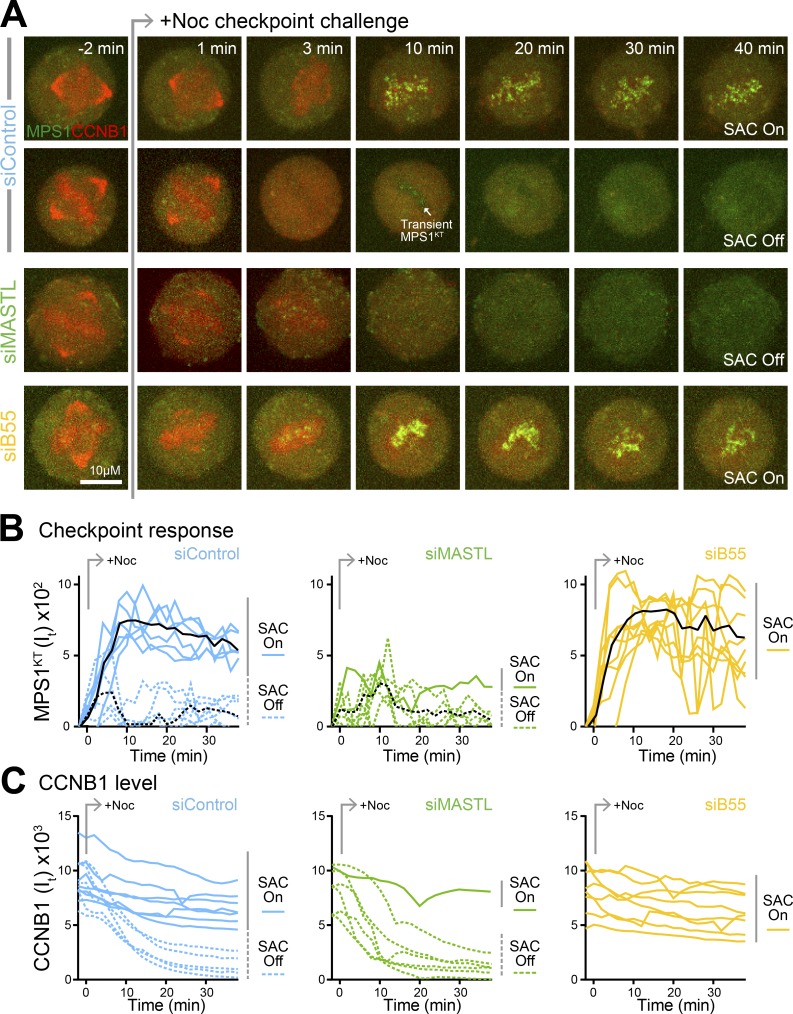
Spindle checkpoint signaling is initiated by recruitment of the kinase MPS1 to unattached kinetochores during mitosis. We show that CDK1-CCNB1 and a counteracting phosphatase PP2A-B55 regulate the engagement of human MPS1 with unattached kinetochores by controlling the phosphorylation status of S281 in the kinetochore-binding domain. This regulation is essential for checkpoint signaling, since MPS1S281A is not recruited to unattached kinetochores and fails to support the recruitment of other checkpoint proteins. Directly tethering MPS1S281A to the kinetochore protein Mis12 bypasses this regulation and hence the requirement for S281 phosphorylation in checkpoint signaling. At the metaphase-anaphase transition, MPS1 S281 dephosphorylation is delayed because PP2A-B55 is negatively regulated by CDK1-CCNB1 and only becomes fully active once CCNB1 concentration falls below a characteristic threshold. This mechanism prolongs the checkpoint-responsive period when MPS1 can localize to kinetochores and enables a response to late-stage spindle defects. By acting together, CDK1-CCNB1 and PP2A-B55 thus create a spindle checkpoint-permissive state and ensure the fidelity of mitosis.


Figures

Figure 1.
Figure 1.
PP2A-B55 counteracts CDK1-dependent MPS1 localization to kinetochores and checkpoint signaling. (A) Spindle checkpoint response assays are explained in the schematic. HeLa GFP-MAD2 cells arrested in mitosis with 0.3 µM nocodazole for 4 h were treated with 20 µM MG132 for 15 min to prevent mitotic exit. Images were taken every minute after treatment with DMSO (−CDK-i control), 5 µM flavopiridol alone (+CDK-i), or 25 nM calyculin A for 1 min before 5 µM flavopridol addition (PP-i +CDK-i). Representative images at +10 min are shown. Mean GFP-MAD2 intensity at kinetochores as a function of time (It) is plotted relative to the starting signal (I0); error bars indicate the SEM (n ≥ 5 independent conditions). (B–D) Checkpoint signaling and endogenous MPS1 localization were followed in control (siControl; B), PP1αγ-depleted (siPP1; C), and PP2A-B55–depleted (siB55) HeLa MPS1-GFP cells (D). Cells were arrested for 2.5 h with 20 µM MG132 and then either fixed immediately (+MG132), treated with 3 µM nocodazole for 5 min (+Noc), or 5 µM flavopiridol for 1 min, followed by addition of 3 µM nocodazole for 5 min (+CDK-i +Noc). MAD1 and kinetochores (CREST) were detected using antibodies, and MPS1 was detected using GFP fluorescence. (E and F) Kinetochore-associated MAD1 (E) and MPS1-GFP normalized to the mean of the nocodazole-treated control (F) are plotted; error bars indicate the SEM (15 cells and 15 kinetochores measured per cell for three independent experiments).
Figure 2.
Figure 2.
Extended checkpoint responsiveness in the absence of PP2A-B55. (A) Control (siControl) and PP2A-B55–depleted (siB55) Hela GFP-MAD2 cells, left untreated or exposed to 8.25 nM nocodazole, were imaged every 2 min passing through mitosis. Images show the behavior of MAD2 in the presence of 8.25 nM nocodazole with two examples of the siB55 condition. (B) Cumulative mitotic exit frequency was measured in the absence (siCon; n = 28) or presence of 8.25 nM nocodazole (siCon +Noc; n = 76) and following PP2A-B55 depletion in the absence (siB55; n = 33) or presence of 8.25 nM nocodazole (siB55 +Noc; n = 66). (C) NEBD-anaphase duration in 8.25 nM nocodazole is plotted; each point represents an individual cell with mean NEBD-anaphase time and SD shown as bars. ****, P < 0.0001 (Student’s t test).
Figure 3.
Figure 3.
MPS1 is a target of the B55-regulated exit pathway. (A) Unified wiring diagram for the spindle checkpoint and PP2A-B55 pathway. (B–D) Simulation of the system described in the wiring diagram was performed for control (siControl; B), 80% PP2A-B55–depleted (siB55 0.2; C), and 90% MASTL-depleted (siMASTL 0.1; D) conditions. Experimental data points obtained by mass spectrometry are marked by an X, while simulated output is shown in solid lines. (E) Simulation of checkpoint response under conditions used for the checkpoint response assays in Fig. 1 (B and D). (F) Mitotically phosphorylated MPS1-GFP purified from 20 mg of cell lysate was incubated with purified PP2A-B55 or buffer control, and dephosphorylation was analyzed by mass spectrometry. The intensities of the phospho-peptides covering S281 and S821 were plotted.
Figure 4.
Figure 4.
Phosphorylation of MPS1 at S281 regulates its kinetochore localization and checkpoint signaling. (A) Domain organization, functional binding sites, and mapped CDK sites of Homo sapiens MPS1. HeLa Flp-In/TREx GFP-MPS1WT, GFP-MPS1S281A, MPS1S436A, or MPS1S821A cells were depleted of endogenous MPS1. GFP-MPS1 transgenes were induced for a total of 54 h, and then the cells were treated with 0.1 µM Taxol for 2 h. To prevent exit from mitosis, 20 µM MG132 was added for the last 30 min. Cells were stained with antibodies for kinetochores (CREST). (B) HeLa Flp-In/TREx GFP-MPS1WT, GFP-MPS1S281A, or GFP-MPS1S281D cells were depleted of endogenous MPS1. GFP-MPS1 transgenes were induced, and after 24 h, the cells were arrested for 2.5 h with 20 µM MG132, treated with 3 µM nocodazole for 5 min, and then stained with antibodies for MAD1 and kinetochores (CREST). Kinetochore-associated GFP-MPS1 or MAD1 normalized to the mean of the MPS1WT condition are indicated as the mean ± SEM (n ≥ 25 cells and 15 kinetochores measured per cell in four independent experiments). (C) HeLa Flp-In/TREx GFP-Mis12-MPS1WT or GFP-Mis12-MPS1S281A cells were depleted of endogenous MPS1. GFP-Mis12-MPS1 transgenes were induced (+) for 24 h and the cells treated with 0.1 µM Taxol for 2 h and either DMSO (Control) or 2 µM AZ3146 (MPS1-i) for 10 min. Cells were stained with antibodies for BUBR1 and kinetochores (CREST). Mis12-MPS1 was visualized by GFP fluorescence. (D) The bar graphs show the mean levels of Mis12-MPS1WT, Mis12-MPS1S281A, and BUBR1 at kinetochores in both control and MPS1-inhibited cells (MPS1-i). Bars indicate the SEM (15 kinetochores per cell and 12 cells per condition in three independent experiments). (E) GFP-Mis12-MPS1 transgenes were induced for 48 h in HeLa Flp-In/TREx GFP-Mis12-MPS1WT or GFP-Mis12-MPS1S281A cells depleted of endogenous MPS1, and the mitotic index was scored. The graph shows the mean mitotic index from three independent experiments. Error bars indicate SEM. (F) HeLa cells expressing MPS1 GFP-MPS1WT, MPS1S281A, or MPS1S281D were imaged every 2 min as they passed through mitosis. GFP-MPS1 and DNA visualized using SiR-Hoechst are shown. Arrows mark DNA bridges. (G) NEBD-anaphase duration is plotted; each point represents an individual cell with mean NEBD-anaphase time and SD shown. ****, P < 0.0001 (Student’s t test). (H) Cumulative mitotic exit frequency of cells expressing either GFP-MPS1WT (n = 30), GFP-MPS1S281A (n = 28), or GFP-MPS1S281D (n = 25). (I) Simulation of checkpoint regulated mitotic exit for MPS1WT and the MPS1S281A/D mutants, plotted as for the experimental data in H.
Figure 5.
Figure 5.
CDK1 and Aurora B are necessary for MPS1 recruitment to unattached kinetochores. (A) HeLa MPS1-GFP cells were arrested for 2.5 h with 20 µM MG132 and then treated with 2 µM ZM447439 (+AURKB-i) or 5 µM flavopiridol (+CDK-i) for 10 min. BUBR1 and kinetochores (CREST) were detected using antibodies, and MPS1 was detected using GFP fluorescence. (B) Kinetochore-associated BUBR1 and MPS1-GFP normalized to the mean of the nocodazole-treated control are plotted; error bars indicate the SEM (≥5 cells and 15 kinetochores measured per cell for three independent experiments). (C) Schematic showing the proposed relationship between CDK1-CCNB1 and PP2A-B55 activities and centromeric Aurora B (CPC Cen) and kinetochore MPS1 (MPS1 KT) localization. The bottom panel shows the role of MKLP2 in transport of the Aurora B CPC from centromeres to the anaphase spindle. (D) MPS1 and Aurora B localization were followed in control (siControl) and MKLP2-depleted (siMKLP2) HeLa MPS1-GFP cells arrested for 2.5 h with 20 µM MG132 and then either fixed immediately (+MG132), treated with 3 µM nocodazole for 5 min (+Noc) or 5 µM flavopiridol for 1 min, followed by addition of 3 µM nocodazole for 5 min (+CDK-i +Noc). Aurora B and kinetochores (CREST) were detected using antibodies, and MPS1 was detected using GFP fluorescence. Aurora B and kinetochores (CREST) were detected using antibodies, and MPS1 was detected using GFP fluorescence. (E) Kinetochore-associated Aurora B and MPS1-GFP normalized to the mean of the nocodazole treated control are plotted; error bars indicate the SEM (≥5 cells and 15 kinetochores measured per cell for three independent experiments). (F) MPS1 and Aurora B localization were followed in siControl and PP2A-B55–depleted (siB55) HeLa MPS1-GFP cells. (G) Kinetochore associated Aurora B and MPS1-GFP normalized to the mean of the nocodazole treated control are plotted, error bars indicate the SEM (≥5 cells and 15 kinetochores measured per cell for three independent experiments).
Figure 6.
Figure 6.
PP2A-B55 and MASTL determine the CCNB1 threshold for checkpoint signaling. (A) CCNB1 was measured every 2 min in HeLa CCNB1-GFP cells exiting mitosis; see images. Timings are relative to chromosome segregation. (B) The graph shows mean CCNB1-GFP calibrated to a steady-state level of 140 nM CCNB1 in mitosis; bars indicate the SEM (n = 7). (C) Populations of control (siControl), MASTL-depleted (siMASTL), and PP2A-B55–depleted (siB55) HeLa CCNB1-GFP cells were released from a thymidine block for 10 h and then challenged with 3 µM nocodazole for 5 min and stained for MAD1. Checkpoint status and total CCNB1 levels were determined. The fraction of checkpoint-active cells was plotted for bins of 33 nM CCNB1 on the graph for n = 880, 895, or 657 cells for siControl, siB55, and siMASTL, respectively. Colored arrows mark the CCNB1 concentration, below which checkpoint activity became unstable, defined as the 95% threshold. (D) Simulation of spindle checkpoint reactivation at different levels of CCNB1 for the siControl (MASTL = 1.0 and B55 = 1.0), siMASTL (MASTL = 0.1 and B55 = 1.0), and siB55 (MASTL = 1.0 and B55 = 0.2) conditions. Checkpoint response, measured by generation of S281 phosphorylated MPS1 at kinetochores (pMPS1KT), is plotted as a function of time in the line graphs. (E) Simulation of CCNB1 stability in unperturbed mitotic exit (gray line) and after checkpoint reactivation (+Noc) for siControl, siMASTL (MASTL = 0.1 and B55 = 1.0), and siB55 (MASTL = 1.0 and B55 = 0.2) conditions. Numbers indicate CCNB1 level at the time of Noc addition and the corresponding output curve for CCNB1. Solid lines indicate conditions where CCNB1 was stabilized, i.e., the spindle checkpoint was stably active (SAC On), and dotted lines indicate that CCNB1 was destroyed, i.e., the checkpoint failed to become stably active (SAC Off).
Figure 7.
Figure 7.
The anaphase checkpoint reactivation threshold is set by PP2A-B55 and MASTL. (A) Control (siControl), MASTL-depleted (siMASTL), and PP2A-B55–depleted (siB55) HeLa MPS1-GFP CCNB1-mCherry cells were imaged every 1 min until metaphase, identified by spindle architecture, defined by CCNB1 and the lack of MPS1-positive kinetochores, was reached. Checkpoint-silenced cells were then challenged with 3 µM nocodazole and imaged every 1 min for 40 min. (B and C) Fluorescence intensity (It) for MPS1-GFP at kinetochores (B) and total cellular CCNB1-mCherry (C) are plotted over time for single cells (n = 13 for siControl, 7 for siMASTL, and 8 for siB55). Color-coded solid lines mark cells showing a spindle checkpoint (SAC) response, and dotted lines mark cells where the checkpoint remained silent. For MPS1, the black lines mark the mean intensity as a function of time for checkpoint active or silent cells.

References

    1. Abrieu A., Magnaghi-Jaulin L., Kahana J.A., Peter M., Castro A., Vigneron S., Lorca T., Cleveland D.W., and Labbé J.C.. 2001. Mps1 is a kinetochore-associated kinase essential for the vertebrate mitotic checkpoint. Cell. 106:83–93. 10.1016/S0092-8674(01)00410-X - DOI - PubMed
    1. Alfieri C., Chang L., Zhang Z., Yang J., Maslen S., Skehel M., and Barford D.. 2016. Molecular basis of APC/C regulation by the spindle assembly checkpoint. Nature. 536:431–436. 10.1038/nature19083 - DOI - PMC - PubMed
    1. Alfonso-Pérez T., Hayward D., Holder J., Gruneberg U., and Barr F.A.. 2019. MAD1-dependent recruitment of CDK1-CCNB1 to kinetochores promotes spindle checkpoint signalling. J. Cell Biol . 10.1083/jcb.201808015 - DOI - PMC - PubMed
    1. Bastos R.N., and Barr F.A.. 2010. Plk1 negatively regulates Cep55 recruitment to the midbody to ensure orderly abscission. J. Cell Biol. 191:751–760. 10.1083/jcb.201008108 - DOI - PMC - PubMed
    1. Blake-Hodek K.A., Williams B.C., Zhao Y., Castilho P.V., Chen W., Mao Y., Yamamoto T.M., and Goldberg M.L.. 2012. Determinants for activation of the atypical AGC kinase Greatwall during M phase entry. Mol. Cell. Biol. 32:1337–1353. 10.1128/MCB.06525-11 - DOI - PMC - PubMed

Publication types

MeSH terms